
Tracking Positions and Liquidation Levels
Imagine having the ability to monitor high-profile traders like James Wynn, tracking their positions right up to the point of liquidation. Our heatmaps make this possible. By showing where big traders—often referred to as "whales"—are at risk of liquidation as prices fluctuate, they highlight overleveraged positions and liquidity clusters that could contribute to cascading effects.
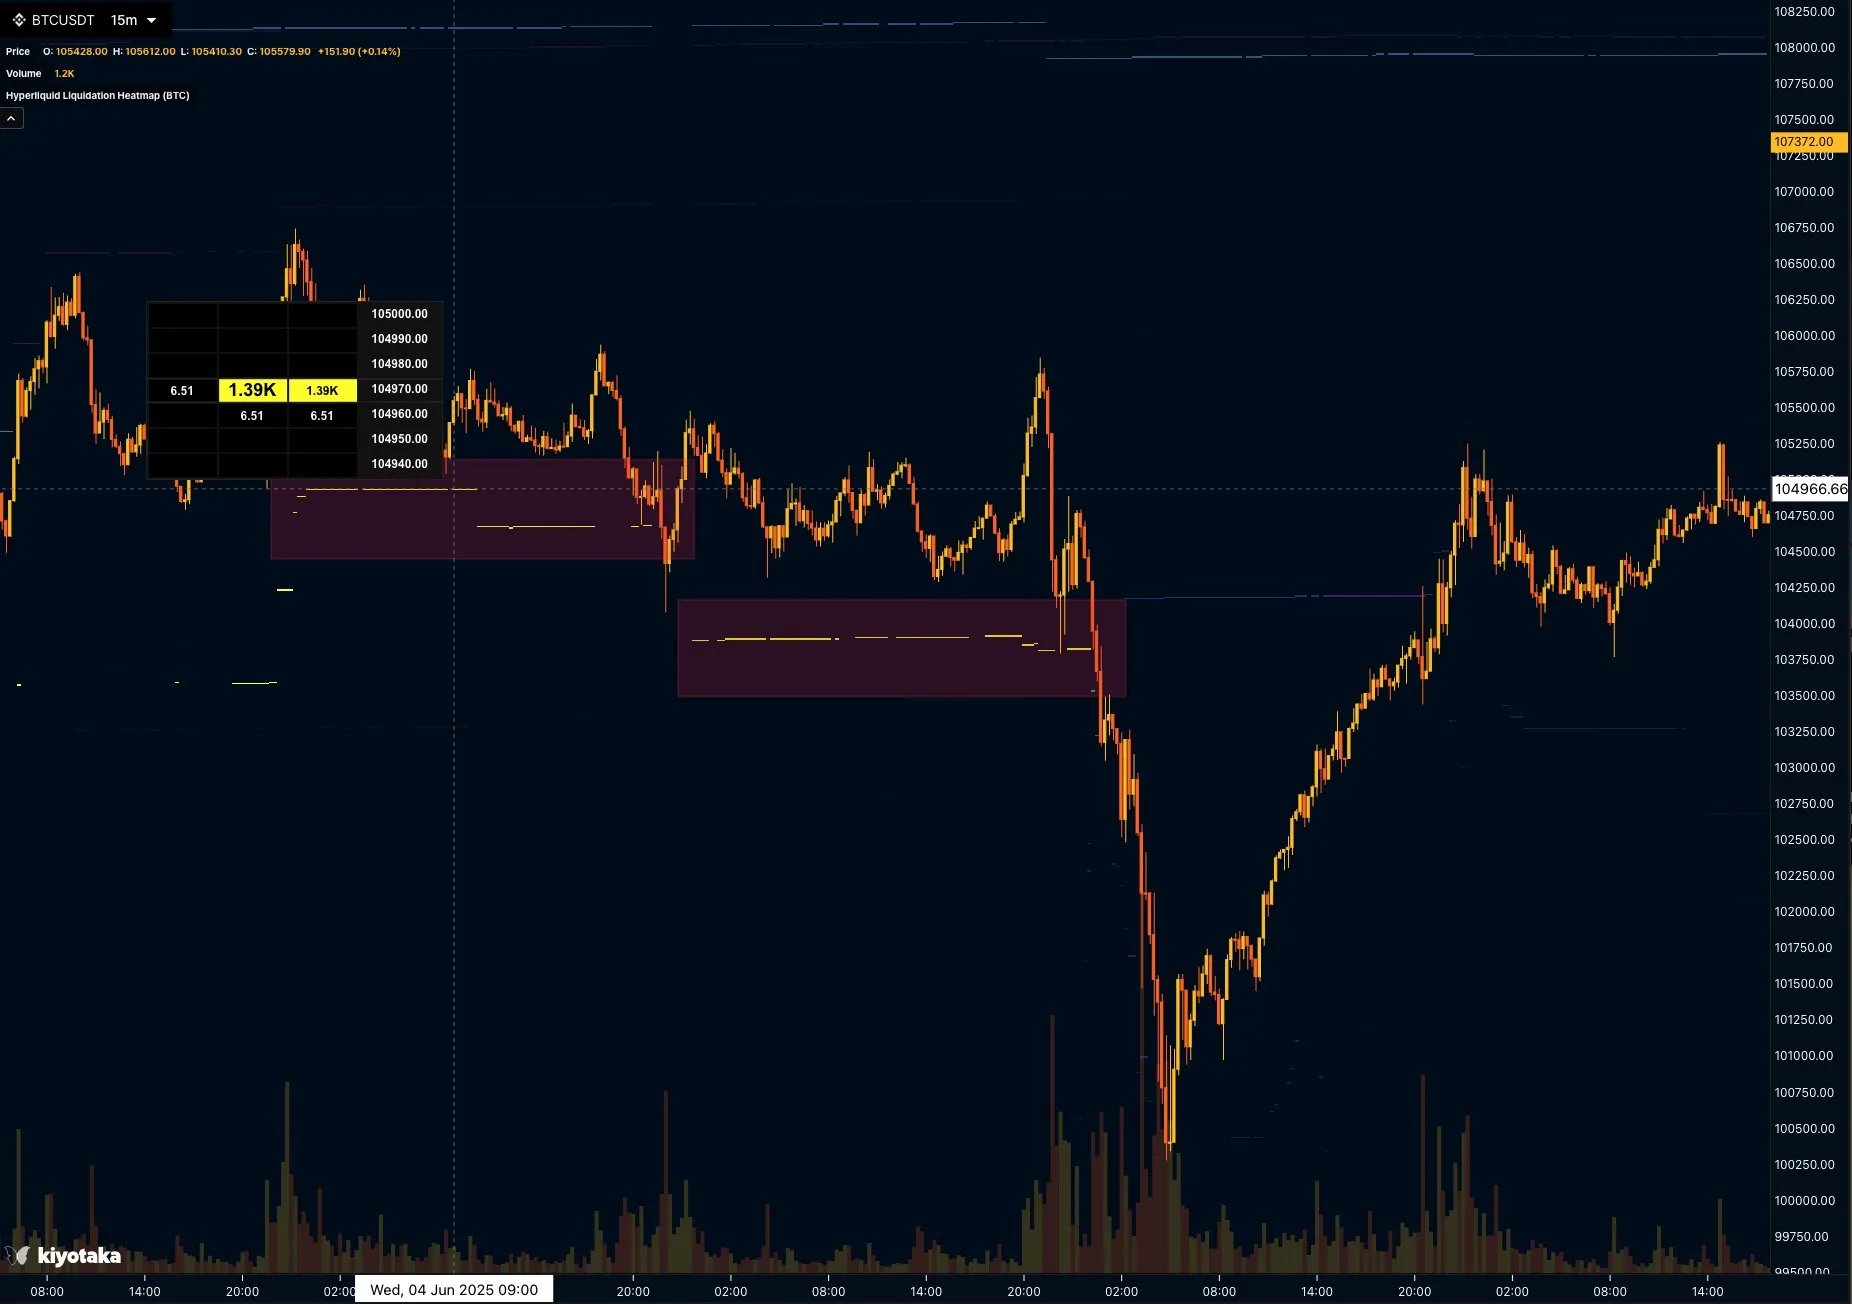
These heatmaps show how leveraged positioning is distributed across price levels.
Why Liquidation Heatmaps Shine on Hyperliquid
Hyperliquid's on-chain, decentralized design sets it apart from traditional exchanges, making it an ideal platform for advanced analytics like liquidation heatmaps. Unlike centralized venues where data can be opaque, Hyperliquid records every position transparently on the blockchain. This transparency allows our heatmaps to aggregate and display actual liquidation thresholds based on real-time leverage, collateral, and price data—turning complex on-chain information into intuitive visual representations.
The intuition behind these heatmaps is rooted in understanding market dynamics: Liquidations occur when a trader's position falls below maintenance margin requirements, forcing automatic closures that can inject sudden selling (or buying) pressure into the market. On Hyperliquid, where trading volumes in perpetuals like BTC/USD or ETH/USD can surge rapidly, many traders watch clusters of liquidation levels as areas where price action can accelerate. For instance, a dense cluster of long positions at a certain price point shows where forced selling could occur if prices dip.
This tool is particularly powerful on Hyperliquid due to its focus on high-leverage trading in a permissionless environment. Traders can operate with up to 50x leverage on select pairs, heightening the risk of liquidations during volatile periods—such as those driven by macroeconomic news or crypto-specific events. By visualizing these risks, our heatmaps help demystify how individual positions contribute to broader market behavior, fostering more informed decision-making.
Practical Use Cases for Traders
Traders use liquidation heatmaps in several ways:
- Risk Management: See your own positions relative to liquidation clusters and the leverage concentrated nearby.
- Volatility Context: See areas where liquidations could cascade, such as during a flash crash. For example, a heatmap can show heavy clustering around $60,000 for BTC on Hyperliquid.
- Whale Watching: See overleveraged large holders and where their liquidation levels sit. Tracking figures like James Wynn provides real-world context.
- Liquidity Mapping: Compare sparse and dense liquidation zones across the price range.
- Cross-Venue Comparison: Compare Hyperliquid's liquidation landscape with other chains or exchanges.
Across these uses, the heatmaps turn raw on-chain position data into a visual map of Hyperliquid's leveraged positioning. Leveraged trading carries substantial risk, and no data view removes it.
What Sets Our Data Apart 🏆
Many liquidation heatmaps on the market depend on approximate models and assumptions. Kiyotaka pulls position data from Hyperliquid's on-chain records, so the levels displayed are computed from actual positions rather than estimated from modelled leverage.
Liquidation levels move as positions, collateral, and prices change, so the map reflects current positioning, not a forecast.
More Heatmap & Integration Goodies 👨🍳
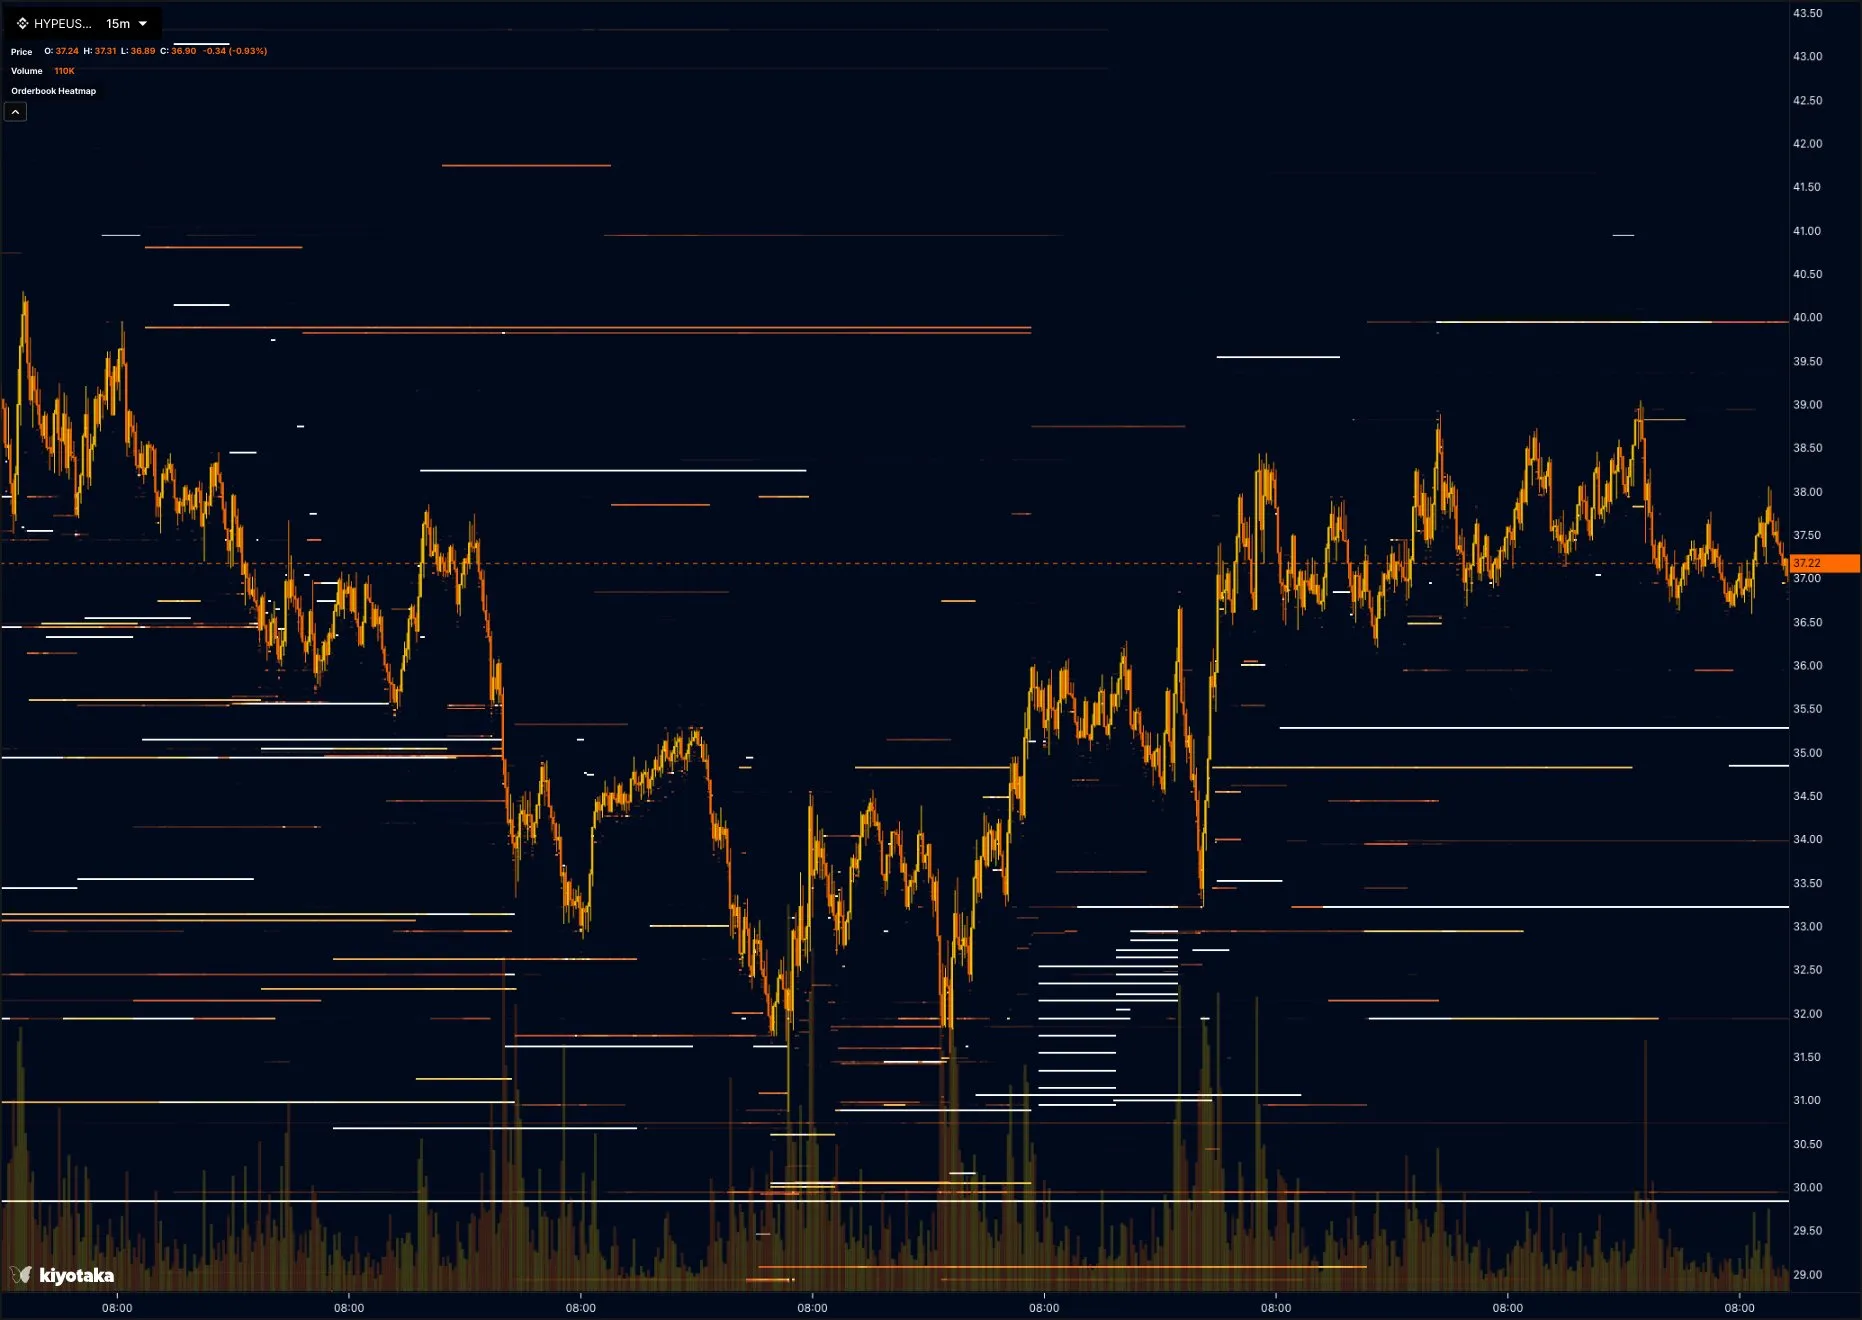
In addition to liquidation heatmaps, we're rolling out order book heatmap support for Hyperliquid, along with integrated HYPE order books from Binance. These enhancements allow for real-time liquidity comparisons across venues, including differences in bid-ask spreads between Hyperliquid's decentralized setup and Binance's centralized liquidity.
Whether you're comparing price differences or analyzing depth across venues, these tools provide a unified view that bridges decentralized and traditional finance.
Looking Forward
We invite you to explore these new features on Hyperliquid today and share your feedback—your insights drive our future developments.
Stay informed.