
NASDAQ:AIAETFClosed
iShares Asia 50 ETF
Open live chart
Free, no account needed
104.73USD
▼ 7.71%day
At close, Nov 20, 4:00 PM ET. Delayed 15 minutes.
107.26▲ 2.42%
After-hoursNov 20, 7:35 PM ET
Prev close 113.49115110105
- 1 day
- ▼ 7.71%
- 1 week
- ▼ 13.63%
- 1 month
- ▼ 16.62%
- 3 months
- ▼ 22.78%
- 6 months
- ▼ 19.20%
- Year to date
- ▲ 10.14%
- 1 year
- ▲ 10.38%
- Day change
- ▼ 8.75
- Previous close
- 113.49
- Open
- 109.75
- Day range
- 104.26 to 110.84
- Volume, USD
- $37M
- Market cap
- $3.8B
- Listed on
- NASDAQ
- 52-week high
- 157.43
About AIA
iShares Asia 50 ETF is listed on NASDAQ under the ticker AIA.
The ETF closed at 104.73 USD on Nov 20, down 7.71% on the day. After-hours it last traded at 107.26 USD, up 2.42% from the close. Stock prices on this page are delayed 15 minutes.
Questions
- What is the AIA ETF price?
- The ETF closed at 104.73 USD on Nov 20, down 7.71% on the day. After-hours it last traded at 107.26 USD, up 2.42% from the close. Stock prices on this page are delayed 15 minutes.
- When does AIA trade?
- Regular trading runs from 9:30 AM to 4:00 PM New York time, Monday to Friday. Pre-market trading starts at 4:00 AM and after-hours trading ends at 8:00 PM.
- Where is AIA listed?
- iShares Asia 50 ETF is listed on NASDAQ under the ticker AIA.
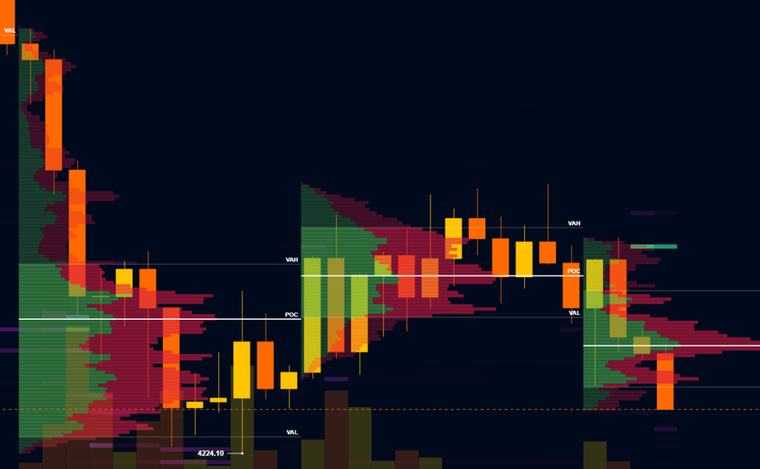 Volume profile
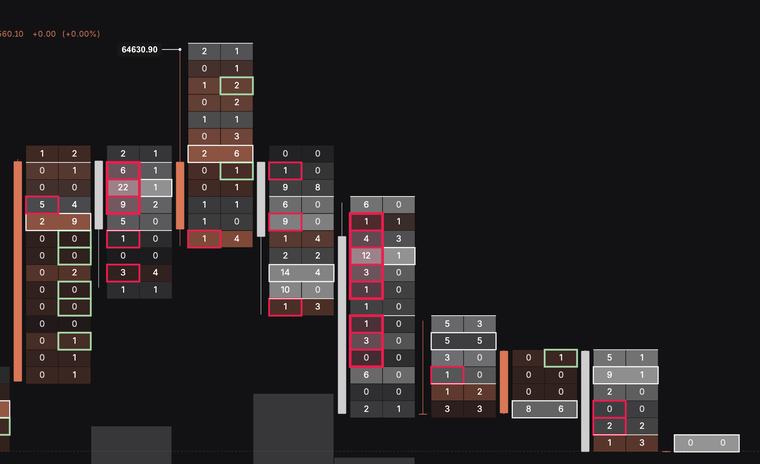 Footprint
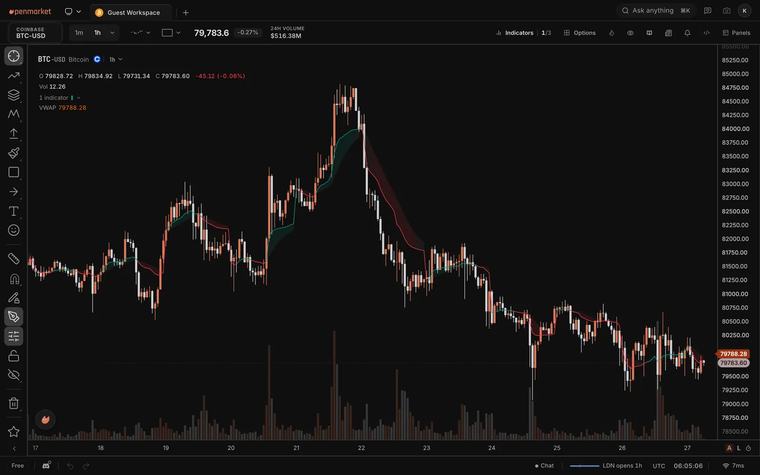 80+ indicators