
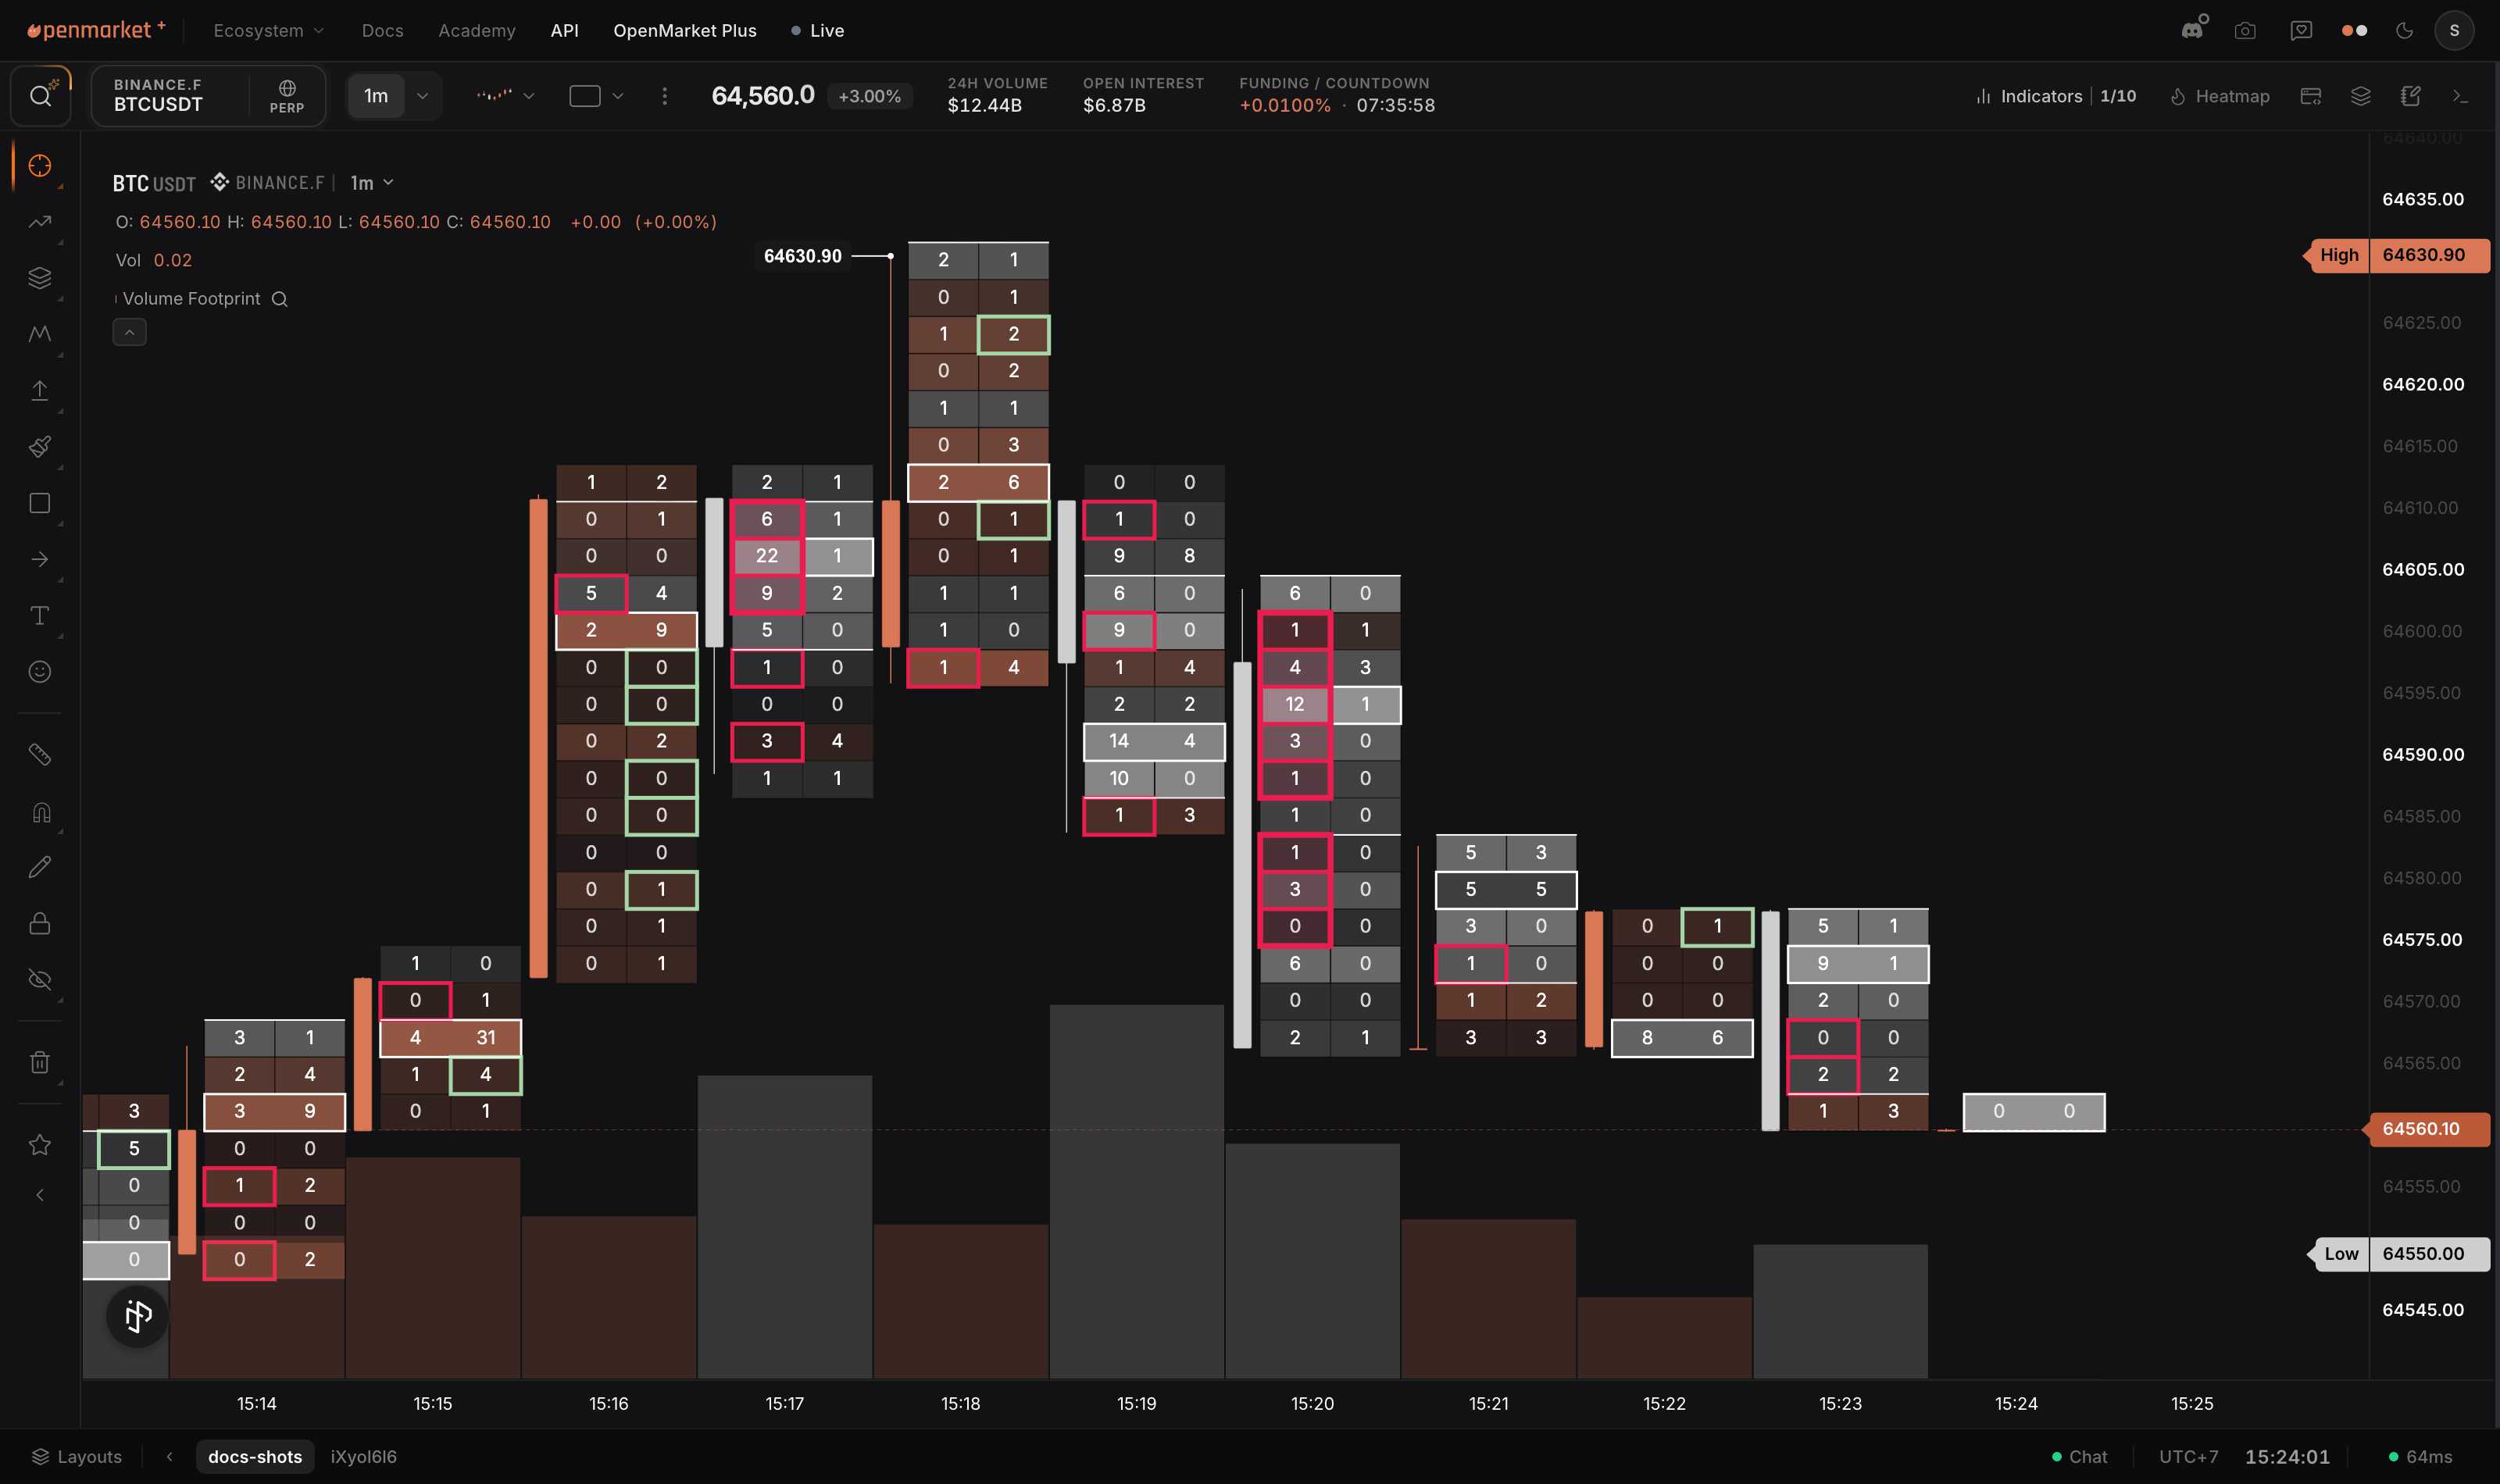
A candle tells you price moved from A to B. A footprint opens that candle up and shows you the fight that happened inside it: at every price level, how much was sold into the bid (left number) and how much was bought at the ask (right number). Once you can read that, moves stop looking random. You can see who pushed, who absorbed, and who gave up.
Add it to your chart
- Open Indicators in the top bar.
- Search for Volume Footprint (or find it under Volume & Footprints).
- Click it once. The footprint renders on your main chart.
Prefer keyboard? Open super search with Ctrl/Cmd+J and type "footprint".
Zoom matters: footprints draw full number grids when candles are wide enough to fit them, and automatically collapse to compact bars when you zoom out. If you see bars instead of numbers, scroll to zoom in a few steps.
How to read one candle
Each row in a footprint is one price level. The two numbers are the two sides of every trade at that level:
- Left column (bid side): volume that traded when sellers hit the bid. Aggressive selling.
- Right column (ask side): volume that traded when buyers lifted the ask. Aggressive buying.
- Highlighted cells: imbalances. One side traded several times more than the other at that price (diagonal comparison, tuned by your threshold). Green boxes mark buy-side dominance, red boxes mark sell-side dominance.
- Outlined row: the POC, the price where this candle traded the most volume. It is where the bulk of the business was done.
The delta of a candle is ask volume minus bid volume: positive delta means buyers were the aggressors on balance, negative means sellers were. You can pin delta, total volume, and cumulative delta as stats rows under every candle in the settings.
What it is good for
- Absorption: price presses into a level, aggressive volume keeps printing into it, and price refuses to continue. Someone is taking the other side quietly. Commonly read as a sign of a potential reversal.
- Initiative: stacked imbalances in the direction of a breakout show the move is backed by aggressive volume, not drifting.
- Exhaustion: volume dries to a trickle at the extreme of a push (tiny prints at the high or low). The aggressor ran out of fuel.
- Unfinished business: an unfinished auction (both sides still printing at the extreme) marks a level often read as likely to be revisited.
The footprint playbook walks through each of these patterns and how traders commonly read them.
Make it yours
The footprint has around 45 settings across five tabs: display modes (cluster grid, split bars, stacked delta and more), imbalance detection, value area and POC lines, stats rows, liquidation markers, and a full color palette. The settings reference documents every one of them, tab by tab, with screenshots.