

 NYSE:SPGIStockClosed
S&P Global Inc.
Open live chart
Free, no account needed
439.57USD
▼ 0.70%day
At close, Nov 20, 4:00 PM ET. Delayed 15 minutes.
439.01▼ 0.13%
After-hoursNov 20, 8:00 PM ET
Prev close 442.66450445440
- 1 day
- ▼ 0.70%
- 1 week
- ▼ 6.61%
- 1 month
- ▲ 2.69%
- 3 months
- ▲ 5.21%
- 6 months
- ▲ 15.24%
- Year to date
- ▼ 11.20%
- 1 year
- ▼ 6.17%
- Day change
- ▼ 3.09
- Previous close
- 442.66
- Open
- 446.55
- Day range
- 438.34 to 453.73
- Volume, USD
- $641M
- Market cap
- $127.4B
- Listed on
- NYSE
- 52-week high
- 522.21
About SPGI
S&P Global Inc. is listed on NYSE under the ticker SPGI.
The stock closed at 439.57 USD on Nov 20, down 0.70% on the day. After-hours it last traded at 439.01 USD, down 0.13% from the close. Stock prices on this page are delayed 15 minutes.
Questions
- What is the S&P Global stock price?
- The stock closed at 439.57 USD on Nov 20, down 0.70% on the day. After-hours it last traded at 439.01 USD, down 0.13% from the close. Stock prices on this page are delayed 15 minutes.
- When does SPGI trade?
- Regular trading runs from 9:30 AM to 4:00 PM New York time, Monday to Friday. Pre-market trading starts at 4:00 AM and after-hours trading ends at 8:00 PM.
- Where is SPGI listed?
- S&P Global Inc. is listed on NYSE under the ticker SPGI.
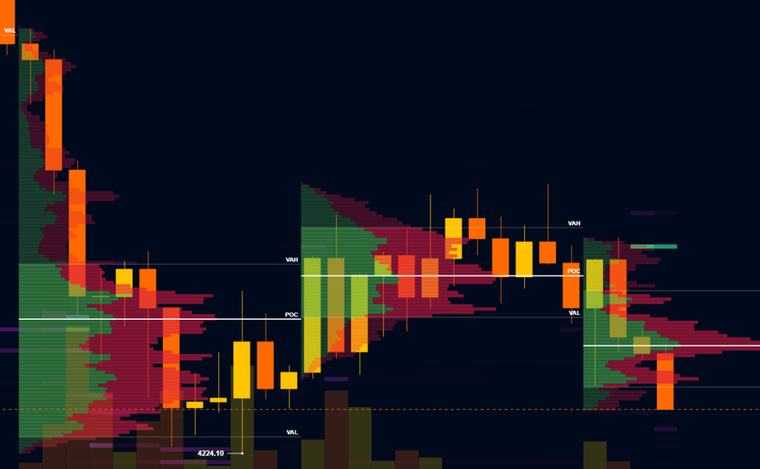 Volume profile
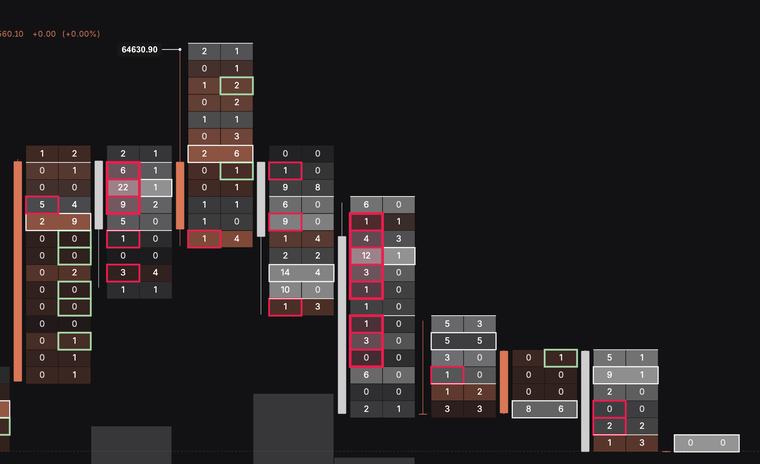 Footprint
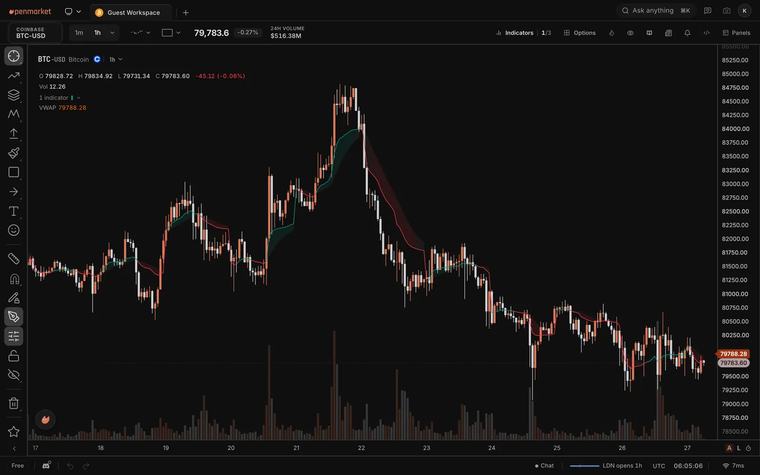 80+ indicators