What the chart shows
Three surfaces read the indicator's newest values and are drawn by the chart from declarations alone: the legend entry, a HUD card at one of the nine anchors, and the card that opens when the cursor rests on a legend entry, a HUD tile or a line.
What it is
The three share one vocabulary of blocks and one rule for text: a
template in double braces, the alert placeholder style. The blocks are
seven kinds, value, rows, spark, gauge, meter, pill and
chips; on a HUD card they are the tile.* constructors, on a hover
card the same constructors under the block.* name
(Blocks and tiles).
Every tile and block reads the newest row, so a data-only output written per bar is the way to carry a delta or a regime onto the card. The declarations are erased before the compiler and ride the sheet alone: the module writes numbers and words per bar and never mentions a tile.
| Home | What it shows | Declared with |
|---|---|---|
| the legend entry | each output's label and its value in the output's format; words after the indicator's name; a slot's words or an output's value as an extra entry | label, format, legend on the output; legend({ title }); render.legend |
| the hover card | the blocks the cursor opens on a legend entry, a HUD tile or a line; without one, the output's tooltip, else its label and value | hover(handle, [block.*]), or hover: [...] on an output, a render.text or a render.label |
| the HUD card | a card of typed tiles at one of the nine anchors, one or two columns | render. |
Declare it
legend({ title }): the words after the indicator's name,(14)style;{{length}}reads a setting by name (Legend).render.legend(name, { text?, value?, format?, color?, color_by?, colors? }): an entry in the legend, a string slot's words (text) or an output's formatted value (value), in a staticcoloror colored per bar by a ladder (Legend).render.hud(name, { position, title?, columns?, tiles }): a card at one of the nine anchors, one or two columns, its tiles from the kit (HUD cards).hover: [...]on an output,render.textorrender.label, orhover(handle, [...])at the top level: the card the cursor opens (Hover cards).badgesnames another output, a ladder whose labels become chips on the card.
A basis line with a titled legend, a regime word in the legend, a four-tile HUD and a hover card with four block kinds:
param.int("length", 20, { min: 2, max: 500 });
param.int("rsi_length", 14, { min: 2, max: 200, label: "RSI length" });
// label, format and tooltip shape the legend entry; the handle names the output for hover() below.
const basis = output("basis", line, overlay, { color: "#2962ff", width: 2, label: "Basis", format: "price", tooltip: "{{label}} {{value:price}}" });
output("rsi", line, lower, { color: "#8b5cf6", label: "RSI", format: "0.0" });
// Data-only: the delta a tile shows beside the basis, and the regime ladder (0 under, 1 over).
output("basis_chg", none);
output("state", none);
string("regime", { max_bytes: 16 });
// The legend reads "<name> (20)" from the length setting; the entry below it is the slot's word, colored by the ladder.
legend({ title: "({{length}})" });
render.legend("regime_entry", { text: "regime", color_by: "state", colors: ["#ef5350", "#26a69a"] });
// A card of four tiles in the top-right corner.
render.hud("board", { position: "top_right", title: "Basis", columns: 2, tiles: [tile.value("Basis", "basis", { format: "price", delta: "basis_chg" }), tile.spark("RSI", "rsi", { bars: 32 }), tile.gauge("RSI level", "rsi", { min: 0, max: 100, format: "int" }), tile.pill("Regime", "regime", { color_by: "state", colors: ["#ef5350", "#26a69a"] })] });
// The card the basis line opens on hover: a lead value, rows, a meter, chips.
hover(basis, [block.value("Basis", "basis", { format: "price", delta: "basis_chg" }), block.rows([["RSI", "rsi", "0.0"], ["Regime", "regime"]]), block.meter("RSI", "rsi", { min: 0, max: 100, marks: [30, 70] }), block.chips("regime")]);

let sma = new Sma(20);
let rsi = new Rsi(14);
let basisValue: f64 = NaN;
let prevBasis: f64 = NaN;

function onStart(): void {
  sma = new Sma(i32(p_length()));
  rsi = new Rsi(i32(p_rsi_length()));
}

function onBar(): void {
  const close = bar.close();
  prevBasis = basisValue;
  basisValue = sma.update(close);
  const rsiValue = rsi.update(close);
  if (isNaN(basisValue) || isNaN(rsiValue)) return;
  out_basis(basisValue);
  out_basis_chg(basisValue - prevBasis);
  out_rsi(rsiValue);
  const over = close > basisValue;
  out_state(over ? 1.0 : 0.0);
  sb_clear();
  sb_text(over ? "over" : "under");
  str_regime_sb();
}What the chart draws
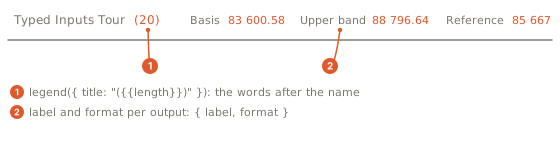
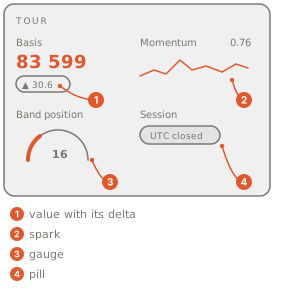
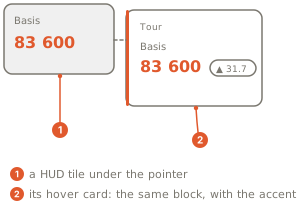
The module above writes five numbers and one word per bar: the legend reads "Basis 20", then "Basis 64,120.5", "RSI 61.3" and the regime word in the ladder's color; the card in the corner shows the basis with its change, a sparkline, a dial and the regime chip; resting the cursor on the basis line, its legend entry or its tile opens the hover card.
Which home answers which question:
| You want | Use | Not |
|---|---|---|
| a word or a value in the legend | label and format on the output, render.legend for a slot's words | a text renderer in the corner |
| an answer when the cursor rests on a line or a tile | tooltip on the output, or a hover block list | a table the user has to read across |
| a corner readout that does not move with price | a render.hud tile, or a one-cell render.table with a position | a label, which sits at its x and y |
| a dashboard | render.hud with typed tiles, or render.table for a grid of words | many labels |
Gotchas
What a card cannot do:
- A block takes its kind's options and nothing else, and a spark's
coloror a pill'scolorsis a literal: a setting paints an output, a renderer or a legend entry only (Blocks and tiles). - A block or tile takes no
size: the pixel size is arender.textandrender.labeloption, and renderer text has no alignment option (Labels, tooltips, badges). - A presentation name used twice is refused.
- The legend, the HUD and the hover card are drawn where the indicator runs in the browser.