Legend
The legend names the indicator, then shows each drawn output's label and value; every word on it comes from a declaration.
What it is
The legend shows each output's label, or its name read as words when
there is none (bb_upper reads "Bb upper"), and its value in the
output's format; legend: false keeps an output out of the legend, and
legend({ title: "..." }) adds words after the indicator's name. Outputs
mount in declaration order, which is their legend and paint order. A
render.legend entry adds a line the outputs do not carry, a string
slot's words or an output's formatted value, printed after the value
lines. The dot before an entry shows the colour the hovered bar is drawn
in, so a color_by ladder, a packed colour or a column's sign pair reads
in the legend as it does on the chart. A candle group is one entry
reading its open, high, low and close (O 1.20 H 1.31 L 1.18 C 1.29),
its dot the up or down colour of the hovered bar. A range() band has a
row of its own (legend: false drops it, label names it), a guide
(role: "guide") never appears, and a pane declared with a title
heads its own legend with that title.
Declare it
legend({ title }): the words after the indicator's name,(14)style;{{length}}reads a setting by name. Without it the legend shows the package name.- Per output:
label(the legend and Style page name),format(price,%,si,int,0,0.0,0.00,0.000,usd,auto) withdecimals(0..8),signedandunit(printed after the value; unbounded on an output, as it always was), andlegend: false.priceprints at the chart's price digits on every pane;usdreads$1.2M,autosix significant digits with,thousands (Styling). - Per band:
range(a, b, { legend: false, label: "Band" }). render.legend(name, { text?, value?, format?, color?, color_by?, colors? }): an entry in the legend, a string slot's words (text) or an output's formatted value (value), in a staticcoloror colored per bar by a ladder (color_byandcolors, both or neither).color: "@name"on a legend entry, or an entry of itscolors, binds that spot to aparam.color, so the user picks the entry's color (The Style page).
param.int("length", 20, { min: 2, max: 500 });
const basis = output("basis", line, overlay, { color: "#2962ff", width: 2, label: "Basis", format: "price", tooltip: "{{label}} {{value:price}}" });
output("rsi", line, lower, { color: "#8b5cf6", label: "RSI", format: "0.0" });
output("state", none);
string("regime", { max_bytes: 16 });
legend({ title: "({{length}})" });
render.legend("regime_entry", { text: "regime", color_by: "state", colors: ["#ef5350", "#26a69a"] });
What the chart draws
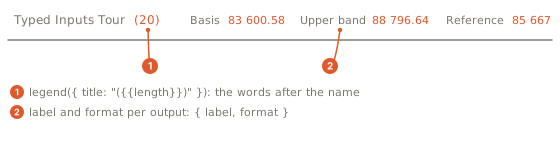
The legend reads "Basis 20", then "Basis 64,120.5", "RSI 61.3" and the
regime word in the ladder's color. An output's tooltip is shown on its
legend entry, and resting the cursor on the entry opens the output's
hover card (Hover cards).
Gotchas
legend: falsekeeps an output out of the legend;visible: falsestarts it hidden; arole: "guide"output is never listed.decimals,signedand a printedunitneedformat; aunitwithout one is recorded and never printed.- A legend entry needs
text(a string slot) orvalue(an output), and takescolor_byandcolorstogether, not one without the other. legendneeds a nonempty title.- A presentation name used twice is refused.
- The legend is drawn where the indicator runs in the browser.