Style anything
Every part a wrun indicator draws can be styled. A line, a column, a docked profile, a card in a corner, a label, a strike board and a pane each take their look as words in the declaration, and the chart draws what the words say; the code only writes numbers.
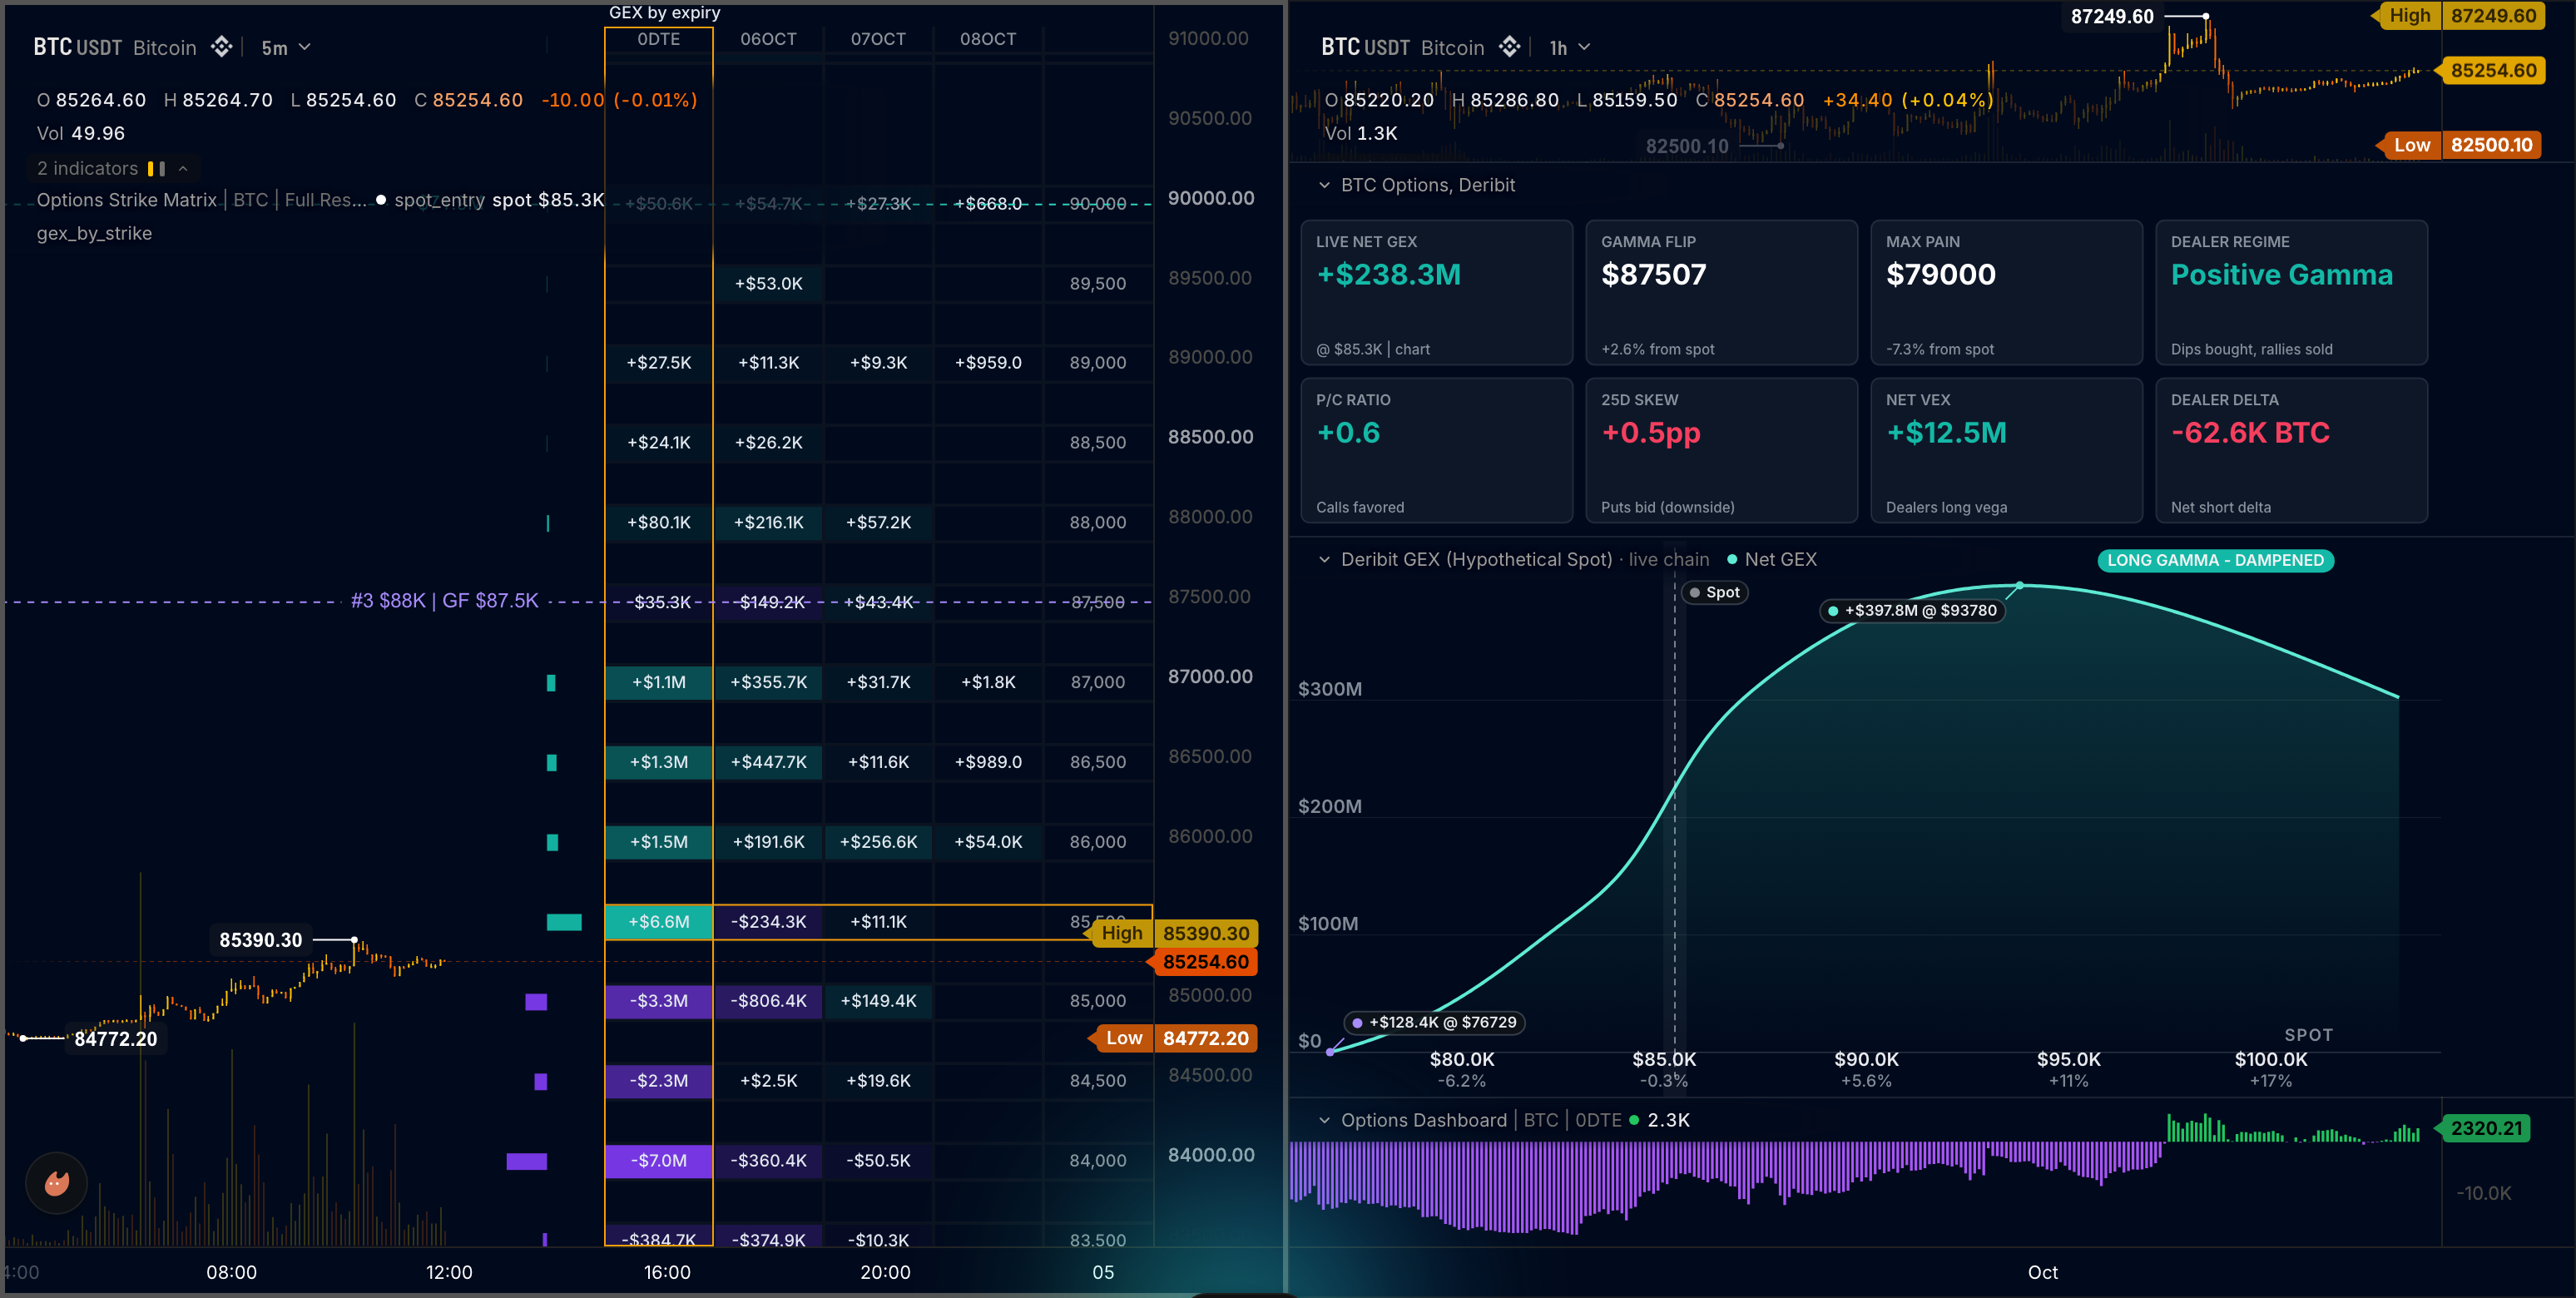
This page walks one real indicator part by part, an options desk: a strike matrix docked on the price axis, a dashboard of tiles, a gamma curve and a cumulative volume delta. Each part shows its picture, the lines of the desk that style it, the words that matter most, and the page that lists every word.
The two files are cookbook recipes and template cards of their own: Strike Matrix is the left cell (the board, the per-strike bars and the levels, under On price) and Options Dashboard the right (the tiles, the gamma curve and the rolling CVD, under Beyond the time axis); each compiles as written, on a chart of a coin with a listed options chain.
The whole desk is eight declarations, two files on two chart cells; the frames, outputs and slots they read come first:
const board = frame("board", { max_bytes: 32768 });
const gexRows = frame("gex_rows", { max_bytes: 16384 });
const tileRows = frame("tile_rows", { max_bytes: 4096 });
const gexCurve = frame("curve_rows", { max_bytes: 16384 });
output("t_prev", none, overlay);
output("t_last", none, overlay);
output("flip_price", none, overlay);
output("cvd_sign", none, lower);
string("flip_text", { max_bytes: 32 });
plot.matrix({ name: "gex_board", frame: board, dock: "right", column_width: 66, row_max_px: 22, price_column: true, header: true, palette: ["theme.down", "theme.bg", "theme.up"], center: 0, scale: "sqrt", opacity: 0.95, format: "usd", signed: true, decimals: 1, font_size: 10, font_weight: "medium", align: "center", text_color: "theme.text", cell_padding: 3, grid_color: "theme.bg", grid_width: 2, grid_style: "solid", grid_lines: "all", highlight_color: "#f8c000", label: "GEX by expiry", tooltip: "{{column}}: {{value:usd}} net GEX at {{price}}" });
plot.levels({ name: "gex_by_strike", frame: gexRows, dock: "right", width_px: 100, baseline: "center", labels: false, opacity: 0.95, thickness_px: 10, format: "usd", signed: true, hover: true, offset: [340, 0] }); // offset: the board's width (4 columns of 66 px plus the price column), so the bars sit left of it instead of under it
draw.line("flip_line", { x1: "t_prev", y1: "flip_price", x2: "t_last", y2: "flip_price", color: "theme.text", width: 1, line_style: "dashed", extend: "both" });
handles.label({ anchor: "right", align: "right", style: "knockout", font_weight: "medium" });
panel.tiles({ name: "tiles", title: "Options, Deribit", x: "category", place: "below", frame: tileRows, columns: 4, accent: "auto", positive_color: "theme.up", negative_color: "theme.down", format: "usd", signed: true, hover_card: true, height_frac: 0.18 });
panel.line({ name: "gex_curve", title: "Deribit GEX (Hypothetical Spot)", x: "number", place: "below", frame: gexCurve, series: [{ name: "Net GEX", color: "theme.text", width: 2 }], chrome: "grid", smooth: true, fill_mode: "signed", fill_positive_color: "theme.up", fill_negative_color: "theme.down", fill_fade: true, x_format: "usd", x_decimals: 1, format: "usd", signed: true, decimals: 0, x_title: "Spot", y_zero: true, legend_style: "none", hover_card: true, height_frac: 0.25, maximize: true, stats_row: true });
output("cvd", histogram, lower, { pane: "cvd", color_by: "cvd_sign", colors: ["theme.down", "theme.up"], width: 0.7, label: "Agg. Rolling CVD", format: "si", description: "Rolling cumulative volume delta: aggressive buys minus sells over the window" });
pane("cvd", { height_frac: 0.12, format: "si" }); // the Indicator's home pane: it carries the Indicator's name, so no title here
The map
| Part | What you see | The words that matter most | Full page |
|---|---|---|---|
| Side charts | a small chart of its own below the candles: the gamma curve | chrome, legend_style, smooth, glow, fill_mode, markers, badge, height_frac | Frames, panels and compact widgets |
| Levels and profiles | bars docked on the price axis, one per strike | dock, width_px, baseline, thickness_px, offset, hover, poc, opacity | Docked profiles |
| Cards and HUDs | the dashboard: eight tiles below the chart | columns, accent, positive_color, negative_color, format, look, chrome, background_ | Panel words, HUD cards |
| Labels and drawings | a line across the chart at the gamma flip, its label just left of the strike bars | style, align, valign, font_weight, line_style, extend, sticky_right, axis_label | Drawing objects |
| Lines over time | the rolling CVD as columns, one number per bar | color_by, colors, width, label, format, split, fill_color, glow | Styling, Plotting |
| Price canvases | the strike matrix: a row per strike, a column per expiry | palette, center, scale, column_width, highlight_color, grid_lines, format, font_weight | Price canvases |
| Panes | the tiles, the curve and the CVD stacked under the chart | height_frac, format, title, place, scale, invert, padding, min | Panes |
| Theme and the Style page | the same desk on a light chart, with the user's own colours | theme.* tokens, "@name", param.color, param.choice, contrast_guard, stack_handles | Theme colours, The Style page |
Side charts
A side chart is a small chart of its own, in a pane below the candles
or in the strip beside them. The desk's gamma curve is a panel.line
over a decimal x, the hypothetical spot; its dashboard of tiles is a
panel.tiles (the next part). Reach for one when the picture is not one
value per bar: a curve over strikes, a count per weekday, a board of
numbers. The module writes the rows as a frame; the look is the
declaration's words, and the per-run chrome (the markers, the caption,
the badge chip) rides in the frame beside the rows.
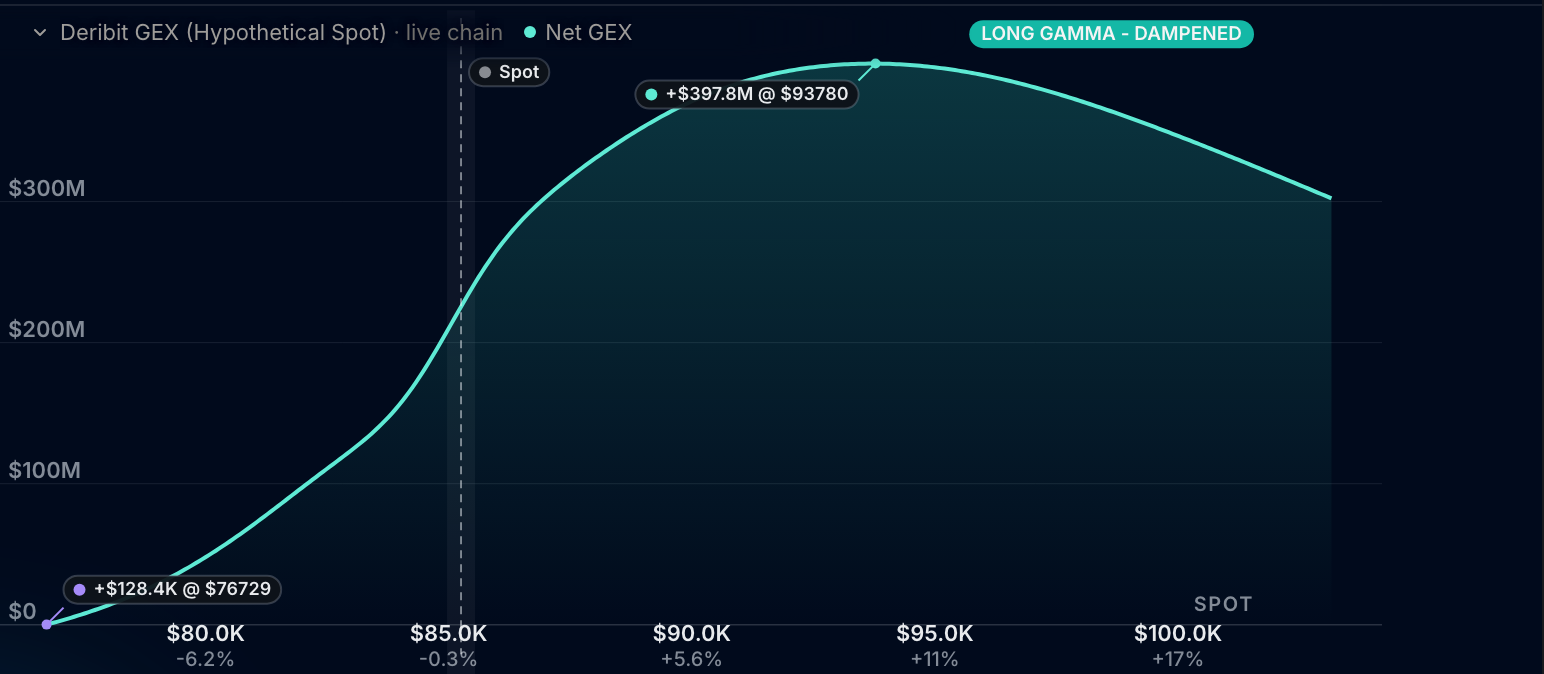
const gexCurve = frame("curve_rows", { max_bytes: 16384 });
// The gamma curve: a smooth line in the chart's text ink over hypothetical spot, filled in the up colour above zero
// and the down colour below, both axes in dollars; the spot marker, the point callouts (the flip, the peak, the trough)
// and the regime badge chip are written per run into the frame. The one series needs no legend chip: the title names
// it and the hover card reads it.
panel.line({ name: "gex_curve", title: "Deribit GEX (Hypothetical Spot)", x: "number", place: "below", frame: gexCurve, series: [{ name: "Net GEX", color: "theme.text", width: 2 }], chrome: "grid", smooth: true, fill_mode: "signed", fill_positive_color: "theme.up", fill_negative_color: "theme.down", fill_fade: true, x_format: "usd", x_decimals: 1, format: "usd", signed: true, decimals: 0, x_title: "Spot", y_zero: true, legend_style: "none", hover_card: true, height_frac: 0.25, maximize: true, stats_row: true });
The frame the module writes beside the rows, with the chrome of this run: the spot marker, three point callouts pinned on the curve, the caption and the badge chip (the flip callout is written only when the curve crosses zero):
{
  "rows": [
    [76726.8, 65600],
    [76932.9, 787123],
    [93776.5, 398200000]
  ],
  "markers": [
    { "x": "spot", "label": "Spot", "badge": true, "wash": true },
    {
      "x": 76820.4,
      "valign": "point",
      "series": "Net GEX",
      "label": "Gamma flip",
      "color": "theme.text",
      "badge": true,
      "show_value": true
    },
    {
      "x": 93776.5,
      "valign": "point",
      "series": "Net GEX",
      "label": "+$398.2M @ $93776",
      "color": "theme.up",
      "badge": true
    },
    {
      "x": 76726.8,
      "valign": "point",
      "series": "Net GEX",
      "label": "+$65.6K @ $76726",
      "color": "theme.down",
      "badge": true
    }
  ],
  "caption": "live chain",
  "badge": { "text": "LONG GAMMA - DAMPENED", "color": "theme.up" }
}
The words that matter:
chromepicks the frame:"box","grid"or"none"; the rich words of a line (smooth,glow,animate, the fills,markers) need"grid"or"none".legend_style("none","title","pane","chips") andlegend_latestput the series names and their last values on the panel;hover_cardis the readout under the pointer.height_fracis the pane's share of the chart;place: "side"withwidth_pxandheight_pxmoves the panel into the strip beside the price pane.fill_mode: "signed"withfill_positive_colorandfill_negative_colorshades a line around zero andfill_fadefades the fill away from the line;stroke_fadefades the stroke away from a pivot;markersrule off an x of note.badgeputs a chip on the panel's title row (text, acolorthat defaults totheme.accent, atext_colorthat defaults to whichever of light or dark reads on the fill); a marker withvalign: "point"is a callout pinned to the curve, at the value of the declaredseriesit names (the first series by default) or at an exacty. Both are frame keys too, so the module can rewrite the chip and point at the peak it found on every run.x_title,y_title,x_formatwithx_decimals,y_zeroandy_min,y_maxdress the axes;maximizeandstats_rowadd the fullscreen button and the strip.
Every panel word, kind by kind, is on Panel words; the strip beside the chart is on The strip beside the chart.
Levels and profiles
A docked profile is one bar per price along the price axis, drawn from a
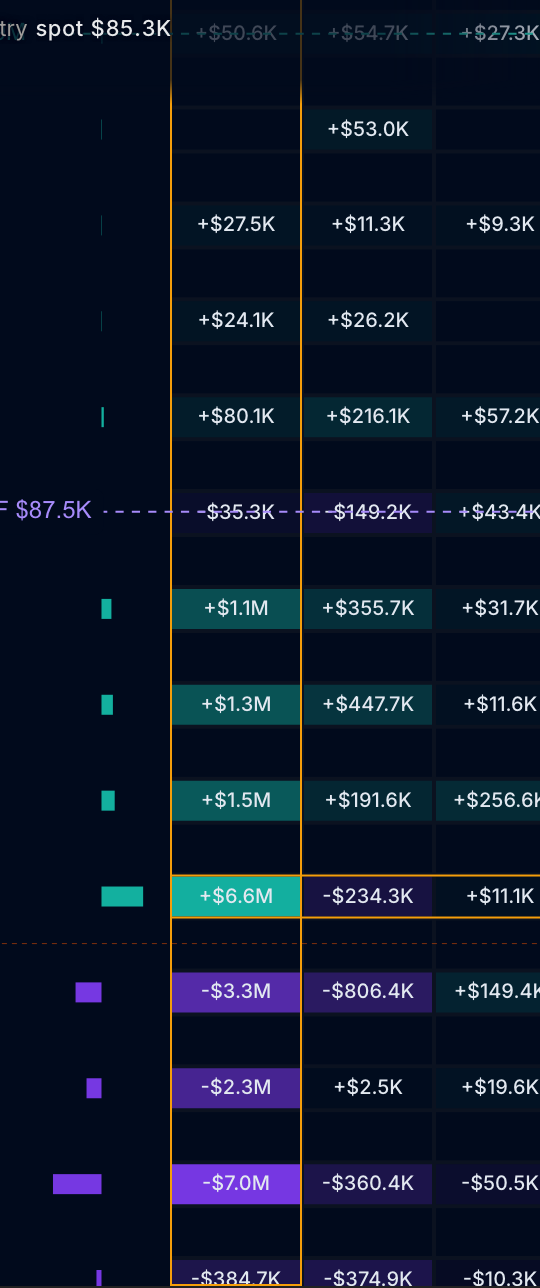
frame the module writes. On the desk it is net gamma by strike: zero
sits mid-dock, positives grow one way and negatives the other, each row
in its own colour from the frame, a hover card per row. Reach for it
when a number lives at a price rather than at a time: open interest by
strike, volume by price, a liquidation map. plot.profile draws the
same shape from the chart's own volume cells with no frame. Two canvases
docked on the same side overprint and no word stacks them: offset: [340, 0], the board's width, pushes the bars inward so they sit left of
the board instead of under it.
const gexRows = frame("gex_rows", { max_bytes: 16384 }); // the bars: net GEX per strike, the board's row sums
// The per-strike net GEX bars beside the board: zero mid-dock, positives one way and negatives the other, each row
// in its own colour from the frame, a hover card per row, pushed inward past the board (both dock right), 100 px wide.
plot.levels({ name: "gex_by_strike", frame: gexRows, dock: "right", width_px: 100, baseline: "center", labels: false, opacity: 0.95, thickness_px: 10, format: "usd", signed: true, hover: true, offset: [340, 0] }); // offset: the board's width (4 columns of 66 px plus the price column), so the bars sit left of it instead of under it
The frame carries one price, one value, one colour and one hover hint per row:
{
  "prices": [84000, 84250, 84500],
  "values": [-1200000, 350000, 2400000],
  "colors": ["theme.down", "theme.up", "theme.up"],
  "tooltips": [
    "C +$1.2M | P -$2.4M",
    "C +$0.9M | P -$0.5M",
    "C +$2.6M | P -$0.2M"
  ]
}
The words that matter:
dockand a fixedwidth_px(orwidth_frac) place the profile;offsetandbesidenest one profile inside another.baseline: "center"grows positive rows one way and negative the other;seriessplits a row into stacked segments, each with its colour.thickness_pxcaps a bar's height andstepgives every row a price band of its own (a strike ladder).labels,label_place,formatwithsigned,text_colorandfont_sizeprint the rows;hoveropens the chart's card on a row, with the frame'stooltipsas its hint.poc,poc_color,poc_width,poc_line_style,poc_extendandpoc_labeldraw the point of control; thevalue_area_*words rule off the value area andoutside_opacityfades the rows beyond it.opacity,gradient,border_color,shape: "outline"andbehind_candleschange how the bars paint.
Every word, with its range, is on Docked profiles; a profile over the chart's own cells is on Profiles anchored in time.
Cards and HUDs
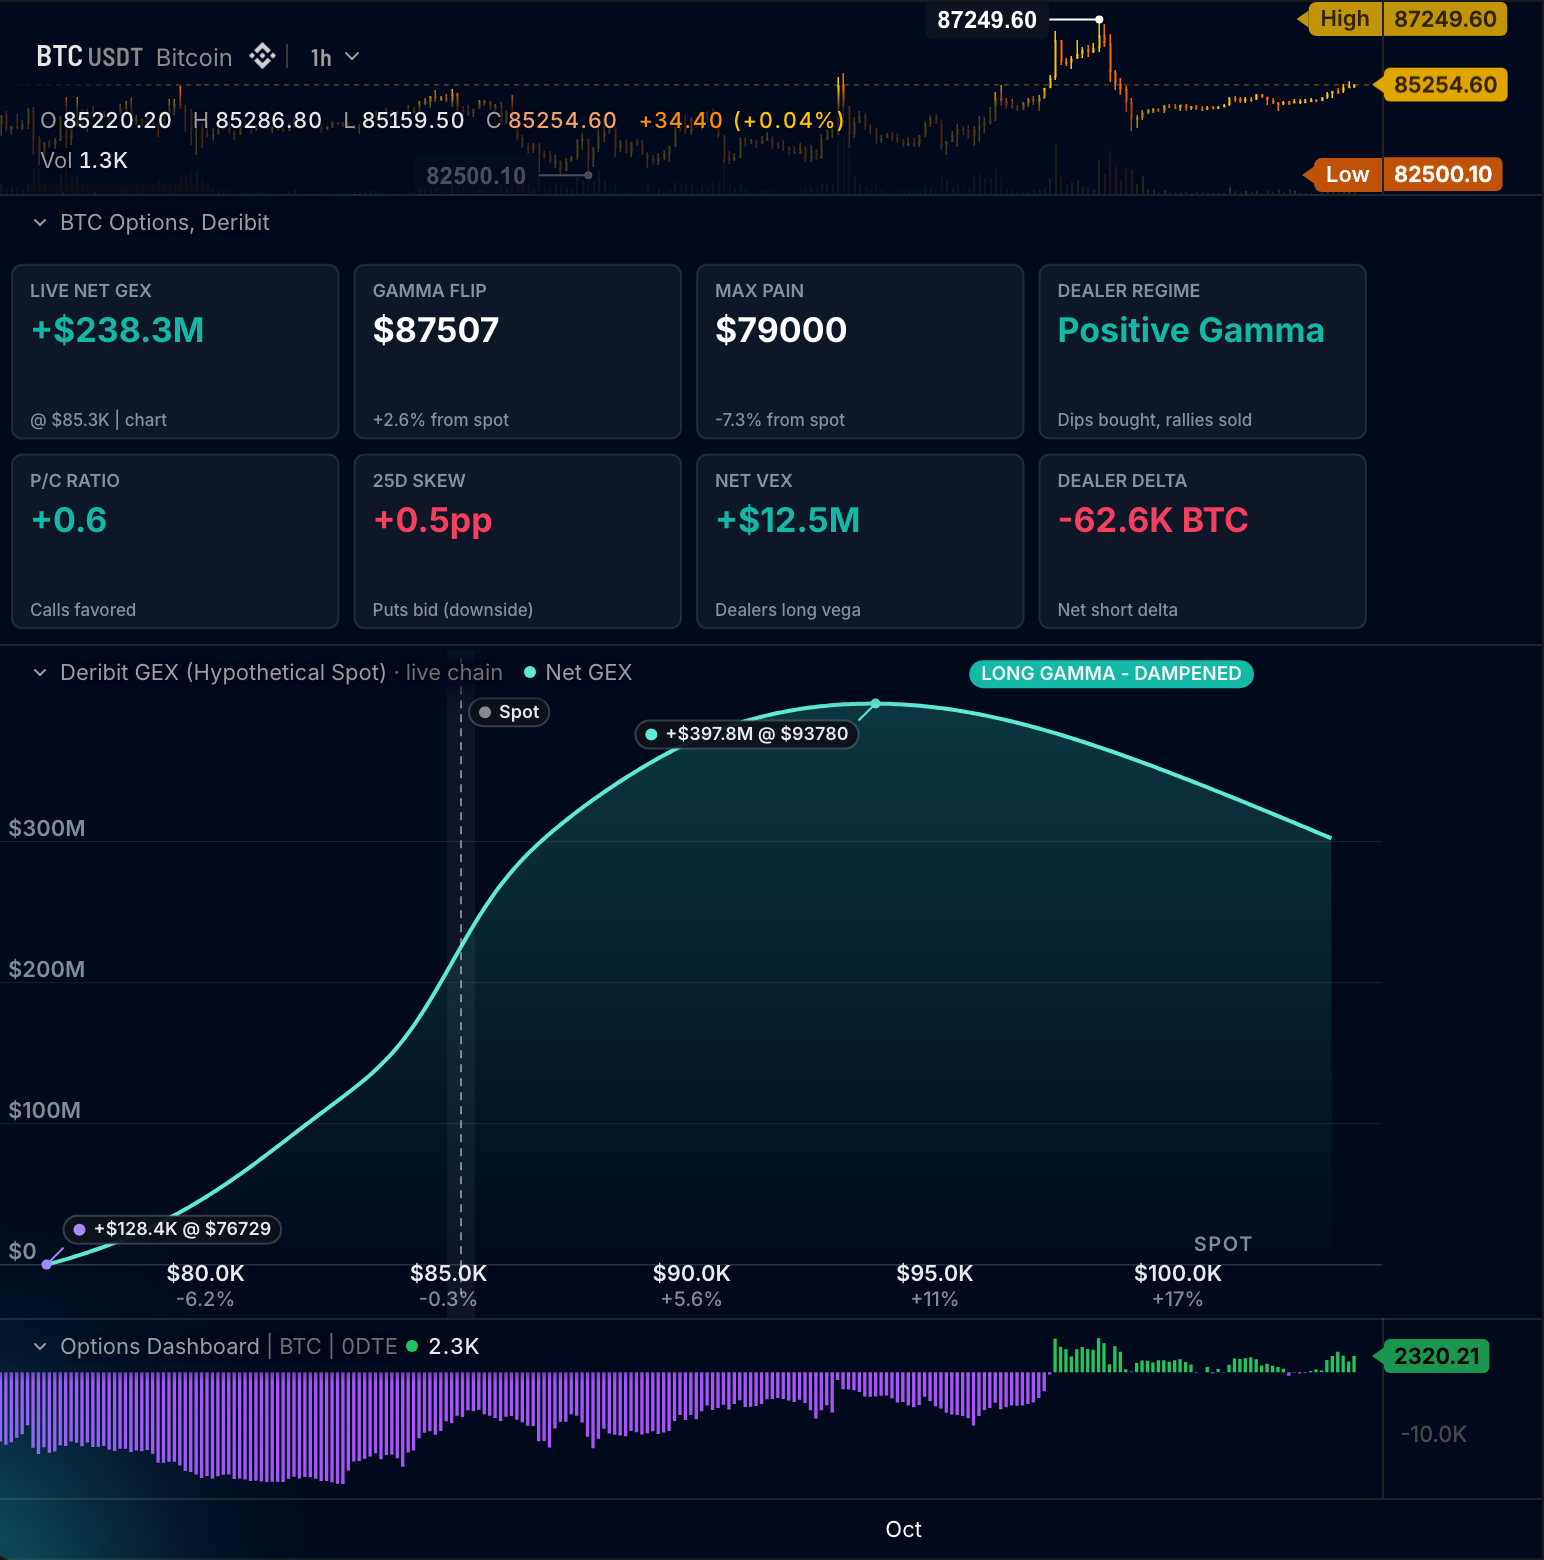
A dashboard is a panel of tiles below the chart, or a card pinned at one
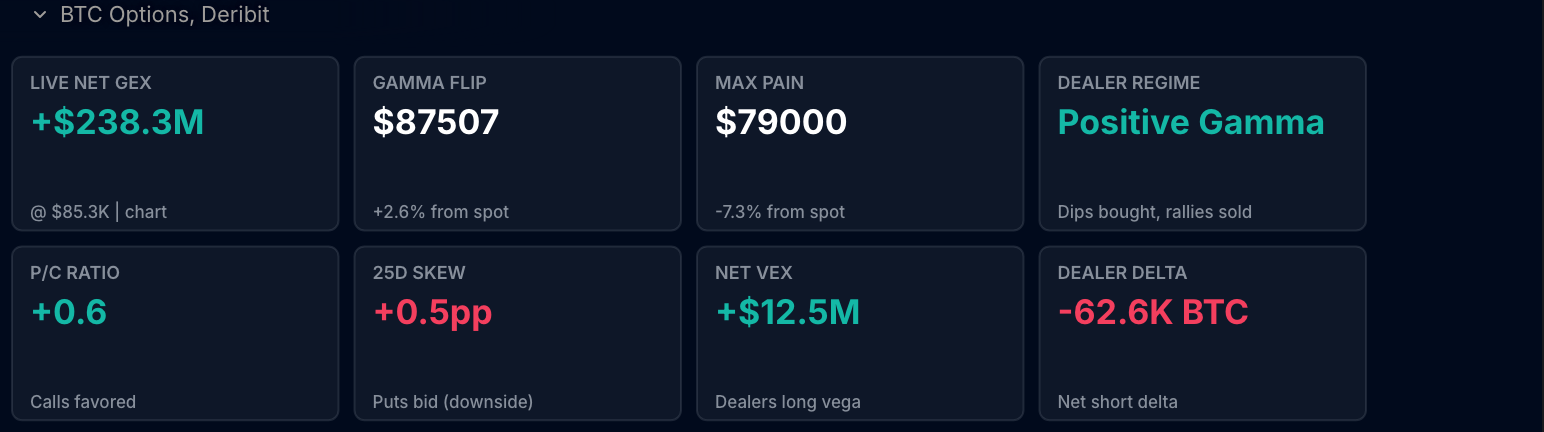
of the nine anchors that never moves with price. The desk's eight tiles
are a panel.tiles: a label, a value, a caption and a colour per tile,
written per run into the frame; the panel prints signed dollars, a
tile's own format word or text wins, and the accent tints a numeric tile
by its sign. Reach for a tiles panel when the numbers need room; for a
readout that floats over the candles, a render.hud card picks a whole
look at once, and a status card (draw.card), a ladder, a feed and a
meter take the same surface and chrome words.
const tileRows = frame("tile_rows", { max_bytes: 4096 });
// Eight tiles in two rows of four: the panel prints signed dollars, a tile's own format word or text wins, and the
// accent tints a numeric tile by its sign (the chart's up colour above zero, its down colour below); a tile with its own
// colour keeps it. The tiles, the curve and the CVD pane take 0.55 of the chart, so the candles keep the rest.
panel.tiles({ name: "tiles", title: "Options, Deribit", x: "category", place: "below", frame: tileRows, columns: 4, accent: "auto", positive_color: "theme.up", negative_color: "theme.down", format: "usd", signed: true, hover_card: true, height_frac: 0.18 });
The rows as the module writes them, [label, value, caption, color, spark, format] with null to skip an element; the neutral values carry
theme.text, so they read on the light chart too:
{
  "rows": [
    ["Live net GEX", 235182438, "@ $85.2K | chart", null, null, "usd"],
    ["Gamma flip", "$87,526", "+2.7% from spot", "theme.text"],
    ["Max pain", "$79,000", "-7.3% from spot", "theme.text"],
    ["Dealer regime", "Positive Gamma", "Dips bought, rallies sold", "theme.up"],
    ["P/C ratio", "0.63", "Calls favored", "theme.up"],
    ["25D skew", "+0.1pp", "Puts bid (downside)", "theme.down"],
    ["Dealer delta", "-62.1K", "Net short delta, in coins", "theme.down"]
  ]
}
The words that matter:
- A tiles panel:
columns(1 to 8),accent("auto"tints a numeric tile by its sign,"neutral"leaves it),positive_colorandnegative_color,formatwithsigned,decimalsandunitfor every value it prints,hover_card,height_fracandtitle; a row's owncolor,sparkandformatwin over the panel's. - A HUD card:
lookis one of twelve presets (glass,terminal,cockpit,phosphorand the rest) and any word beside it wins;chromethe frame ("card","none","brackets","rules","tag","title_bar","window","cover");texture: "scanlines"the finish. - The surface:
background_colorwithbackground_opacity, orbackground_gradientwithgradient_direction;border_color,border_width,border_style;corner_radius,padding,shadow,opacity. - The type and the accent:
font_family,text_color,title_text_color,title_case,label_case,text_glow;accent_color, oraccent_color_bywithaccent_colorsso the whole card follows an output per bar. - Size and place:
width,offset,z,safe_area,mobile; each tile'sdraw,colororcolor_bywithcolors,headline,font_size,height.
The tiles words are on Panel words and the rows on Panel rows, kind by kind; every HUD word is on HUD cards and the twelve looks on Looks; the card, ladder, feed and meter words on Status cards and Ladder, feed and meter.
Labels and drawings
A drawing is one object placed from the newest bar. The desk draws each
of its levels as a dashed line across the whole pane and a knockout
label that ends just left of the strike bars, so it never covers a cell
of the board; the gamma flip is the pair below, and the largest GEX
strike, max pain and the put wall repeat it in their own colours. The
line is a draw.line; the label is a handle the live bar places in
pixels from the price axis at the level's price, its text a slot the
live bar writes. Reach for draw.* when one declaration is one object;
for a mark on every signal bar use render.text or render.shape, and
for an object the module moves and deletes later, a handle. Every look
word is optional, and absent keeps the object's usual look.
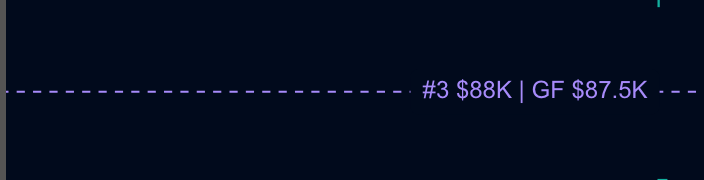
output("t_prev", none, overlay);
output("t_last", none, overlay);
output("flip_price", none, overlay);
string("flip_text", { max_bytes: 32 });
// The gamma flip: one dashed line across the whole pane, placed from the newest bar.
draw.line("flip_line", { x1: "t_prev", y1: "flip_price", x2: "t_last", y2: "flip_price", color: "theme.text", width: 1, line_style: "dashed", extend: "both" });
// Its knockout label: a label handle placed in pixels from the price axis (x) at the level's price (y), right-aligned
// so its right edge sits just left of the bars.
handles.label({ anchor: "right", align: "right", style: "knockout", font_weight: "medium" });
const tags: LabelHandle[] = [draw.label(0), draw.label(1), draw.label(2), draw.label(3)]; // the wall, the flip, max pain, the put wall; handle objects allocate once
// On the live bar, with the text built in the line buffer; inset is the board's and the bars' width in pixels.
tags[1].set(inset, flipPrice).text(str_flip_text_sb).color(theme.TEXT);
The words that matter:
- A line:
width,line_style,extend("none","left","right","both"),arrow,glowwithglow_color,sticky_right,axis_labelandopacity. - A label:
stylefrom eight words (plain,box,knockout,emblem,pill,badge,callout,price_label;knockouthides what is behind the text),align(which edge of the text sits on x),valign,background_color,border_color,border_width,corner_radius,padding,font_weight,font_family,emblem_shapewithemblem_color,max_widthandangle. - A label handle:
handles.label(...)takes the label words as the defaults every label handle starts from;anchor: "right"measures its x in pixels from the price axis while its y stays a price, and the setters (set,text,color) place, word and paint each one per run. - A box:
coloris the fill, thenborder_*,shape: "ellipse",gradientwithgradient_direction, andtextwith itstext_color,font_size,align,valignandpadding. - A renderer mark takes the same label
stylewords pluslabel_position,size,size_byand acolor_byladder;tooltipis a template shown on any of them.
The drawings are on Run-level drawings, every setter a handle takes on Every look a handle takes, the pixel anchors on Pane pixel placement, and the renderer marks on Labels, tooltips, badges.
Lines over time
A line over time is an output: one number per bar that the chart draws
as a line, an area, columns or marks. The desk's rolling CVD is a
histogram coloured by a sign ladder, columns in the chart's down colour
below zero and its up colour above, in a pane of its own that prints K and M on its axis. Reach
for the output words first: they are the cheapest look, and every drawn
output can carry an alert once the indicator is published.

input("buy", trades.volume, { side: "BUY", missing: "zero", description: "Aggressive buy volume" });
input("sell", trades.volume, { side: "SELL", missing: "zero", description: "Aggressive sell volume" });
output("cvd_sign", none, lower, { description: "0 while the rolling CVD is negative, 1 while positive: the histogram's palette index" });
output("cvd", histogram, lower, { pane: "cvd", color_by: "cvd_sign", colors: ["theme.down", "theme.up"], width: 0.7, label: "Agg. Rolling CVD", format: "si", description: "Rolling cumulative volume delta: aggressive buys minus sells over the window" });
pane("cvd", { height_frac: 0.12, format: "si" }); // the Indicator's home pane: it carries the Indicator's name, so no title here
The words that matter:
- The static look:
color,width,opacity,line_style,glow,z; the per-bar ladderscolor_bywithcolors(orcolor_packed_by) andwidth_bywithwidths;labelandformatfor the legend and the axis tag. - A line's shape:
smooth,step,gradient, andsplitwithup_color,down_color,split_level,split_fill,split_base. - An area's fill:
fill_color,fill_opacity,fill_gradientwithgradient_mode, orfill_color_bywithfill_colors. - Columns:
widthas a share of the bar slot,base,grading,stack; a candle group:candle_style,border_colors,wick_colors,border_width. - Marks:
shape,location,char,fill,fill_opacity; a level:role: "guide"withalign,pill_style,font_size,axis_label.
Every output word is on Styling; the looks each plot kind
takes are the table on
Lines, areas, columns, dots, marks
and Candles; a band between two lines is a
range() or a fill() (Decisions to looks).
Price canvases
A price canvas is drawn on the price chart from cells the chart already
serves or from a frame the module writes. The desk's strike matrix is a
plot.matrix: one row per strike on the price axis, one column per
expiry, each cell tinted on a diverging scale around zero. Heatmaps,
footprints, TPO letters and anchored profiles are the other four. Reach
for a canvas when the picture is a grid over price: a cell per bar and
price row, or a cell per strike and expiry. The board sits on its
strikes' prices, so strikes outside the candles' own range stay clipped
until you zoom the price axis out by dragging it, as the original's
author did; no word widens the range.
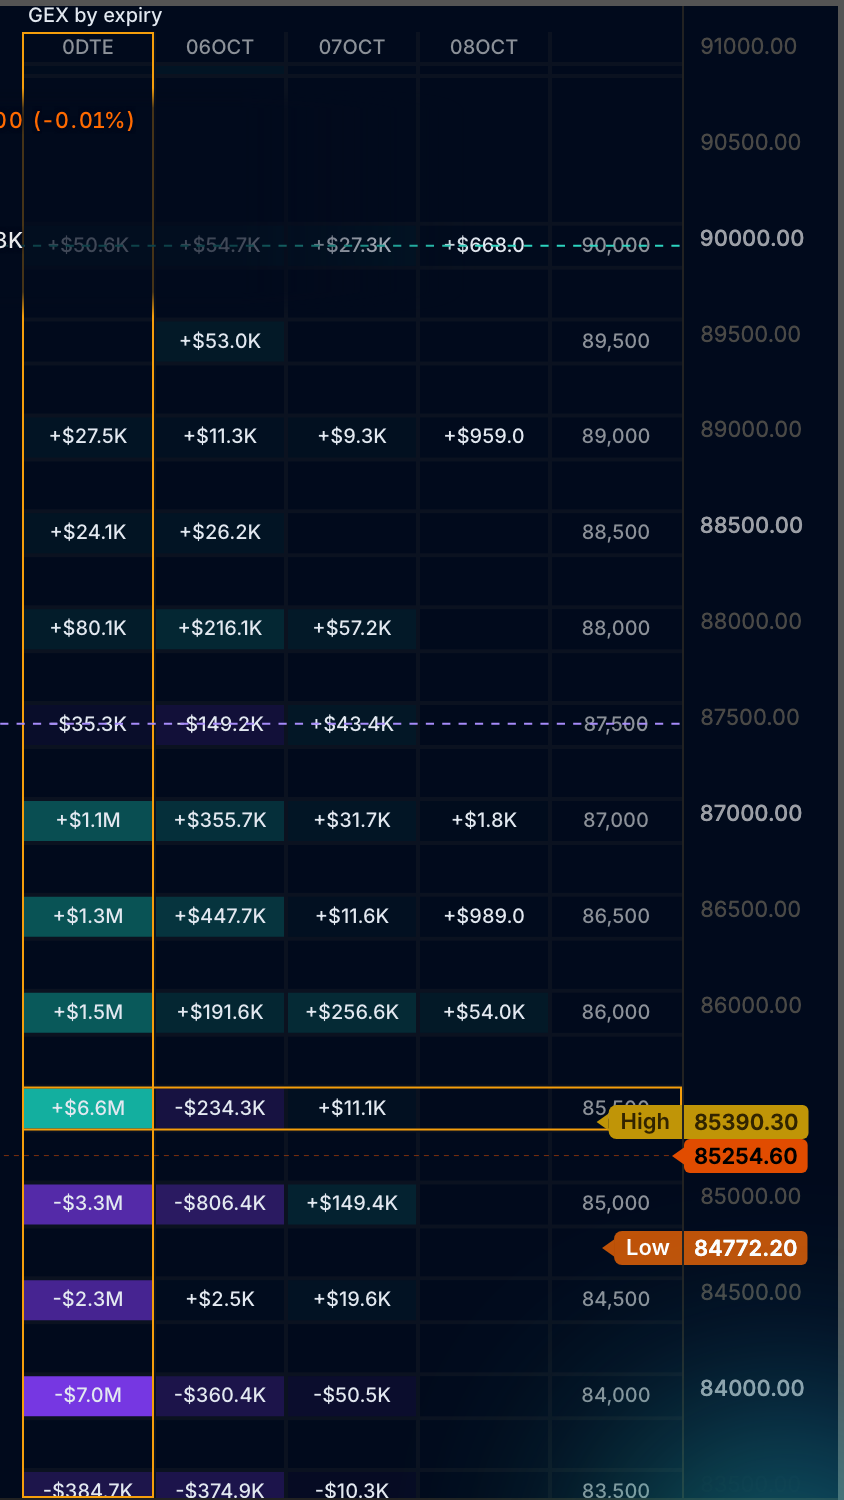
const board = frame("board", { max_bytes: 32768 }); // the matrix: one row per strike, one column per expiry
// The strike by expiry board against the price axis: a diverging palette centred on zero, puts in the chart's down
// colour and calls in its up colour, the tint by the square root of the cell's size, signed dollars in every cell, the
// at-the-money row outlined in amber.
plot.matrix({ name: "gex_board", frame: board, dock: "right", column_width: 66, row_max_px: 22, price_column: true, header: true, palette: ["theme.down", "theme.bg", "theme.up"], center: 0, scale: "sqrt", opacity: 0.95, format: "usd", signed: true, decimals: 1, font_size: 10, font_weight: "medium", align: "center", text_color: "theme.text", cell_padding: 3, grid_color: "theme.bg", grid_width: 2, grid_style: "solid", grid_lines: "all", highlight_color: "#f8c000", label: "GEX by expiry", tooltip: "{{column}}: {{value:usd}} net GEX at {{price}}" });
The frame the module sends is { prices, cells, cols, title, highlight }:
the strikes ascending, one cell row per strike with null where an
expiry lists no open interest, the column names ("0DTE", "05OCT",
...), the board's title and the at-the-money row to outline.
The words that matter:
- The scale:
palettewithmin,max,center,auto_quantileandscale("linear","sqrt","log");opacityover every fill. - The grid:
column_width,row_max_px,header,price_column,cell_padding,grid_color,grid_width,grid_style,grid_lines, theborder_*words andhighlight_color. - The type and numbers:
font_size,font_family,font_weight,align,text_color,header_text_color,formatwithdecimals,signedandunit;tooltipandlabelfor the readout. - A heatmap adds
row_height,floor,cell_gap,behind_candlesandlabels; a footprintmode, theimbalance_*words,hide_zero,cell_metric; a TPOdisplay,color_mode,letter_minutesandsingle_prints_color; an anchored profilespan,mode,nakedandextend.
Every canvas, word by word, is on Price canvases; the matrix on Strike matrices.
Panes
A pane is a scale of the indicator's own: below the chart for a number
with its own range, or over the candles on a hidden scale with
place: "price". The desk's right cell stacks three under the chart:
the tiles at 0.18 of the chart, the curve at 0.25 with a maximize button
and a stats row, and the indicator's own CVD pane at 0.12, mounted last
beside the time axis; the three take 0.55, so the candles keep the
rest, and the home pane carries the indicator's name, so it takes no
title. Reach for a pane when a small-magnitude series would hug
the axis floor on the price pane, or when two studies need scales of
their own.
const tileRows = frame("tile_rows", { max_bytes: 4096 });
const gexCurve = frame("curve_rows", { max_bytes: 16384 });
output("regime_sign", none, overlay);
output("cvd_sign", none, lower);
string("regime_text", { max_bytes: 48 });
output("cvd", histogram, lower, { pane: "cvd", color_by: "cvd_sign", colors: ["theme.down", "theme.up"], width: 0.7, label: "Agg. Rolling CVD", format: "si", description: "Rolling cumulative volume delta: aggressive buys minus sells over the window" });
pane("cvd", { height_frac: 0.12, format: "si" }); // the Indicator's home pane: it carries the Indicator's name, so no title here
render.legend("regime_entry", { text: "regime_text", color_by: "regime_sign", colors: ["theme.down", "theme.up"] });
panel.tiles({ name: "tiles", title: "Options, Deribit", x: "category", place: "below", frame: tileRows, columns: 4, accent: "auto", positive_color: "theme.up", negative_color: "theme.down", format: "usd", signed: true, hover_card: true, height_frac: 0.18 });
panel.line({ name: "gex_curve", title: "Deribit GEX (Hypothetical Spot)", x: "number", place: "below", frame: gexCurve, series: [{ name: "Net GEX", color: "theme.text", width: 2 }], chrome: "grid", smooth: true, fill_mode: "signed", fill_positive_color: "theme.up", fill_negative_color: "theme.down", fill_fade: true, x_format: "usd", x_decimals: 1, format: "usd", signed: true, decimals: 0, x_title: "Spot", y_zero: true, legend_style: "none", hover_card: true, height_frac: 0.25, maximize: true, stats_row: true });
The words that matter:
titleheads the pane's legend, and{{name}}reads a setting; the indicator's home pane carries its name instead.place: "below"stacks the pane under the chart in declaration order;place: "price"draws its outputs over the candles on a hidden scale.height_fracis the pane's share of the chart, on a pane and on a panel alike;padding: [top, bottom]sets the autoscale margins;minandmaxhold either end.scaleis"linear","log","percent"or"indexed", andinvert: trueflips the axis.format,decimals,signedandunitprint the axis ticks;pane: "<name>"on an output puts it in the pane.
Every pane word is on Panes.
Theme and the Style page
Every colour word takes a theme token beside a hex colour, and a token
follows the chart: the board's zero cell takes theme.bg, the legend
entry theme.muted and the neutral tile values theme.text, so the
desk reads on a dark and a light chart alike, re-resolved on a theme
switch with no rerun, while every hex colour stays as written on both.
A "@name" in place of a colour, a line style or a docked profile's key
hands that spot to a setting, and the dialog's Style page draws the
user's own controls for every drawn output without a declaration. Two
chart-level flags finish the set.

string("spot_text", { max_bytes: 32 });
const board = frame("board", { max_bytes: 32768 });
const tileRows = frame("tile_rows", { max_bytes: 4096 });
// The words that follow the chart's theme: theme.muted on the legend entry; theme.down and theme.up at the palette's
// ends around theme.bg (the board's zero cell takes the chart background, dark or light); theme.up and theme.down on
// the tiles' signed values, theme.text on the neutral ones in the frame.
render.legend("spot_entry", { text: "spot_text", color: "theme.muted" });
plot.matrix({ name: "gex_board", frame: board, dock: "right", column_width: 66, row_max_px: 22, price_column: true, header: true, palette: ["theme.down", "theme.bg", "theme.up"], center: 0, scale: "sqrt", opacity: 0.95, format: "usd", signed: true, decimals: 1, font_size: 10, font_weight: "medium", align: "center", text_color: "theme.text", cell_padding: 3, grid_color: "theme.bg", grid_width: 2, grid_style: "solid", grid_lines: "all", highlight_color: "#f8c000", label: "GEX by expiry", tooltip: "{{column}}: {{value:usd}} net GEX at {{price}}" });
panel.tiles({ name: "tiles", title: "Options, Deribit", x: "category", place: "below", frame: tileRows, columns: 4, accent: "auto", positive_color: "theme.up", negative_color: "theme.down", format: "usd", signed: true, hover_card: true, height_frac: 0.18 });
The badge chip in the curve's frame takes a theme word per run,
{ "text": "SHORT GAMMA - AMPLIFIED", "color": "theme.down" } or
{ "text": "LONG GAMMA - DAMPENED", "color": "theme.up" }, and the chart
picks the ink that reads on it.
The words that matter:
- The seven tokens:
theme.up,theme.down,theme.text,theme.muted,theme.bg,theme.grid,theme.accent; every colour key on this page takes one, and so does a colour string inside a frame. "@name"binds a spot to a setting: aparam.colorbehind a colour, aparam.choicebehind a line style or a docked profile's word key, aparam.number,param.intorparam.boolbehind a profile's number or switch.label,format,legendandvisibleon an output shape its row on the Style page; every HUD gets a Look row of its own.chart.contrast_guard(false)keeps the author's colours as written on a light chart;chart.stack_handles(true)stacks the indicator's corner groups under other indicators' groups.
The tokens are on Theme colours, the bindings and the rows on The Style page, and the packed form a module writes on Colors kit.
Every word
The deep pages list every word with its range and what refuses:
- Plotting and Styling: outputs, panes, ranges, fills, boxes and segments
- Drawing objects and Labels, tooltips, badges: drawings, handles and renderer marks
- Cards, frames and panels: tables, cards, panels, docked profiles, ladders, feeds and meters
- HUD and hover cards and Legend: the three surfaces that read the newest values
- Price canvases: heatmaps, footprints, TPO letters, anchored profiles and strike matrices