
Every trader eventually wants a line the built-in catalog does not have: your moving average pair, your entry rule, your version of RSI with the bands where you actually trade them. kScript is OpenMarket's scripting language for exactly that. It offers a familiar syntax for those coming from PineScript but provides far more power, including direct access to raw order-book arrays, multi-symbol data, and live computations across thousands of assets. You write a short script, press Run, and it renders on your chart like any built-in indicator. Your own scripts and public open-source scripts run right in your browser; private and source-protected scripts run in OpenMarket's cloud. Either way the chart does not care: same plots, same settings dialog, same legend. For a complete list of functions, variables, and syntax rules, visit the Official kScript Documentation.
Open the editor
You need to be signed in, and the editor is a desktop surface (there is no mobile editor).
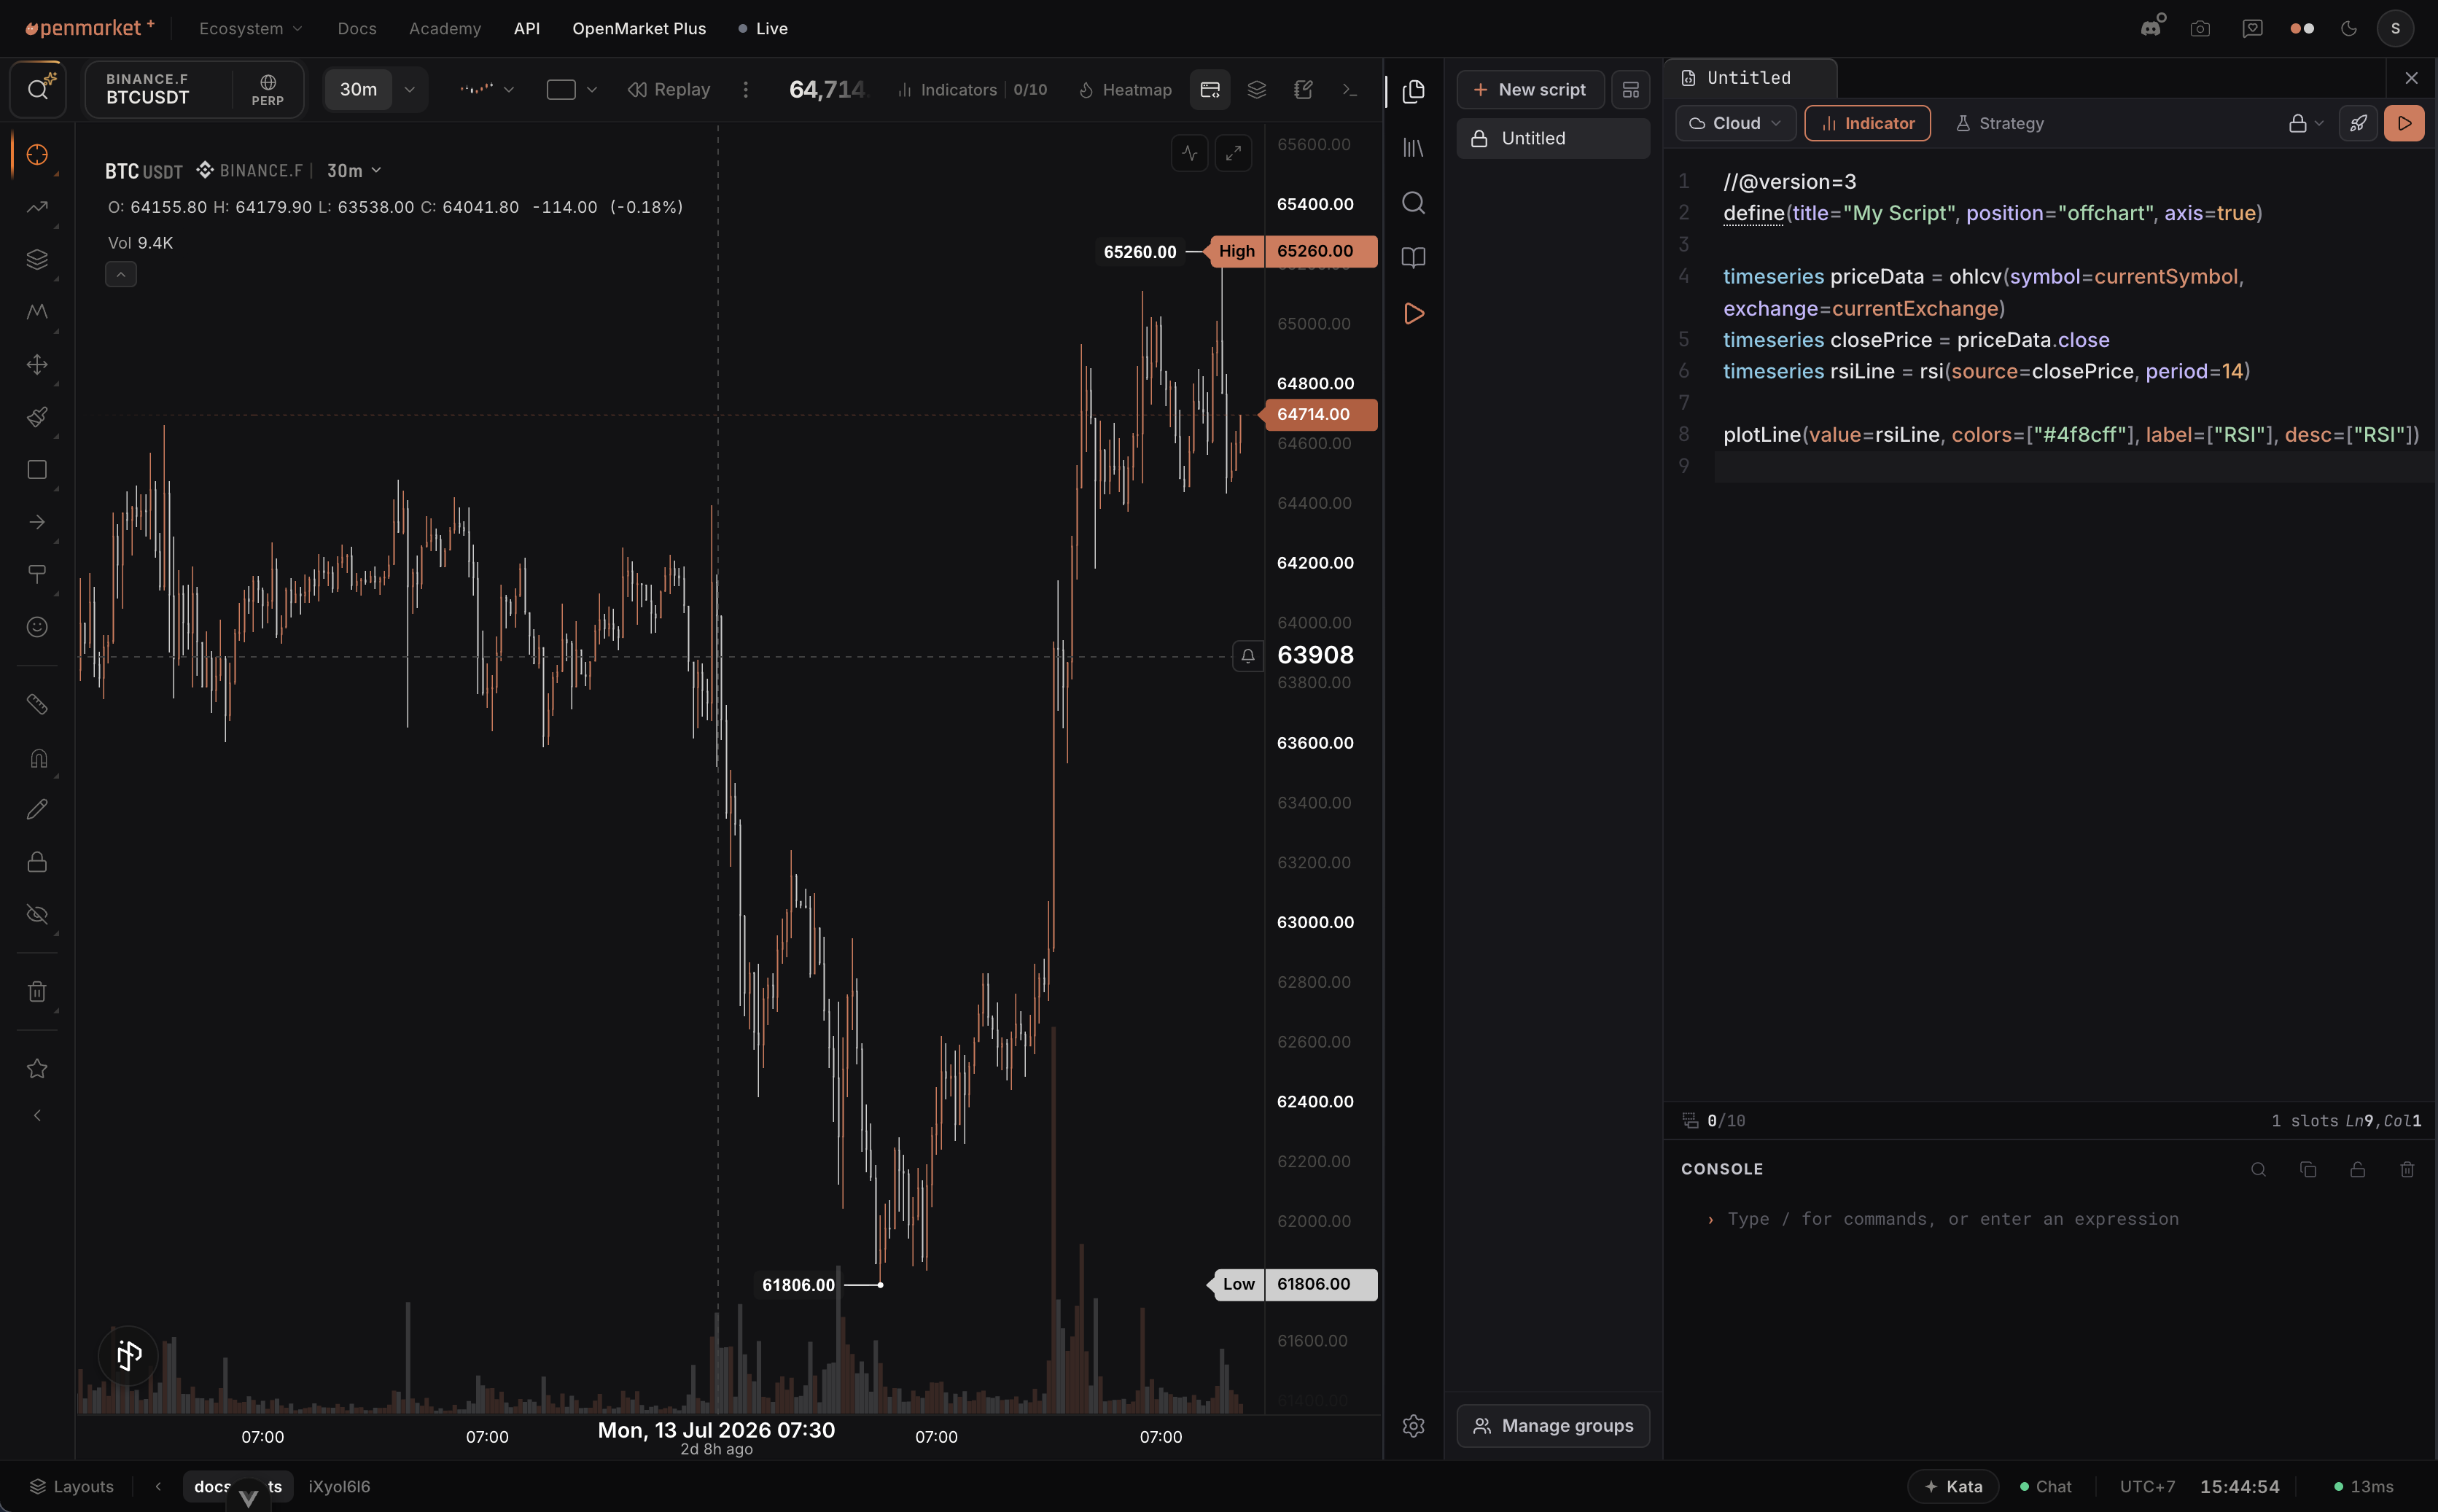
- Click the kScript button in the top bar. The editor opens as a resizable panel docked beside your chart, so you can see your code and its output at the same time.
- Prefer keyboard? Open super search with
Ctrl/Cmd+Jand type "Script Editor". - From the Indicators dialog, the Build button jumps straight into the editor. Opening or forking a community script from that dialog lands in the editor too.
Run adds the script to your chart. Running an unsaved draft previews it instantly; press Save so the chart keeps your version on refresh, and Publish when you want a version others can use.
Find your way around
The editor is laid out like a small IDE, with the chart always in view:
- Explorer (the files icon on the left rail): all your drafts and saved scripts. Create a new script, rename, duplicate, change a script's icon, or delete from here. Scripts open as tabs across the top, so you can work on several at once.
- Toolbar: the sharing mode of the script (Private, Public hidden, or Public open), an Indicator/Strategy switch, the Templates button, and where the script runs (in the cloud or locally in your browser). To the right sit Save, Publish, and Run.
- Code area: syntax highlighting, find and replace, and live checking as you type. Problem counts appear in the status row under the code; click them to open the console.
- Console (bottom): one stream with your script's problems and run output. Click an error line and the editor jumps to the offending line of code. The last line of the console is a live prompt: type
/for commands or enter an expression. A data inspector lets you verify raw source data against your plot outputs when logic needs checking. - Docs (the book icon on the left rail): opens the full kScript language reference in a new tab. This page does not teach the language; that reference does.
Start from a template
A fresh script opens on the template picker, and the Templates button in the toolbar brings it back at any time (on an edited script, picking a template opens a new tab instead of overwriting your work).
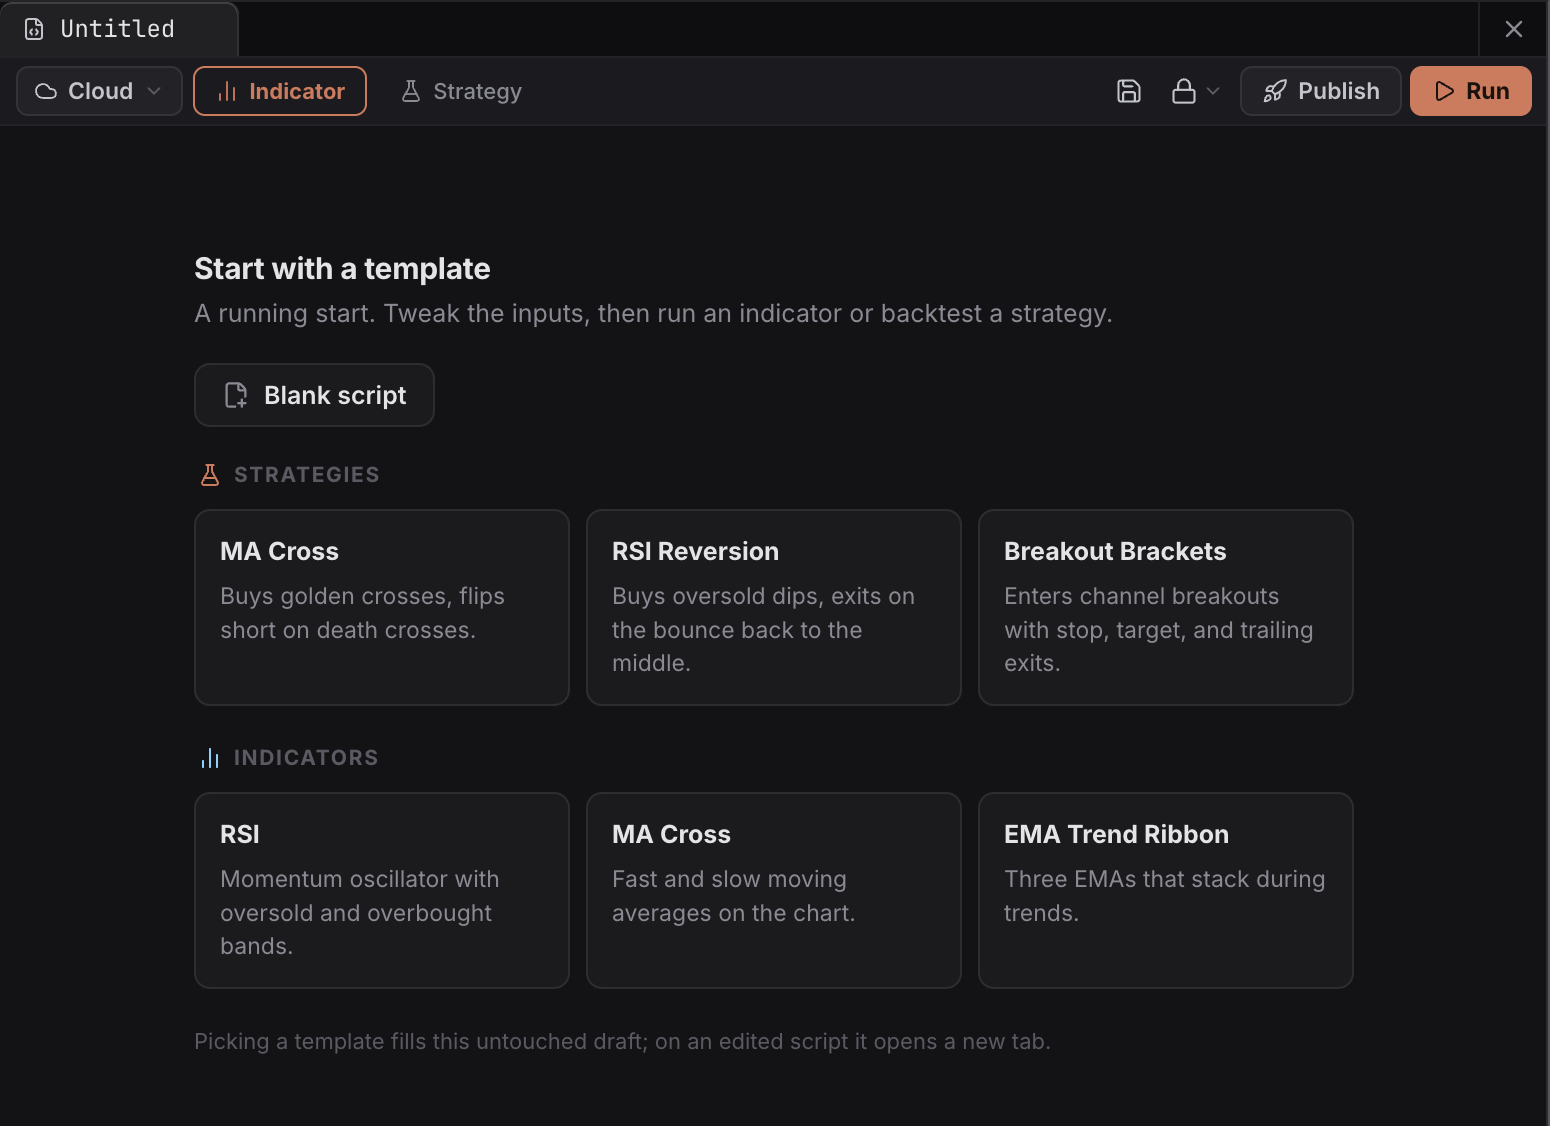
Starter templates ship with the editor, and every one is a complete working script:
- Strategies: MA Cross (buys golden crosses, flips short on death crosses), RSI Reversion (buys oversold dips, exits on the bounce back to the middle), and Breakout Brackets (enters channel breakouts with stop, target, and trailing exits).
- Indicators: RSI (momentum oscillator with oversold and overbought bands), MA Cross (fast and slow moving averages on the chart), and EMA Trend Ribbon (three EMAs that stack during trends).
Prefer an empty page? Blank script starts you from nothing. To give you a feel for the language, here is the MA Cross indicator template, verbatim and in full:
//@version=3
define(title="MA Cross", position="onchart", axis=true)

timeseries priceData = ohlcv(symbol=currentSymbol, exchange=currentExchange)
timeseries fastMa = sma(source=priceData.close, period=20)
timeseries slowMa = sma(source=priceData.close, period=50)

plotLine(value=fastMa, width=1, colors=["#22c55e"], label=["Fast MA"], desc=["Fast moving average"])
plotLine(value=slowMa, width=1, colors=["#ef4444"], label=["Slow MA"], desc=["Slow moving average"])
Strategies and the Strategy Tester
A strategy is a script that places simulated trades instead of just drawing lines, and for strategies the Run button becomes Backtest. Run one and the chart marks every entry and exit, while a dock under the chart summarizes the result (net profit, win rate, drawdown, trade count) and expands into the full Strategy Tester: an Overview tab with the equity curve, a drawdown lane, and a buy-and-hold comparison, plus Performance and Trades tabs for the detailed numbers and the trade-by-trade list. Each strategy on the chart keeps its own markers and its own eye toggle (hiding a strategy hides its plots and markers together), and with two or more strategies running you can open compare mode to see their normalized equity curves side by side.
Prepare a script for the community
When you publish, kScript gives you the tools to make a script professional and discoverable:
- Thumbnails: Upload a custom image (PNG or JPG up to 2MB) to provide a high-quality visual preview of the indicator.
- Categories: Assign your script to up to three categories—such as Trend Indicators, Orderflow Analysis, or Market Microstructure—to help users understand its purpose.
- Rich Description: Use the built-in text editor to explain the logic and use cases.
- Sharing mode: Pick Private (only you can use it, source stays protected), Public hidden (anyone can add it, source stays hidden), or Public open (anyone can view or fork it).
- kScore: A fair evaluation of each published indicator, calculated internally via a proprietary formula to measure popularity and usage.
Community scripts
You do not have to write anything to benefit from kScript. Open Indicators in the top bar and switch the filter to Community only: every script other traders have published is there, searchable and sortable, with author profiles and a verified-scripter badge. One click adds a script to your chart.
Open-source community scripts go further: open one in the editor to read exactly how it works, and Fork it to get your own editable copy, tweak a period, restyle a plot, or build something new on top. Source-protected scripts can be added and used but not forked. OpenMarket also maintains a collection of popular TradingView scripts converted to kScript; they run natively, like any other script.
Save high-value community indicators to your Favorites for instant access on any chart, and use the My Scripts view to reach your personal drafts, published tools, and forked code in one place. For a curated tour of community indicators and ready-made bundles, see the kScript Hub.
Limits
Private scripts are a Plus feature: the free plan includes none, Plus lets you keep up to 20 scripts private.