
A workspace is one complete trading setup: the symbols and intervals you watch, the chart grid, every indicator with its settings, your drawings, and the widgets docked around the chart. You will also see workspaces called layouts in the UI (the footer button is labeled Layouts): same thing. The point of having several is separation of jobs. Keep a BTC order flow desk, a macro dashboard, and an alt screener as three workspaces, and switch between finished setups instead of rebuilding one chart over and over.
There is no save button anywhere in OpenMarket. Every change you make (adding an indicator, moving a widget, switching symbols) is written to the workspace automatically about a second after you make it, and it is stored on your account, so your setup survives reloads and follows you between devices. Each workspace also has its own URL, which means you can keep two of them open in separate browser tabs. The one exception is guest mode: until you sign in, nothing persists.
Create, switch, rename, duplicate
Workspaces live bottom-left in the footer:
- Hover the Layouts button to open the quick menu: New layout creates a workspace (give it a name and you are in), Publish current workspace shares it to the community, and the Recently used list jumps to another workspace. The star next to each entry marks it as a favorite.
- Next to the button sits a row of tabs for your recently used workspaces. Click one to switch to it, and double-click the active tab to rename it in place.
- Clicking a workspace in the quick menu opens it in a new browser tab, so you can run two setups side by side.
For the full manager, click the Layouts button (or press Shift+T) and pick Layouts in the sidebar. You get search, grid or list view, favorite stars, and a menu on every workspace card with Open, Rename, Duplicate, Share, Export, and Delete. Share copies a link to the workspace; Export downloads it as a JSON file you can import back later, which makes a handy backup before big rearranging. Duplicate is the safe way to experiment: clone the setup, tear the copy apart, keep the original.
Free plans hold 10 workspaces; OpenMarket Plus raises that to 50. The full table is in plans and limits.
The multi-chart grid
One workspace can show many charts at once. Click the Layout button in the top bar and you get a 4x4 dot matrix: hover to paint the grid shape you want, click to apply it. Small shapes (two side by side, three stacked, 2x2) are the classic splits; anything larger switches into the Monitor grid, up to a full 4x4 wall of 16 charts. Every chart in the grid is a real chart with its own symbol, interval, and indicators.
The same dropdown holds the Sync toggles, which decide how much the charts move together:
- Symbol: change the symbol on one chart and all of them follow. Perfect for one market on four timeframes.
- Interval: same idea for the timeframe. Perfect for four markets on one timeframe.
- Crosshair: mirrors your crosshair across every chart at the same time, so you can line up a moment in time across markets.
In Monitor grids the first two are fixed (symbols stay separate, the interval stays synced across the wall); crosshair sync stays up to you.
Every plan runs grids up to 16 charts (4x4).
The terminal: widgets around your chart
The terminal is the docked panel that lives beside the chart. If you do not see it, the terminal button in the top bar brings it back (Show Terminal). Across its top run tabs for the Orderbook, Workspace, Alerts, Narratives, and Markets panels: the Workspace tab is the widget grid this section is about.
At the bottom of the Workspace tab sits the Add widget bar. Hover it and the widget picker opens; once you hit your widget limit the bar shows your used slots instead, and Clear all empties the grid in one click.
What each widget does:
| Widget | What it shows |
|---|---|
| Orderbook | The live book: resting bids and asks around the price, with grouping and USD or coin units. |
| OB Delta | How resting liquidity has changed: where orders were added or pulled from the book. |
| Order DOM | A depth-of-market ladder: bid and ask sizes stacked price by price around the market. |
| Volume Stats | Total traded volume over the last 24 hours, split into buy and sell. |
| Liquidity Stats | Bid and ask liquidity sitting within 2.5% of the top of the book. |
| Market Stats | Book depth and volume flow for your symbol, exchange by exchange. |
| Tape | Raw time and sales: every trade as it prints, filterable by side and minimum size, with whale prints highlighted. |
| Trade & Liquidations | A combined feed of trades and liquidations with size thresholds you set yourself. |
Your symbol lists live outside the grid: the watchlist is its own panel beside the chart, opened from the top bar or the Panels menu (Watchlist guide).
New workspaces start with Volume Stats, Liquidity Stats, and the Tape already docked. Widgets drag to rearrange and resize on a grid, and each one has a menu to duplicate it side by side or stacked, or close it. Data widgets (the orderbook family, Tape, Trade & Liquidations) can run several copies at once, so two orderbooks on two different symbols next to one chart is a normal setup. The stats widgets are one each, and the picker greys them out while they are open.
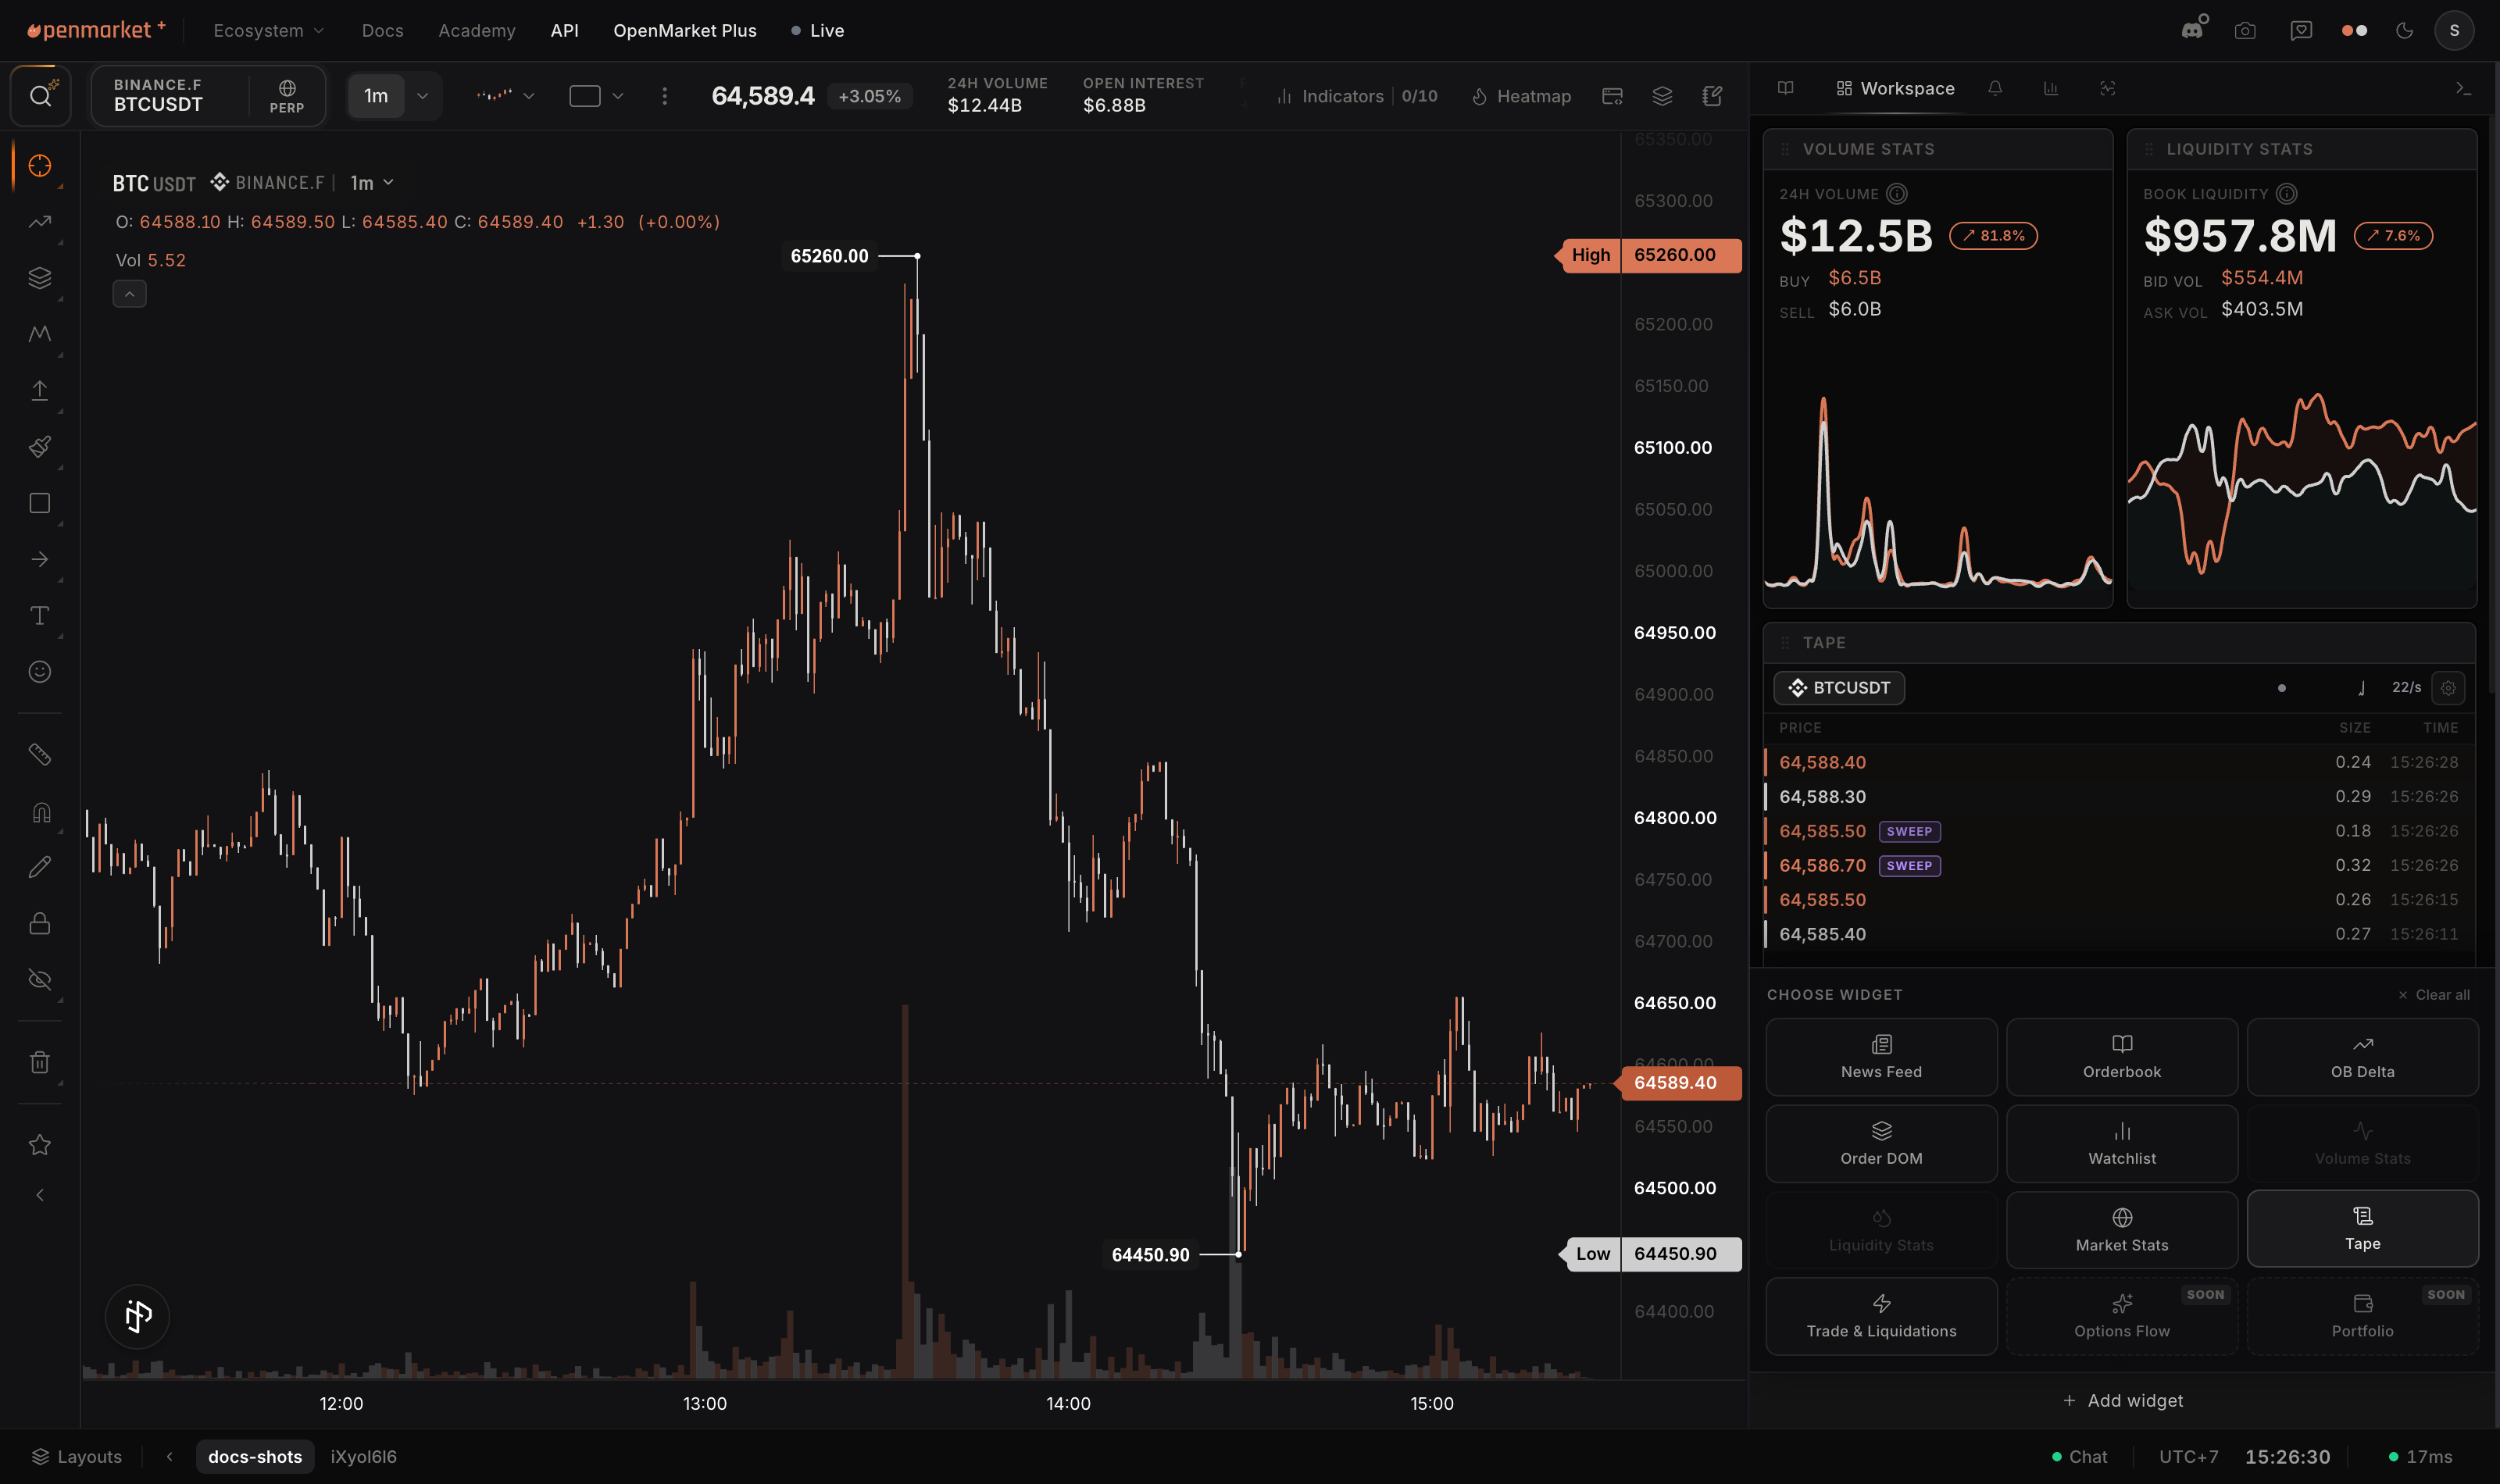
Free plans dock 3 widgets per workspace; OpenMarket Plus raises that to 10.
Community layouts
A community layout is a complete workspace another trader has published: the grid, the indicators, the settings, all of it. Browsing them is the fastest way to steal a working setup instead of assembling one from scratch, and publishing yours is how you hand a setup to someone else in one click.
Open the Layouts button in the footer (or press Shift+T). The sidebar has three views: Browse for the community catalog, Favorites for layouts and workspaces you have starred, and Layouts for your own.
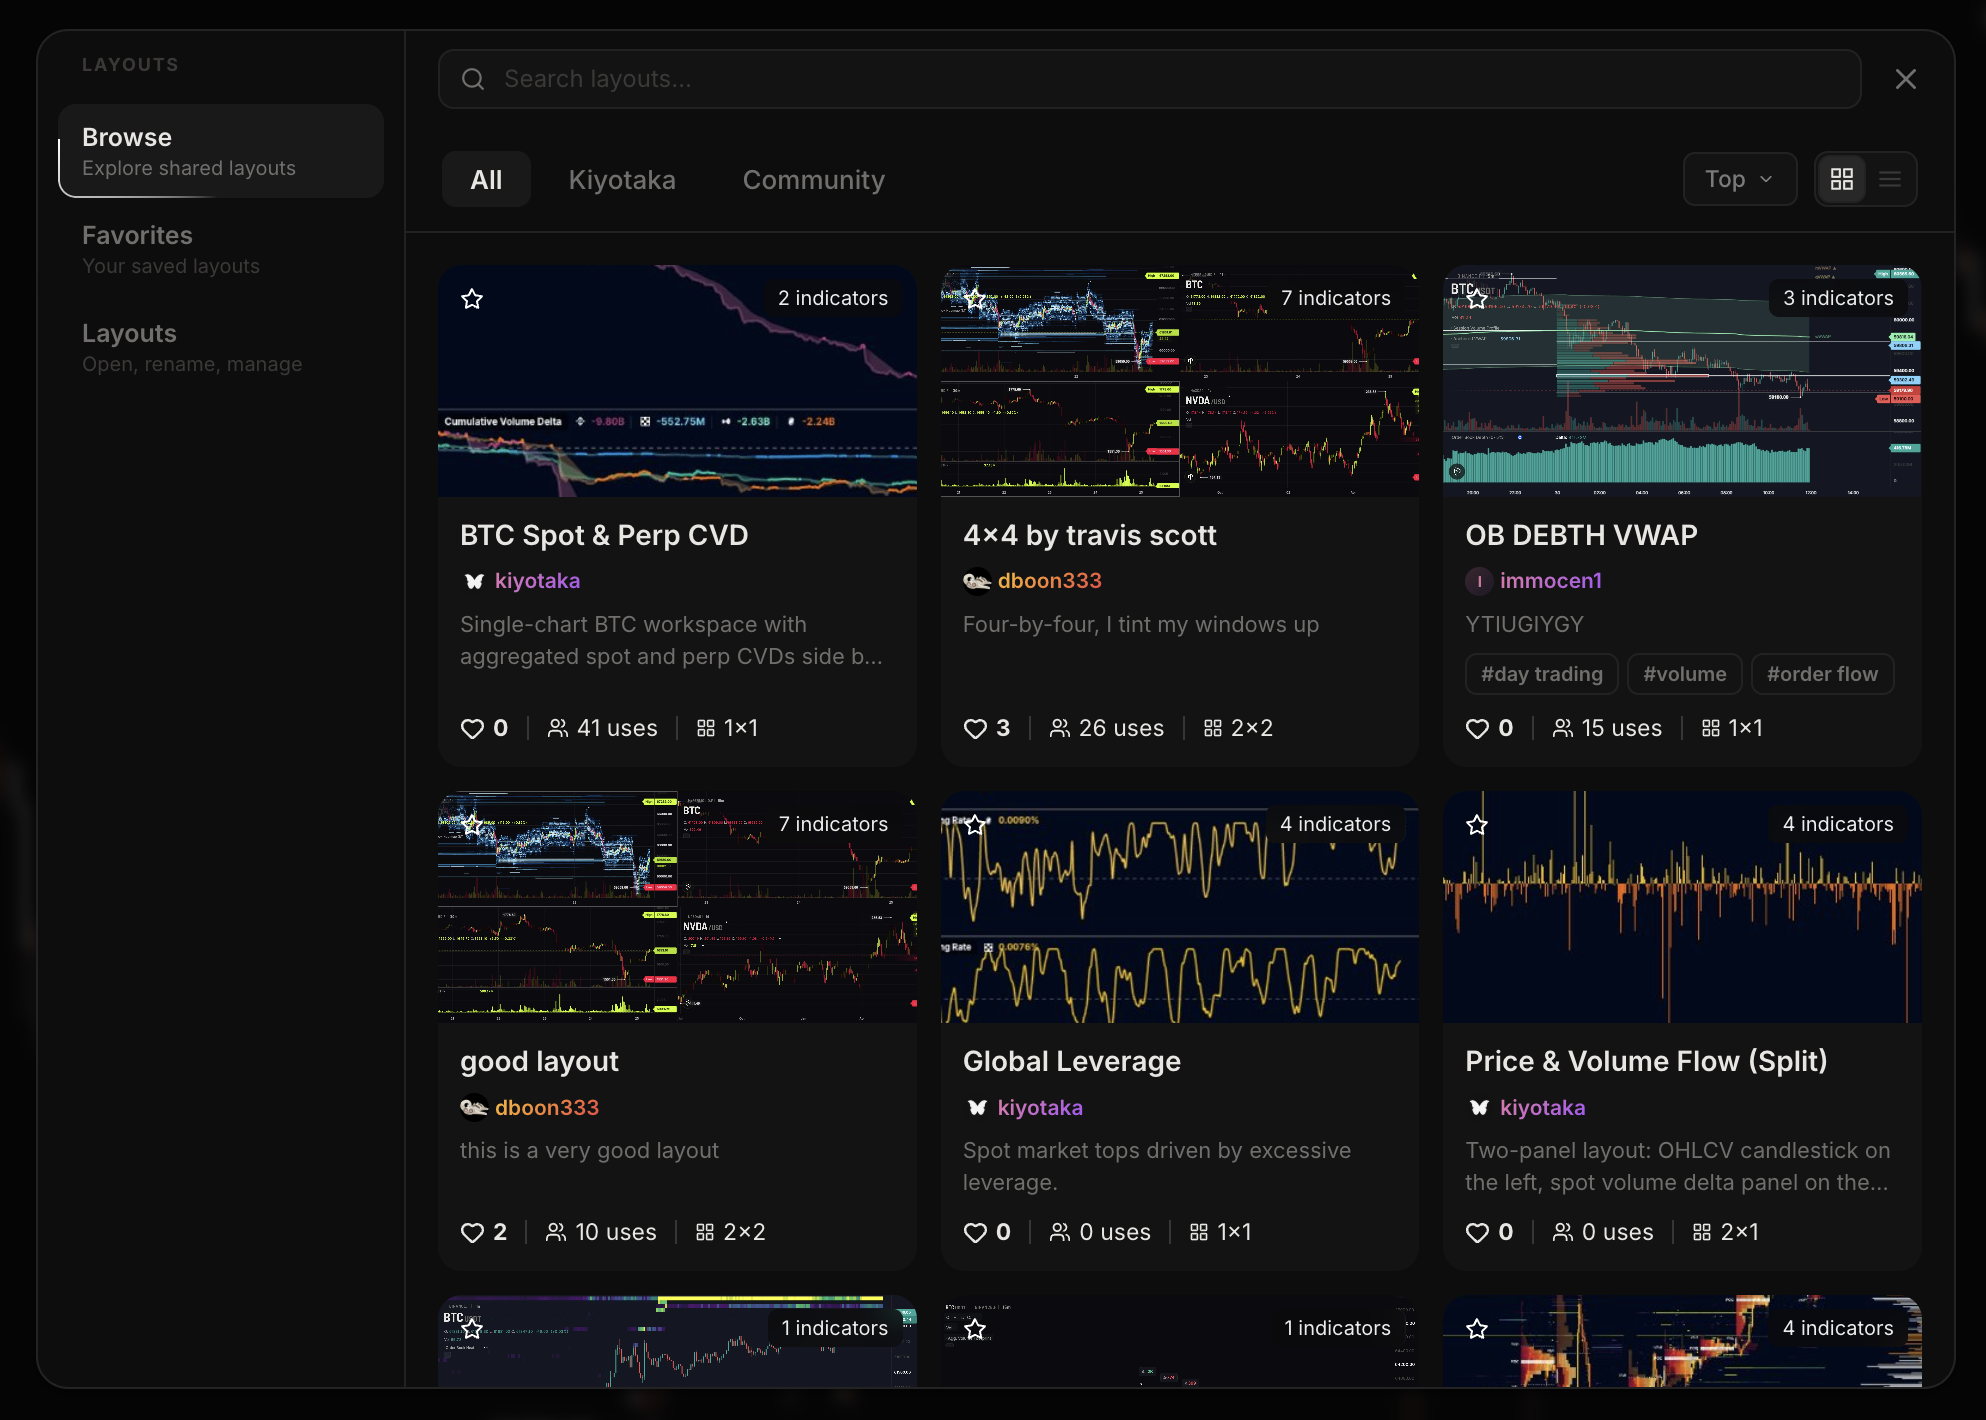
In Browse you can search, sort by Top, Newest, or Name, filter by tag, and flip between grid and list view. Every card carries a thumbnail and an Apply button; the star saves it to Favorites, and share copies a link. Click a card for the full detail view: a pane-by-pane preview of the grid, what is included (each indicator, and whether it sits on the main chart or in its own pane), the market and timeframe it was built on, usage stats, and the author.
Applying gives you three modes:
- Add to current chart: drops the layout's indicators onto your active chart, leaving your symbol and grid alone. Single-chart layouts only, and the added indicators count against your per-chart indicator slots.
- Open in new workspace: builds the layout as a fresh workspace. Non-destructive, and the right default when in doubt.
- Replace current workspace: swaps your current workspace for the layout. This permanently removes the old workspace, and the dialog warns you before it does.
Publishing your own
Hover the Layouts button and pick Publish current workspace (it is also available from the Published tab of your Layouts view). Give it a name and a description, add tags (the dialog suggests common ones), and choose visibility: Public means anyone can find and apply it in Community, Private means only you can. The thumbnail is captured from your actual workspace, and you can recapture or upload your own before publishing. Publish & copy link gives you a shareable URL in the same click.
Your published layouts live under Layouts, Published, where you can update or unpublish them (bulk unpublish works too). To update one, open it and hit Edit: OpenMarket opens the layout's source workspace so you can recapture the current chart content, then save the changes. One thing to know: a published layout stays tied to the workspace it came from, so if you delete or replace that source workspace, you can no longer recapture its chart content (the name, description, tags, and visibility stay editable).
Free plans publish up to 10 layouts; OpenMarket Plus raises that to 50.