
This page takes you from a fresh login to a chart worth staring at: your market, your timeframe, one indicator, saved so it looks the same tomorrow.
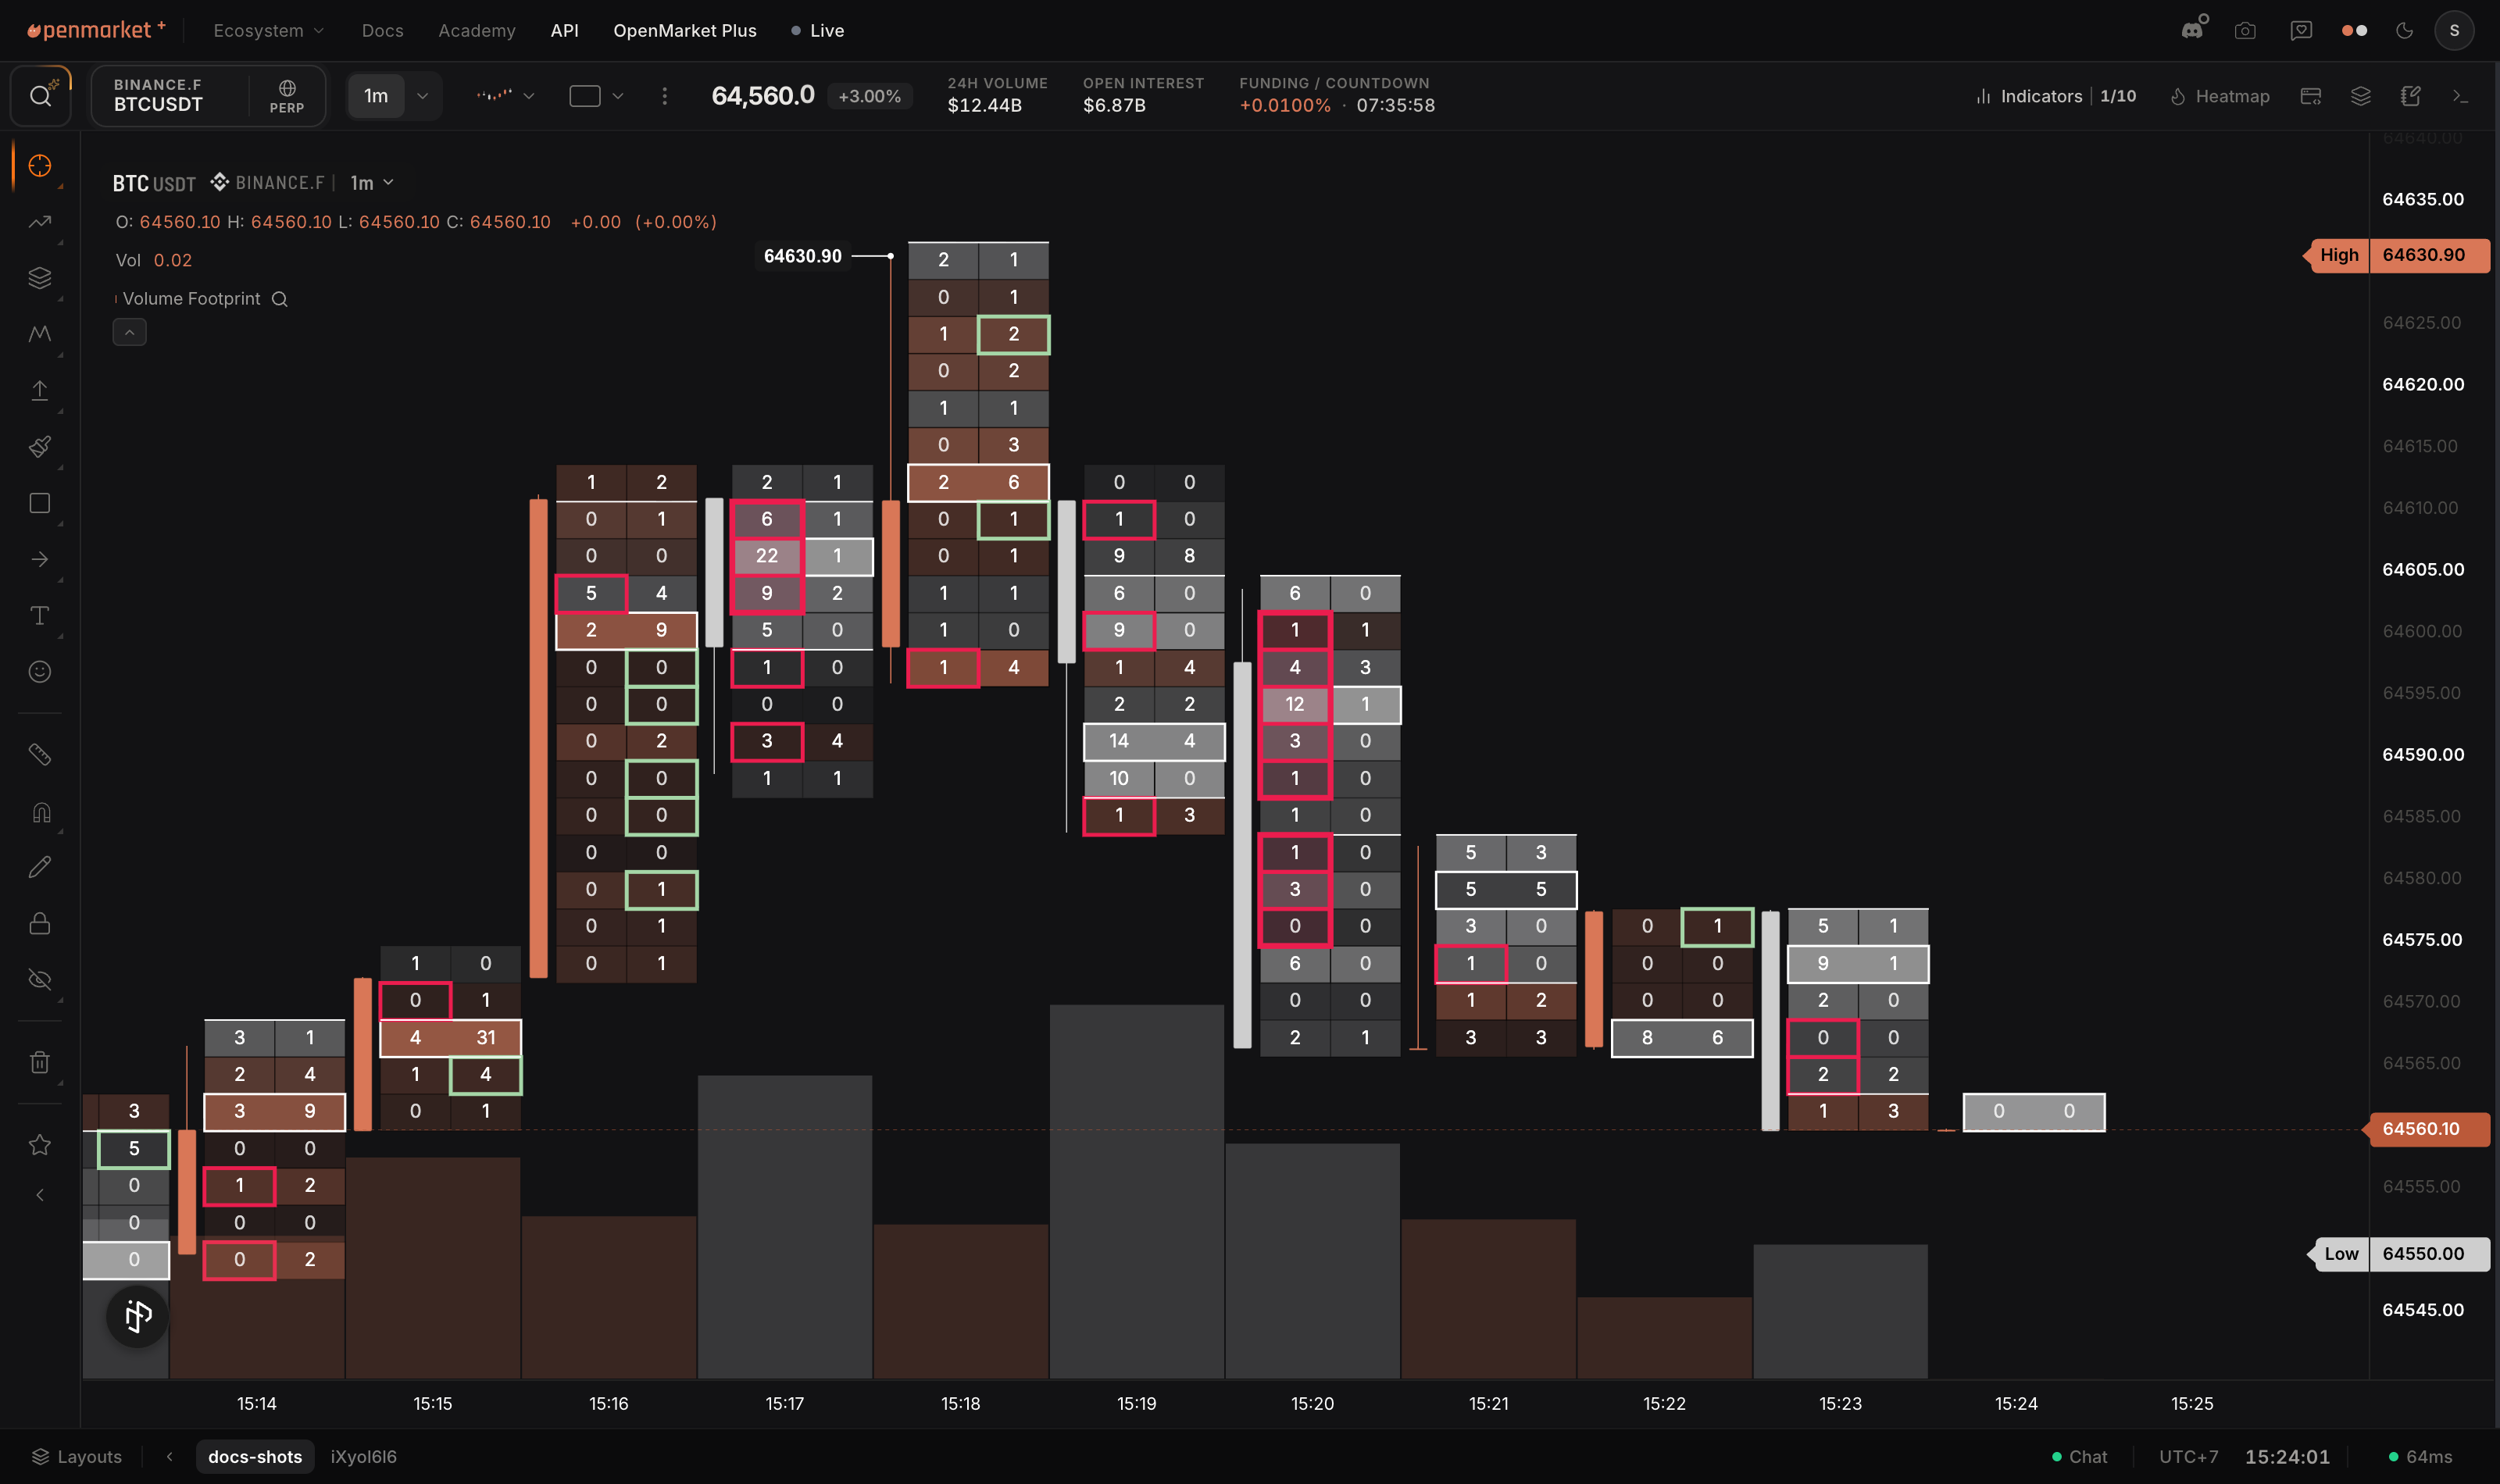
1. Pick your market
Click the symbol button in the top-left of the chart (or just start typing a ticker anywhere on the chart). Search covers spot and perpetual pairs across the major exchanges, plus Polymarket, equities, and macro series. Pick the exchange flavor you actually trade; the same coin on different venues prints different order flow.
2. Pick your timeframe
The interval chips sit next to the symbol. Click one, or press a digit key for an instant switch. Your last-used intervals stay one click away in the dropdown.
3. Add an indicator
Click Indicators in the top bar and browse: the library is organized by category (Trending, Volume & Footprints, Exchange Metrics, Technical and more), with community scripts one tab over. Click any indicator once to add it. Every indicator has a settings dialog behind the gear icon on its legend row; the docs cover the deep ones like footprint and TPO option by option.
Faster: press Ctrl/Cmd+J and type the indicator's name into super search.
4. Save your workspace
Your layout, indicators, and settings live in a workspace, and changes save automatically while you work. Use the workspace controls in the footer to name it, spin up alternatives, or keep one workspace per strategy. Multi-chart grids, widgets like the tape, and shared layouts all hang off the same workspace system.
Where to next
- Reading the interface: a labeled tour of every control you just used.
- Order flow: which tool, when?: the map of the platform's flagship tools.
- Press
Ctrl/Cmd+Jany time you cannot find something; super search finds indicators, tools, settings, and commands by name.