Strike Matrix
To find levels price may respect, a price-axis board shows strikes (option price levels) down and expiry dates across.
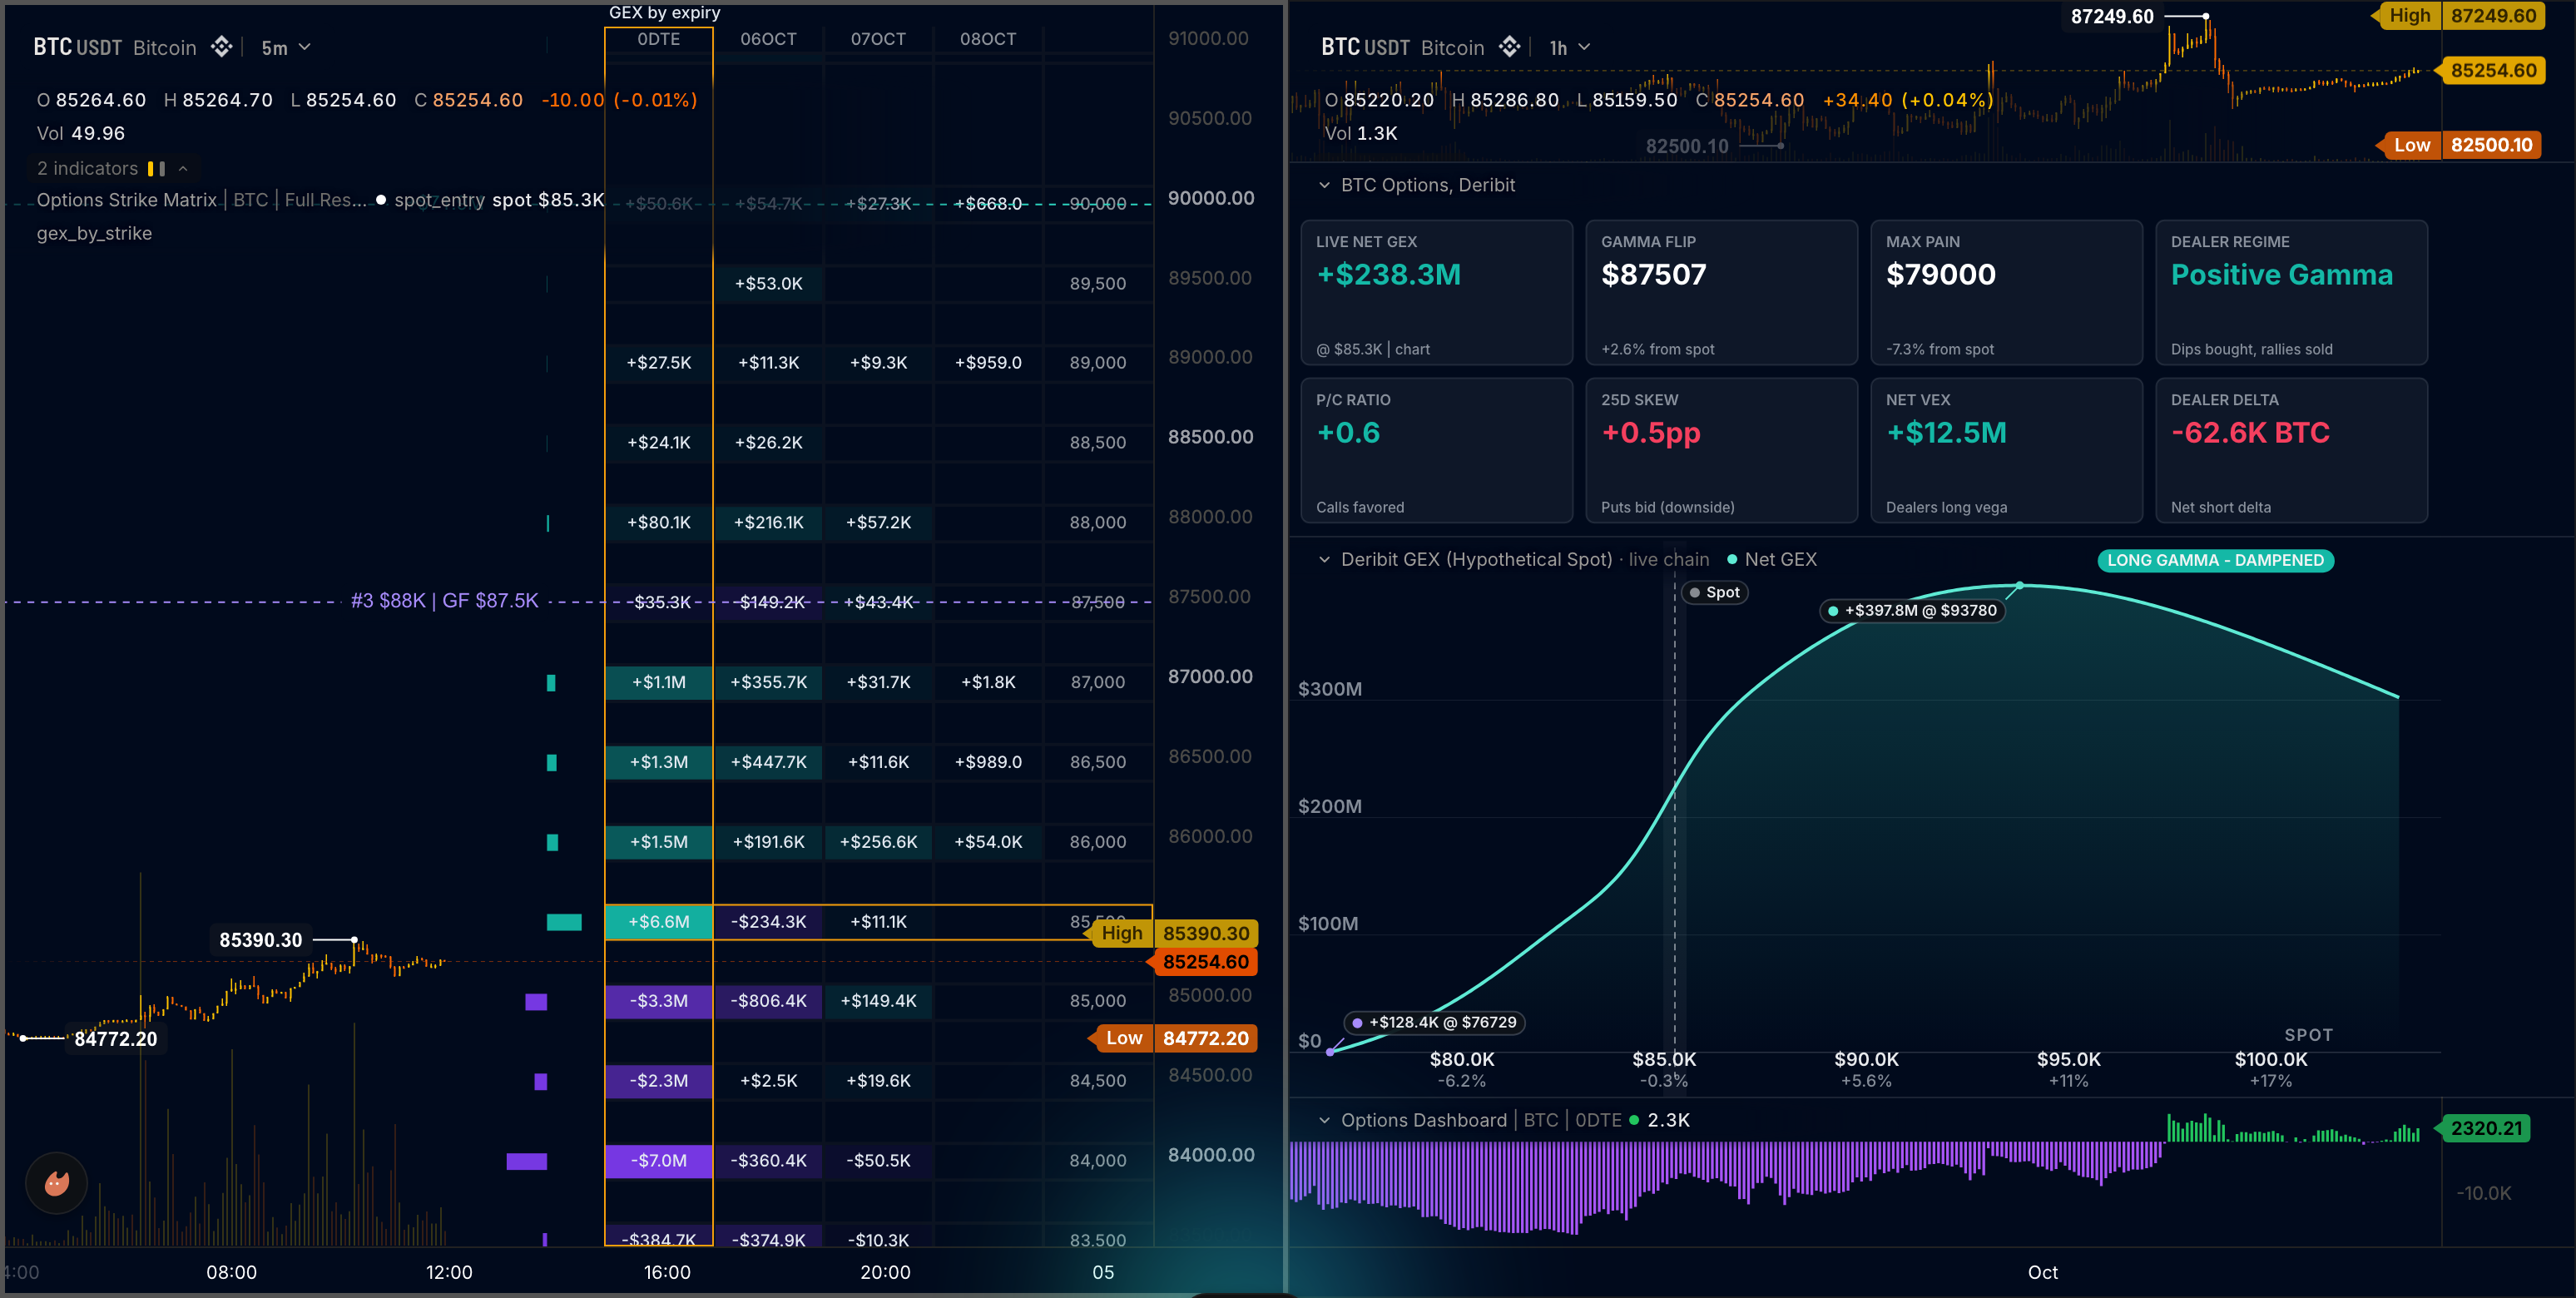
Each box shows dealer gamma, how fast dealers (the market makers who hedge options) must hedge as price moves. Up-colour boxes lean to calls (bets on a rise), down-colour boxes to puts (bets on a fall). One dashed line marks the gamma flip (Flip), where dealers switch from calming price to pushing it. Three others mark max pain (MP), where option holders collect least, and the strikes heaviest in gamma and in puts.
Under the hood: it reads options_chain.cells as one block on the live bar (Data sources). It writes two frames from the frame buffer: a plot.matrix over the board and a plot.levels over the bars. Both dock right, kept apart by an offset (Price canvases, Docked profiles). Layout net writes its one column to a plot.matrix of its own. fbExpiryLabel writes the column dates (Panel frames). GammaCurve gives the flip, and optionsAsOfMs and optionsLiveUntilMs the as-of and the expiries still trading (The market's own date). OptionsChain gives max pain and the walls (The canonical numbers). NodeBoard, expiryPresetCount and StrikeVelocity give the nodes, the columns and the velocity (The strike board). draw.line drawings are placed from the newest bar, with label handles pinned in pixels from the price axis (Drawing objects). This is also the strike-matrix template: the Strike Matrix card under On price in the editor's starter list. It compiles as written. It is the left chart of the options desk that Style anything walks through part by part, beside the Options Dashboard.
The wrun indicator
// Strike Matrix: this symbol's live options as a board on the price axis, strikes down and expiry dates across. A
// strike is an option's price level, and an expiry is the date an option ends. Each box shows dealer gamma at that
// strike and date. Dealers are the market makers who hedge what they sell. Gamma is how fast dealers must hedge as
// price moves. A box in the up colour means calls (bets on a rise) carry the strike. A box in the down colour means
// puts (bets on a fall) do. Deeper colour means a bigger number. Bars beside the board total each strike. Four dashed
// lines mark key prices. The gamma flip is where dealers switch from calming moves to feeding them. Max pain is the
// strike where option buyers collect the least at expiry. The put wall is the strike with the heaviest puts at or below
// the price. The last line marks the strike with the most positive gamma. Big strikes often act as magnets or walls for
// price. Use it to see where dealer hedging may slow a move or speed it up.
//
// Under the hood: the chart's own live option chain as a strike by expiry board docked on the price axis (one lens per
// cell, in the chart's up colour where calls carry the strike and its down colour where puts do, the tint deepening
// with size), a column of per-strike bars beside it, and four dashed level lines across the chart, each labelled just
// left of the bars: the strike inside the board's window holding the largest positive net GEX, the gamma flip over all
// expiries (the options kit's GammaCurve, the level every options card reads), max pain and the put wall inside the
// window. The Lens setting picks what the board and the bars read: net gamma exposure (the default), delta held, vega,
// vanna or charm, in dollars with dealers long the calls and short the puts (delta keeps each option's own sign), or
// the open interest by strike and expiry, calls and puts together, in whole contracts (coins to a tenth on crypto); the
// four levels always read gamma. The chain is read at its as-of (optionsAsOfMs: the live bar's close time), each expiry
// live until it stops trading (optionsLiveUntilMs: 16:15 New York on OPRA, so today's OPRA expiry keeps its column
// until then); a column is headed by its expiry's date on the market's clock (16 Oct, or 15 Jan '27 in another year),
// the front one 0DTE on its own trade date. The chain is live only: history bars cost one read and draw nothing; the
// boards, the levels and their labels are rewritten on the last bar as the chain moves.
//
// The reading layer names the board's nodes (the options kit's NodeBoard over each strike's reading summed across the
// board's columns, read against the close): the top node's cell is starred, the gate, the floor and the ceiling carry
// G, F and C, a cell reads its value or the node's percent of the top, the strikes under the significance share are
// shown, hidden, dimmed or faded, and the legend reads the net above and below spot. Expiry preset picks the columns by
// the calendar (the kit's expiryPresetCount), Palette paints the cells on a viridis, cividis, inferno or plasma ramp,
// and Centre on top moves the strike window onto the top node. Velocity reads how each cell's reading moved over a
// window (the kit's StrikeVelocity, one reading a bar for each strike and expiry, the strikes nearest the board's
// centre first), on every bar that carries the chain: a badge after the cell's text, a filter, a bold halo where the
// neighbouring windows that can be read agree, and the largest movers among the significant nodes in the legend. Layout
// net folds each board into one wider column: every strike's reading summed over the expiries the preset keeps (the
// reading its node is measured on), headed by the count it sums, its velocity keyed by the strike and the kept
// expiries, so a roll of them starts the ring over. A setting a host leaves out (a list written for an older version)
// reads its default.
param.choice("lens", ["gamma", "delta", "vega", "vanna", "charm", "oi"], "gamma", { label: "Lens", description: "What the boxes show: gamma (how fast dealers must hedge) by default, per 1% move. delta, vega, vanna and charm show other dealer risks in dollars, vega and vanna per volatility point, charm per day. oi shows open interest (contracts still held open)." });
param.number("window_pct", 7, { min: 1, max: 30, label: "Strike window, percent", description: "Which strikes (option price levels) the board shows, in percent each way from the price. Under Centre on top, it centres on the strongest strike instead." });
param.int("expiries", 4, { min: 1, max: 12, label: "Expiry columns", description: "How many expiry dates get a column when Expiry preset is count, nearest first" });
param.number("rate_pct", 4, { min: 0, max: 20, step: 0.25, label: "Rate, percent", when: "lens in 2,3,4", description: "The interest rate used to price vega, vanna and charm on US stocks and CME futures. Crypto options use 0." });
input("close", ohlcv.close); // the chart's own close: the grid, and spot for the strike window
input("chain", options_chain.cells, { max_cells: 4000, venue: "auto", description: "The chart's own option chain (venue auto: OPRA on a US stock or ETF, CME on a futures chart, else the coin's Deribit chain)" }); // [strike, expiry_ms, side, oi, gamma, delta, mark_iv, underlying, multiplier, vega] per contract
input("trade_date", time.trade_date); // the bar's trade date, the day an expiry must fall on to read 0DTE: the UTC date on crypto, the New York date on a US stock (a 1W or 1M bar's first day, so the chain's as-of moves it on)
market.zone(); // the market's own clock, written by the chart: 0 UTC (crypto), 1 New York (US stocks), 2 Chicago (CME, whose trade day opens at 17:00)
chart.interval_sec(); // the bar's length: the chain's as-of is the live bar's close time, the block naming none
// The reading layer's settings, declared after the market's clock and the bar's length (the chart fills those two), so
// every setting above keeps its slot.
param.choice("expiry_preset", ["front", "to_friday", "to_next_friday", "to_opex", "to_next_opex", "to_q_opex", "all", "count"], "count", { label: "Expiry preset", description: "front is the nearest date. to_friday and to_next_friday reach this or next Friday, to_opex and to_next_opex this or next monthly expiry (opex, a third Friday). to_q_opex reaches the next quarterly one, all shows up to 12, and count follows Expiry columns." });
section("Nodes");
param.choice("node_labels", ["off", "value", "pct"], "pct", { label: "Node labels", description: "A node is one strike's total across the board. off prints nothing, value each box's own number, and pct a node's share of the strongest. pct shows on each strike's biggest box, its number elsewhere." });
param.choice("node_pct_mode", ["off", "focus", "top"], "focus", { label: "Node %", when: "node_labels", description: "Where the shares print: off none, top the strongest strike only, focus every key strike. focus also tags the floor (F), the biggest strike below the price, and the ceiling (C) above. The gate (G) is the biggest between the price and the strongest." });
param.number("significance_pct", 15, { min: 5, max: 60, label: "Significant at, percent of the top", description: "A strike counts as key when its total reaches this share of the strongest strike's. The rest are low strikes." });
param.choice("low_nodes", ["show", "hide", "dim", "fade"], "dim", { label: "Low nodes", description: "How to draw strikes below the key share. Show them as they are, hide them, dim their text, or fade their colour to a fifth." });
param.number("hide_under_pct", 0, { min: 0, max: 50, label: "Hide strikes under, percent of the top", description: "Blanks every strike whose total is under this share of the strongest strike's. 0 hides none." });
param.choice("palette", ["classic", "viridis", "cividis", "inferno", "plasma"], "classic", { label: "Palette", description: "The box colours. Classic uses the chart's own down and up colours. The other choices are colour-blind-safe scales, dark at zero." });
param.choice("center", ["spot", "top"], "spot", { label: "Centre on", description: "Where the strike window centres: on the price (spot) or on the strongest strike (top)" });
section("Velocity");
param.choice("velocity_window", ["off", "1m", "5m", "10m", "15m", "1h", "4h", "1d"], "off", { label: "Velocity window", description: "How far back each box is compared, shown as a change badge after its text. Gamma, delta, vega and oi get badges, but vanna and charm do not. A window shorter than one bar, or longer than the data so far, shows none." });
param.choice("velocity_filter", ["all", "increasing", "decreasing"], "all", { label: "Velocity filter", description: "Keeps every box, or only the boxes whose number rose or fell over the window" });
param.bool("halo", false, { label: "Halo", description: "Bolds a box's text when its move points the same way over at least two of three windows. Those are the Velocity window and the next shorter and longer ones." });
param.int("movers", 0, { min: 0, max: 10, label: "Movers", description: "Lists this many key strikes with the biggest percent move over the window in the legend. 0 lists none." });
// The layout follows the reading layer's settings, so each of those keeps its slot too.
section("Layout");
param.choice("layout", ["matrix", "net"], "matrix", { label: "Layout", description: "Matrix shows one column per expiry date. Net shows one column, each strike summed over the chosen dates." });
output("spot", none, overlay, { description: "The chart's last close, the price the board and the lines centre on" });
output("net_gex", none, overlay, { description: "Dealers' net gamma exposure over the board, in USD per 1% price move. Newest bar only." });
output("net_lens", none, overlay, { description: "The Lens total over the board, in dollars, or in contracts on the oi choice. Newest bar only." });
output("t_prev", none, overlay, { description: "The previous bar's open time in epoch seconds, where the level lines start" });
output("t_last", none, overlay, { description: "This bar's open time in epoch seconds, the level lines' second point" });
output("wall_price", none, overlay, { description: "The strike on the board with the largest positive net gamma exposure. Newest bar only." });
output("flip_price", none, overlay, { description: "The gamma flip over all expiry dates, where dealers switch from calming moves to feeding them. Empty when none lies within 50% of the price. Newest bar only." });
output("pain_price", none, overlay, { description: "Max pain: the strike where option holders collect the least at expiry, over all of this symbol's options. Newest bar only." });
output("put_wall_price", none, overlay, { description: "The put wall: the strike with the heaviest puts at or below the price on the board. Newest bar only." });
string("spot_text", { max_bytes: 32 }); // the legend entry: "live spot $84.6K"
string("wall_text", { max_bytes: 32 }); // the level labels, one slot each, written on the live bar
string("flip_text", { max_bytes: 48 }); // "#1 $86K | Flip · all expiries $85.7K"
string("pain_text", { max_bytes: 32 });
string("put_wall_text", { max_bytes: 32 });
string("nodes_text", { max_bytes: 64 }); // the Above/Below chip: "Above +$84.3M | Below -$12.1M"
string("movers_text", { max_bytes: 192 }); // "Movers 103 +25%, 110 -12%"
string("board_text", { max_bytes: 48 }); // the columns the board shows: "4 expiries", "3 expiries, to Friday"
legend({ title: "±{{window_pct}}%" }); // the words after the name in the legend: the strike window, read from the settings by name; the columns ride the first entry, which counts them on the live bar
render.legend("board_entry", { text: "board_text", color: "theme.muted" });
render.legend("spot_entry", { text: "spot_text", color: "theme.muted" });
render.legend("nodes_entry", { text: "nodes_text", color: "theme.muted" });
render.legend("movers_entry", { text: "movers_text", color: "theme.muted" });
const board = frame("board", { max_bytes: 98304 }); // the matrix: one row per strike, one column per expiry, a dollar lens; cells carry their node text and style
const gexRows = frame("gex_rows", { max_bytes: 16384 }); // the bars: the dollar lens per strike, the board's row sums
const oiBoard = frame("oi_board", { max_bytes: 98304 }); // the same two on the open interest lens; only the pair the lens picks is written
const oiRows = frame("oi_rows", { max_bytes: 16384 });
const netBoard = frame("net_board", { max_bytes: 98304 }); // Layout net's board: one column, each strike's reading summed over the board's expiries, on a dollar lens
const oiNetBoard = frame("oi_net_board", { max_bytes: 98304 }); // and on the open interest lens; a layout writes its own boards only, the bars the same under both
// The strike by expiry board against the price axis: a diverging palette centred on zero, puts in the chart's down
// colour and calls in its up colour, the tint by the square root of the cell's size, signed dollars in every cell, the
// at-the-money row outlined in the text ink. The open interest lens has a board of its own: one ramp, counts unsigned,
// printed as written ("auto": the whole contracts the frame carries read 995, never 995.0). A cell carrying its own
// text prints that instead, and one carrying a colour (a ramp's) is filled with it.
plot.matrix({ name: "gex_board", frame: board, dock: "right", column_width: 66, row_max_px: 22, price_column: true, header: true, palette: ["theme.down", "theme.bg", "theme.up"], center: 0, scale: "sqrt", opacity: 0.95, format: "usd", signed: true, decimals: 1, font_size: 10, font_weight: "medium", align: "center", text_color: "theme.text", cell_padding: 3, grid_color: "theme.bg", grid_width: 2, grid_style: "solid", grid_lines: "all", highlight_color: "theme.text", label: "Exposure by expiry", tooltip: "{{column}}: {{value:usd}} at {{price}}" });
plot.matrix({ name: "oi_matrix", frame: oiBoard, dock: "right", column_width: 66, row_max_px: 22, price_column: true, header: true, palette: ["theme.bg", "theme.up"], scale: "sqrt", opacity: 0.95, format: "auto", font_size: 10, font_weight: "medium", align: "center", text_color: "theme.text", cell_padding: 3, grid_color: "theme.bg", grid_width: 2, grid_style: "solid", grid_lines: "all", highlight_color: "theme.text", label: "Open interest by expiry", tooltip: "{{column}}: {{value}} open at {{price}}" });
// Layout net's two boards: the same cells in one column, 96 px wide so a summed reading's text fits whole, headed by
// the count of expiries it sums.
plot.matrix({ name: "gex_net", frame: netBoard, dock: "right", column_width: 96, row_max_px: 22, price_column: true, header: true, palette: ["theme.down", "theme.bg", "theme.up"], center: 0, scale: "sqrt", opacity: 0.95, format: "usd", signed: true, decimals: 1, font_size: 10, font_weight: "medium", align: "center", text_color: "theme.text", cell_padding: 3, grid_color: "theme.bg", grid_width: 2, grid_style: "solid", grid_lines: "all", highlight_color: "theme.text", label: "Net exposure by strike", tooltip: "{{column}}: {{value:usd}} at {{price}}" });
plot.matrix({ name: "oi_net", frame: oiNetBoard, dock: "right", column_width: 96, row_max_px: 22, price_column: true, header: true, palette: ["theme.bg", "theme.up"], scale: "sqrt", opacity: 0.95, format: "auto", font_size: 10, font_weight: "medium", align: "center", text_color: "theme.text", cell_padding: 3, grid_color: "theme.bg", grid_width: 2, grid_style: "solid", grid_lines: "all", highlight_color: "theme.text", label: "Net open interest by strike", tooltip: "{{column}}: {{value}} open at {{price}}" });
// The per-strike net GEX bars beside the board: zero mid-dock, positives one way and negatives the other, each row
// in its own colour from the frame, a hover card per row, pushed inward past the board (both dock right), 100 px wide.
// The push is a pixel offset for now: in the sheet, beside names another level only; once it can name a matrix (the
// chart docks a level beside one), beside naming the board replaces the offset and tracks the board's own width.
// Layout net's board (one 96 px column) is narrower, so there the bars keep the same offset a little apart from it.
plot.levels({ name: "gex_by_strike", frame: gexRows, dock: "right", width_px: 100, baseline: "center", labels: false, opacity: 0.95, thickness_px: 10, format: "usd", signed: true, hover: true, offset: [340, 0] }); // offset: the board's width (4 columns of 66 px plus the price column), so the bars sit left of it instead of under it
plot.levels({ name: "oi_by_strike", frame: oiRows, dock: "right", width_px: 100, baseline: "edge", labels: false, opacity: 0.95, thickness_px: 10, format: "auto", hover: true, offset: [340, 0] }); // the open interest lens's bars, all one way, whole contracts as written
// Four dashed levels across the whole pane, placed from the newest bar: the largest positive GEX strike in the chart's
// up colour, the put wall in its down colour, the gamma flip in the text ink and max pain in the muted ink. Their
// labels, plain text in the muted ink, are label handles placed in pixels from the price axis (x) at the level's price
// (y), their right edge just left of the bars, so a label never covers a cell of the board or runs into the axis.
draw.line("wall_line", { x1: "t_prev", y1: "wall_price", x2: "t_last", y2: "wall_price", color: "theme.up", width: 1, line_style: "dashed", extend: "both" });
draw.line("flip_line", { x1: "t_prev", y1: "flip_price", x2: "t_last", y2: "flip_price", color: "theme.text", width: 1, line_style: "dashed", extend: "both" });
draw.line("pain_line", { x1: "t_prev", y1: "pain_price", x2: "t_last", y2: "pain_price", color: "theme.muted", width: 1, line_style: "dashed", extend: "both" });
draw.line("put_wall_line", { x1: "t_prev", y1: "put_wall_price", x2: "t_last", y2: "put_wall_price", color: "theme.down", width: 1, line_style: "dashed", extend: "both" });
handles.label({ anchor: "right", align: "right", style: "plain", font_weight: "medium" });

const MAX_ROWS = 128; // strikes on the board (the frame's cap)
const MAX_COLS = 12; // expiries on the board (the setting's cap)
const MAX_CELLS = 1536; // a board's cells at most: 128 rows of 12 columns
const TUPLE = 10; // f64s per contract: strike, expiry_ms, side, oi, gamma, delta, mark_iv, underlying, multiplier, vega
const MAX_EXPIRIES = 64; // distinct live expiries the chain may list
const MIN_T_MS = 900000.0; // 15 minutes: a contract nearer its expiry's end prices no time left, as the chart's greeks do
const GAMMA = 0; // the lenses, in the setting's order
const DELTA = 1;
const VEGA = 2;
const VANNA = 3;
const CHARM = 4;
const OPEN_INTEREST = 5;
const LENS_TITLES: String[] = ["GEX by expiry", "DEX by expiry", "Vega by expiry", "Vanna by expiry", "Charm by expiry", "OI by expiry"];
const NET_TITLES: String[] = ["Net GEX", "Net DEX", "Net vega", "Net vanna", "Net charm", "Net OI"]; // Layout net's, by lens
const NET_HEADERS: String[] = ["Net · 0 exp", "Net · 1 exp", "Net · 2 exp", "Net · 3 exp", "Net · 4 exp", "Net · 5 exp", "Net · 6 exp", "Net · 7 exp", "Net · 8 exp", "Net · 9 exp", "Net · 10 exp", "Net · 11 exp", "Net · 12 exp"]; // Layout net's header, by the expiries its column sums (the 12 columns at most)
const LABELS_OFF = 0; // Node labels, in the setting's order
const LABELS_PCT = 2;
const PCT_FOCUS = 1; // Node %, in the setting's order (0 off)
const PCT_TOP = 2;
const LOW_HIDE = 1; // Low nodes, in the setting's order (0 show)
const LOW_DIM = 2;
const LOW_FADE = 3;
const LAYOUT_NET = 1; // Layout, in the setting's order (0 matrix)
const FILTER_UP = 1; // Velocity filter, in the setting's order (0 all)
const FILTER_DOWN = 2;
const FADE = 0.2; // a faded low node's fill: a fifth of its reading
const TEXT_MAX = 16; // characters a cell's text holds
const PREFIX_NONE = 0; // the mark a node's cell starts with
const PREFIX_TOP = 1; // the star
const PREFIX_GATE = 2; // G, F and C, each with a space after it
const PREFIX_FLOOR = 3;
const PREFIX_CEILING = 4;
let netSetKey = 0.0; // Layout net's velocity key in an expiry's place: the kept expiries summed, each weighted by its rank, so it moves whenever the kept set does (a roll, a shrink, a listing) and the strike's ring starts over
const CELL_BYTES = 94208.0; // a board frame's 96 KiB, less its prices, columns, title and highlight: the cells' share
const VEL_READINGS = 81920; // readings the velocity rings hold in all: 1.25 MiB at 16 bytes a reading, inside the module's 4 MiB beside the chain's tables
// The ramps, dark theme stops from low to high (contract E), one run per palette after classic, which has none: a
// signed board reads them on |value| (the mirrored ramp, its dark end at zero), the open interest board on the count.
const RAMPS: StaticArray<i32> = [0x440154, 0x3b528b, 0x21918c, 0x5ec962, 0xfde725, 0x00224e, 0x35456c, 0x666970, 0x948e77, 0xc8b866, 0xfee838, 0x000004, 0x420a68, 0x932667, 0xdd513a, 0xfca50a, 0xfcffa4, 0x0d0887, 0x6a00a8, 0xb12a90, 0xe16462, 0xfca636, 0xf0f921];
const RAMP_FIRST: StaticArray<i32> = [0, 0, 5, 11, 17]; // each palette's first stop in RAMPS, in the setting's order
const RAMP_STOPS: StaticArray<i32> = [0, 5, 6, 6, 6]; // and its stop count
const strikePrice = new StaticArray<f64>(MAX_ROWS); // the strike table, sorted ascending, one row per strike inside the window
const cellValue = new StaticArray<f64>(MAX_ROWS * MAX_COLS); // the lens per row and column
const cellSeen = new StaticArray<i32>(MAX_ROWS * MAX_COLS); // 1 where a contract with a reading for the lens landed in the cell
const cellKey = new StaticArray<i32>(MAX_ROWS * MAX_COLS); // each cell's velocity key on the bar last measured, -1 for none
const rowCall = new StaticArray<f64>(MAX_ROWS); // the row's calls on the lens across the board's columns (the hover card), signed as they count
const rowPut = new StaticArray<f64>(MAX_ROWS); // the row's puts on the lens, signed as they count (negative dollars of gamma, positive open interest)
const rowGex = new StaticArray<f64>(MAX_ROWS); // the row's net GEX whatever the lens: the net_gex output sums the rows the board keeps
const rowOrder = new StaticArray<i32>(MAX_ROWS); // the rows nearest the board's centre first: the order cells take velocity keys in
const rowSum = new StaticArray<f64>(MAX_ROWS); // each strike's node reading: the lens summed across the board's columns
const rowMove = new StaticArray<f64>(MAX_ROWS); // each significant strike's move over the velocity window, percent (the movers)
const rowTaken = new StaticArray<i32>(MAX_ROWS); // the movers already listed
const greeks = new Greeks(); // prices vega, vanna and charm per contract; allocated once
const expiryMs = new StaticArray<f64>(MAX_EXPIRIES); // the live expiries, sorted ascending
const tags: LabelHandle[] = [draw.label(0), draw.label(1), draw.label(2), draw.label(3)]; // the wall, the flip, max pain, the put wall; handle objects allocate once
let chain = new OptionsChain(1); // the whole chain measured by strike: max pain and the strikes the levels rank on
let windowChain = new OptionsChain(1); // the strikes inside the board's window: the two walls, as Gamma Map reads them
let curve = new GammaCurve(1); // every live expiry's gamma curve: the flip; built in onStart()
let nodes = new NodeBoard(1); // the board's nodes over each strike's reading; built in onStart()
let velocity = new StrikeVelocity(1, 2); // each cell's readings, a ring per strike and expiry; sized in onStart()
let keyCap = 0; // the rings: one key a cell, handed to the cells nearest the board's centre
let mapExpiry = new StaticArray<f64>(1); // the pairs holding a key, sorted by expiry then strike
let mapStrike = new StaticArray<f64>(1);
let mapKey = new StaticArray<i32>(1);
let mapCount = 0;
let keyStrike = new StaticArray<f64>(1); // by key: the pair holding it, the bar it last read and the bar the pair took it on
let keyExpiry = new StaticArray<f64>(1);
let keySeen = new StaticArray<f64>(1);
let keyBorn = new StaticArray<f64>(1);
let freeKeys = new StaticArray<i32>(1); // the keys no pair holds
let freeCount = 0;
let keysLeft = true; // false once a cell on this bar found every key read by a nearer one
let velNowMs: f64 = NaN; // the bar the rings last read
let lens = GAMMA; // settings, read in onStart()
let windowPct = 0.07;
let columns = 4;
let rate = 0.04;
let preset = EXPIRY_PRESET_COUNT;
let labels = LABELS_PCT;
let pctMode = PCT_FOCUS;
let significancePct = 15.0;
let lowNodes = LOW_DIM;
let hideUnderPct = 0.0;
let palette = 0; // 0 classic, else the ramp's index in RAMP_FIRST
let centerOnTop = false;
let velOn = false; // a velocity window on a lens with velocity (vanna and charm have none)
let velMin = 0; // the window, minutes, and its two neighbours among the kit's windows (0 for none)
let velBelow = 0;
let velAbove = 0;
let velFilter = 0;
let haloOn = false;
let moverCount = 0;
let net = false; // Layout net: one column a board, each strike's reading summed over the preset's expiries
let cellBytes = 25.0; // the most bytes one cell takes in the frame at these settings
let intervalMs = 0.0; // the bar's length in milliseconds, read in onStart(); 0 where the host writes none
let close: f64 = NaN; // this bar
let t: f64 = NaN;
let prevT: f64 = NaN;
let nowMs: f64 = 0.0; // the chain's as-of, read on every bar that carries the chain
let today = 0; // today, days since 1970-01-01: the live bar's trade date, or the as-of's date on a bar longer than a day
let marketZone = 0; // the market's clock, read in onStart()
let oiDecimals = 0; // open interest in the frames: whole contracts on OPRA and CME, coins to a tenth on crypto
let rowCount = 0; // strikes in the table
let rowCap = MAX_ROWS; // strikes the table keeps on this board: fewer when its cells would outgrow the frame
let boardCentre: f64 = NaN; // the strike window's centre: the close, or the top node's strike
let expiryCount = 0; // live expiries seen
let shownCols = 0; // the board's columns: the leading live expiries the preset keeps
let boardCols = 0; // the columns the board draws: shownCols, or one under Layout net
let netGex: f64 = NaN; // the board's net GEX, measured on the live bar
let netLens: f64 = NaN; // the board's net on the lens
let wallPrice: f64 = NaN; // the levels, measured on the live bar
let wallGex: f64 = NaN;
let flipPrice: f64 = NaN;
let flipStrike: f64 = NaN;
let painPrice: f64 = NaN;
let putWallPrice: f64 = NaN;
let flipRank = 0;
let painRank = 0;
let putWallRank = 0;

function choiceOf(value: f64, count: i32, fallback: i32): i32 { // a choice's index, or its default when it is missing or outside the words
  if (!isFinite(value) || value < 0.0 || value >= f64(count)) return fallback;
  return i32(value);
}
function numberOf(value: f64, lo: f64, hi: f64, fallback: f64): f64 { // a number setting inside its range, or its default when it is missing
  if (!isFinite(value)) return fallback;
  return value < lo ? lo : value > hi ? hi : value;
}

function onStart(): void {
  chain = new OptionsChain(512);
  windowChain = new OptionsChain(512);
  curve = new GammaCurve(in_chain_max_cells); // a slot per contract the block can carry, so a load is never refused
  nodes = new NodeBoard(MAX_ROWS); // the per-strike buffers are its only allocation
  lens = i32(p_lens());
  windowPct = p_window_pct() / 100.0;
  columns = i32(p_expiries());
  if (columns > MAX_COLS) columns = MAX_COLS;
  marketZone = i32(p_market_zone());
  const intervalSec = p_chart_interval_sec();
  intervalMs = isFinite(intervalSec) && intervalSec > 0.0 ? intervalSec * 1000.0 : 0.0;
  rate = marketZone == 0 ? 0.0 : p_rate_pct() / 100.0; // crypto chains are quoted at a rate of 0
  oiDecimals = marketZone == 0 ? 1 : 0;
  // The reading layer's settings follow the chart's two, so a host that sends the older, shorter list reads NaN for
  // them: each, and a choice outside its words, reads its declared default.
  preset = choiceOf(p_expiry_preset(), 8, EXPIRY_PRESET_COUNT); // the choices are the kit's EXPIRY_PRESET_* codes, in order
  labels = choiceOf(p_node_labels(), 3, LABELS_PCT);
  pctMode = choiceOf(p_node_pct_mode(), 3, PCT_FOCUS);
  significancePct = numberOf(p_significance_pct(), 5.0, 60.0, 15.0);
  lowNodes = choiceOf(p_low_nodes(), 4, LOW_DIM);
  hideUnderPct = numberOf(p_hide_under_pct(), 0.0, 50.0, 0.0);
  palette = choiceOf(p_palette(), 5, 0);
  centerOnTop = choiceOf(p_center(), 2, 0) == 1;
  velFilter = choiceOf(p_velocity_filter(), 3, 0);
  haloOn = numberOf(p_halo(), 0.0, 1.0, 0.0) > 0.5;
  moverCount = i32(numberOf(p_movers(), 0.0, 10.0, 0.0));
  net = choiceOf(p_layout(), 2, 0) == LAYOUT_NET;
  const pick = choiceOf(p_velocity_window(), 8, 0); // 0 off, else the kit's VELOCITY_WINDOWS[pick - 1]
  velOn = pick > 0 && lens != VANNA && lens != CHARM;
  if (velOn) {
    const j = pick - 1;
    velMin = VELOCITY_WINDOWS[j];
    velBelow = j > 0 ? VELOCITY_WINDOWS[j - 1] : 0;
    velAbove = j + 1 < VELOCITY_WINDOWS.length ? VELOCITY_WINDOWS[j + 1] : 0;
    // The rings reach the window, and the halo's wider neighbour too, in the chart's bars: the newest bar, the bar the
    // reach goes back to and one more. A cell takes a ring while the readings last: every cell of a full board on a
    // short window; on a long one the cells nearest the board's centre (a 1h window with its halo on a 1m chart keeps
    // 338, a 1d window there 56), the farthest strikes showing no badge.
    const reach = haloOn && velAbove > velMin ? velAbove : velMin;
    const bars = i32(Math.ceil((f64(reach) * 60000.0) / (intervalMs > 0.0 ? intervalMs : 60000.0))) + 2;
    let keys = VEL_READINGS / bars;
    const keyMax = net ? MAX_ROWS : MAX_CELLS; // a ring a cell: under Layout net, one a strike
    if (keys > keyMax) keys = keyMax;
    if (keys < 1) keys = 1;
    velocity = new StrikeVelocity(keys, bars);
    mapExpiry = new StaticArray<f64>(keys);
    mapStrike = new StaticArray<f64>(keys);
    mapKey = new StaticArray<i32>(keys);
    keyStrike = new StaticArray<f64>(keys);
    keyExpiry = new StaticArray<f64>(keys);
    keySeen = new StaticArray<f64>(keys);
    keyBorn = new StaticArray<f64>(keys);
    freeKeys = new StaticArray<i32>(keys);
    for (let k = 0; k < keys; k += 1) freeKeys[k] = keys - 1 - k; // key 0 is taken first
    freeCount = keys;
    keyCap = keys;
  }
  // A cell's bytes at most: its value, its text, a ramp colour, the dimmed ink and the halo's weight, as these
  // settings write them; the board keeps the strikes whose cells fit the frame.
  cellBytes = 25.0 + (labels == LABELS_OFF ? 10.0 : 28.0) + (palette > 0 ? 18.0 : 0.0) + (lowNodes == LOW_DIM ? 27.0 : 0.0) + (haloOn && velOn ? 21.0 : 0.0);
}

// ── The expiry list: sorted insertion of a distinct live expiry, the nearest kept when full ──
function noteExpiry(ms: f64): void {
  let lo = 0;
  let hi = expiryCount;
  while (lo < hi) {
    const mid = (lo + hi) >> 1;
    if (expiryMs[mid] < ms) lo = mid + 1;
    else hi = mid;
  }
  if (lo < expiryCount && expiryMs[lo] == ms) return;
  if (expiryCount >= MAX_EXPIRIES) {
    if (lo >= expiryCount) return; // later than every kept expiry
    expiryCount -= 1; // the latest makes room
  }
  for (let i = expiryCount; i > lo; i -= 1) expiryMs[i] = expiryMs[i - 1];
  expiryMs[lo] = ms;
  expiryCount += 1;
}
function columnOf(ms: f64): i32 { // the board column of an expiry: its rank among the columns the preset keeps, or -1
  for (let c = 0; c < shownCols; c += 1) if (expiryMs[c] == ms) return c;
  return -1;
}
function keptSetKey(): f64 { // the kept expiries summed, each weighted by its rank: exact in f64 (12 expiries of 1.8e12 ms at most), and a different set sums differently
  let key = 0.0;
  for (let c = 0; c < shownCols; c += 1) key += expiryMs[c] * f64(c + 1);
  return key;
}

// ── The strike table: sorted insertion, one row per strike; when full, the end farther from the centre gives way ──
function clearRow(row: i32): void {
  for (let c = 0; c < MAX_COLS; c += 1) {
    cellValue[row * MAX_COLS + c] = 0.0;
    cellSeen[row * MAX_COLS + c] = 0;
  }
  rowCall[row] = 0.0;
  rowPut[row] = 0.0;
  rowGex[row] = 0.0;
}
function moveRow(from: i32, to: i32): void {
  strikePrice[to] = strikePrice[from];
  rowCall[to] = rowCall[from];
  rowPut[to] = rowPut[from];
  rowGex[to] = rowGex[from];
  for (let c = 0; c < MAX_COLS; c += 1) {
    cellValue[to * MAX_COLS + c] = cellValue[from * MAX_COLS + c];
    cellSeen[to * MAX_COLS + c] = cellSeen[from * MAX_COLS + c];
  }
}
function strikeSlot(strike: f64): i32 { // the row of this strike, inserted when new; -1 when the table is full and this strike is the farthest from the centre
  let lo = 0;
  let hi = rowCount;
  while (lo < hi) {
    const mid = (lo + hi) >> 1;
    if (strikePrice[mid] < strike) lo = mid + 1;
    else hi = mid;
  }
  if (lo < rowCount && strikePrice[lo] == strike) return lo;
  if (rowCount >= rowCap) { // full: the end farther from the centre is dropped, unless this strike is farther still
    const lowGap = Math.abs(strikePrice[0] - boardCentre);
    const highGap = Math.abs(strikePrice[rowCount - 1] - boardCentre);
    if (Math.abs(strike - boardCentre) >= Math.max(lowGap, highGap)) return -1;
    if (lowGap >= highGap) { // drop the lowest row: every row shifts down one
      for (let i = 0; i < rowCount - 1; i += 1) moveRow(i + 1, i);
      if (lo > 0) lo -= 1;
    }
    rowCount -= 1;
    if (lo > rowCount) lo = rowCount;
  }
  for (let i = rowCount; i > lo; i -= 1) moveRow(i - 1, i);
  strikePrice[lo] = strike;
  clearRow(lo);
  rowCount += 1;
  return lo;
}
function atmStrike(): f64 { // the strike nearest spot: the highlighted row
  let best = strikePrice[0];
  for (let r = 1; r < rowCount; r += 1) if (Math.abs(strikePrice[r] - close) < Math.abs(best - close)) best = strikePrice[r];
  return best;
}

// ── One contract on the lens, signed as it counts: dealers long the calls and short the puts, delta in its own sign ──
function lensValue(cells: StaticArray<f64>, i: i32, spot: f64, multiplier: f64, signedGex: f64): f64 {
  if (lens == GAMMA) return signedGex;
  const side = cells[i + 2] > 0.0 ? 1.0 : -1.0;
  const oi = cells[i + 3];
  if (lens == OPEN_INTEREST) return oi; // calls and puts together, in the chain's own amount
  if (lens == DELTA) return cells[i + 5] * oi * multiplier * spot; // delta dollars held
  if (lens == VEGA && cells[i + 9] > 0.0) return side * cells[i + 9] * oi * multiplier; // the venue's vega: dollars per IV point
  const left = optionsLiveUntilMs(cells[i + 1], marketZone) - nowMs; // the time to the expiry's end: 16:15 New York on OPRA
  const years = left < MIN_T_MS ? 0.0 : left / OPTIONS_YEAR_MS;
  const sigma = cells[i + 6] / 100.0; // mark IV rides the chain in percentage points
  if (marketZone == 1) greeks.spot(side, spot, cells[i], years, sigma, rate); // a US stock: Black-Scholes on spot
  else greeks.forward(side, spot, cells[i], years, sigma, rate); // futures and crypto: the underlying is the forward
  if (lens == VEGA) return side * greeks.vega * oi * multiplier;
  return side * (lens == VANNA ? greeks.vanna : greeks.charm) * oi * multiplier * spot; // dollars per IV point, per day
}

// ── The board, measured on every bar that carries the chain ──
function fillBoard(n: i32, centre: f64): void { // the strikes inside the window around `centre`, the preset's columns
  const cells = in_chain_view(); // the live chain in place: the first n values of the build's own buffer
  rowCount = 0;
  boardCentre = centre;
  const lo = centre * (1.0 - windowPct);
  const hi = centre * (1.0 + windowPct);
  for (let i = 0; i + TUPLE - 1 < n; i += TUPLE) {
    const strike = cells[i];
    const oi = cells[i + 3];
    if (!(strike > 0.0) || !(oi > 0.0) || strike < lo || strike > hi) continue;
    const col = columnOf(cells[i + 1]);
    if (col < 0) continue; // an expiry past the board's columns, or already expired
    const multiplier = cells[i + 8] > 0.0 ? cells[i + 8] : 1.0; // Deribit open interest is in coin units (multiplier 1); CME open interest is contracts times the point value
    const spot = cells[i + 7] > 0.0 ? cells[i + 7] : close;
    const gexUsd = cells[i + 4] * oi * multiplier * spot * spot * 0.01; // the USD delta change of the open interest for a 1% move of spot
    const isCall = cells[i + 2] > 0.0;
    const signed = isCall ? gexUsd : -gexUsd; // calls positive, puts negative: the dealer-naive sign convention
    const row = strikeSlot(strike);
    if (row < 0) continue;
    rowGex[row] += signed;
    const v = lensValue(cells, i, spot, multiplier, signed);
    if (!isFinite(v)) continue; // no reading on this lens (no IV to price, a NaN greek): the cell stays as it was
    cellValue[row * MAX_COLS + col] += v;
    cellSeen[row * MAX_COLS + col] = 1;
    if (isCall) rowCall[row] += v;
    else rowPut[row] += v;
  }
  // The nets over the rows the board keeps: a row the table dropped for a nearer strike takes its contracts with it.
  netGex = 0.0;
  netLens = 0.0;
  for (let r = 0; r < rowCount; r += 1) {
    netGex += rowGex[r];
    netLens += rowCall[r] + rowPut[r];
  }
}
function loadNodes(): void { // the nodes over each strike's reading summed across the columns, read against the close
  for (let r = 0; r < rowCount; r += 1) rowSum[r] = rowCall[r] + rowPut[r];
  nodes.load(strikePrice, rowSum, rowCount, close, significancePct);
}
function measureChain(n: i32): void { // n = f64 cells in the block
  const cells = in_chain_view();
  rowCount = 0;
  expiryCount = 0;
  shownCols = 0;
  netGex = 0.0;
  netLens = 0.0;
  for (let i = 0; i + TUPLE - 1 < n; i += TUPLE) if (optionsLiveUntilMs(cells[i + 1], marketZone) > nowMs) noteExpiry(cells[i + 1]); // the live expiries, nearest first
  if (expiryCount > 0) {
    // The columns: the leading live expiries the preset keeps on the market's trade days at the as-of (count keeps
    // Expiry columns), 12 at most; then the strikes whose cells fit the frame at these settings.
    const kept = expiryPresetCount(expiryMs, expiryCount, nowMs, marketZone, preset, columns);
    shownCols = kept < MAX_COLS ? kept : MAX_COLS;
  }
  boardCols = net && shownCols > 0 ? 1 : shownCols; // Layout net draws one column, so its frame fits every row
  if (shownCols > 0) {
    rowCap = i32(Math.min(f64(MAX_ROWS), Math.max(1.0, Math.floor(CELL_BYTES / (f64(boardCols) * cellBytes)))));
    fillBoard(n, close);
  }
  loadNodes();
  if (centerOnTop && nodes.top() >= 0) { // Centre on top: the window again, around the top node's strike
    const topStrike = nodes.strike(nodes.top());
    if (topStrike != close) {
      fillBoard(n, topStrike);
      loadNodes();
    }
  }
  if (net) foldColumns();
}
function foldColumns(): void { // Layout net: each strike's cells summed into its one column, the reading its node is measured on
  for (let r = 0; r < rowCount; r += 1) {
    let seen = 0;
    for (let c = 0; c < shownCols; c += 1) if (cellSeen[r * MAX_COLS + c] != 0) seen = 1;
    cellValue[r * MAX_COLS] = rowSum[r];
    cellSeen[r * MAX_COLS] = seen;
  }
}

// ── Velocity: one reading a bar for each cell, keyed by its strike and expiry (the column moves when an expiry rolls) ──
// A cell keeps its key while it stays on the board; a pair that leaves frees its key for a cell that arrives, and a key
// taken over reads its new pair from the bar it was taken on. Keys go to the strikes nearest the board's centre first,
// so when the cells outnumber them the farthest strikes show no badge, and no ring starts over. Under Layout net a cell
// is its strike's one column, keyed by the strike and the kept expiries (netSetKey): its reading summed over them, a
// bar; when the kept set rolls the key changes and the ring starts over, as a new matrix column's does, so a badge never
// compares a sum over one set with a sum over another.
function mapAt(strike: f64, expiry: f64): i32 { // the first keyed pair at or after this one
  let lo = 0;
  let hi = mapCount;
  while (lo < hi) {
    const mid = (lo + hi) >> 1;
    const e = mapExpiry[mid];
    if (e < expiry || (e == expiry && mapStrike[mid] < strike)) lo = mid + 1;
    else hi = mid;
  }
  return lo;
}
function keyOf(strike: f64, expiry: f64): i32 { // the pair's key, -1 for none
  const at = mapAt(strike, expiry);
  return at < mapCount && mapExpiry[at] == expiry && mapStrike[at] == strike ? mapKey[at] : -1;
}
function mapPut(strike: f64, expiry: f64, key: i32): void {
  const at = mapAt(strike, expiry);
  for (let i = mapCount; i > at; i -= 1) {
    mapExpiry[i] = mapExpiry[i - 1];
    mapStrike[i] = mapStrike[i - 1];
    mapKey[i] = mapKey[i - 1];
  }
  mapExpiry[at] = expiry;
  mapStrike[at] = strike;
  mapKey[at] = key;
  mapCount += 1;
}
function mapDrop(strike: f64, expiry: f64): void {
  const at = mapAt(strike, expiry);
  if (at >= mapCount || mapExpiry[at] != expiry || mapStrike[at] != strike) return;
  for (let i = at; i + 1 < mapCount; i += 1) {
    mapExpiry[i] = mapExpiry[i + 1];
    mapStrike[i] = mapStrike[i + 1];
    mapKey[i] = mapKey[i + 1];
  }
  mapCount -= 1;
}
function rowOf(strike: f64): i32 { // the board's row of a strike, -1 when the board has none
  let lo = 0;
  let hi = rowCount;
  while (lo < hi) {
    const mid = (lo + hi) >> 1;
    if (strikePrice[mid] < strike) lo = mid + 1;
    else hi = mid;
  }
  return lo < rowCount && strikePrice[lo] == strike ? lo : -1;
}
function onBoard(key: i32): bool { // whether the key's pair is a cell of this bar's board
  const r = rowOf(keyStrike[key]);
  if (r < 0) return false;
  const c = net ? (keyExpiry[key] == netSetKey ? 0 : -1) : columnOf(keyExpiry[key]); // Layout net: the strike's one column, while the kept set its ring sums stands
  return c >= 0 && cellSeen[r * MAX_COLS + c] != 0;
}
function takeKey(barMs: f64): i32 { // a key for a cell that arrives: a free one, else the one a pair off the board holds longest, else the one of the cell farthest from the centre not read on this bar; -1 for none
  if (freeCount > 0) {
    freeCount -= 1;
    return freeKeys[freeCount];
  }
  if (!keysLeft) return -1;
  let best = -1;
  let bestOff = false;
  let bestSeen = 0.0;
  let bestGap = 0.0;
  let bestExpiry = 0.0;
  for (let k = 0; k < keyCap; k += 1) {
    const seen = keySeen[k];
    if (seen >= barMs) continue; // read on this bar: a nearer cell keeps it
    const off = !onBoard(k);
    const gap = Math.abs(keyStrike[k] - boardCentre);
    const expiry = keyExpiry[k];
    let better = best < 0;
    if (!better) {
      if (off != bestOff) better = off;
      else if (off) better = seen < bestSeen || (seen == bestSeen && gap > bestGap);
      else better = gap > bestGap || (gap == bestGap && expiry > bestExpiry);
    }
    if (better) {
      best = k;
      bestOff = off;
      bestSeen = seen;
      bestGap = gap;
      bestExpiry = expiry;
    }
  }
  if (best < 0) {
    keysLeft = false; // every key is read by a nearer cell: the rest of this bar's cells go without
    return -1;
  }
  mapDrop(keyStrike[best], keyExpiry[best]);
  return best;
}
function orderRows(): void { // the rows nearest the board's centre first, the lower strike first on a tie
  let right = 0;
  while (right < rowCount && strikePrice[right] < boardCentre) right += 1;
  let left = right - 1;
  for (let n = 0; n < rowCount; n += 1) {
    if (right >= rowCount || (left >= 0 && boardCentre - strikePrice[left] <= strikePrice[right] - boardCentre)) {
      rowOrder[n] = left;
      left -= 1;
    } else {
      rowOrder[n] = right;
      right += 1;
    }
  }
}
function pushVelocity(barMs: f64): void { // this bar's cells into the rings, the nearest strikes first
  keysLeft = true;
  velNowMs = barMs;
  if (net) netSetKey = keptSetKey();
  orderRows();
  for (let i = 0; i < rowCount; i += 1) {
    const r = rowOrder[i];
    for (let c = 0; c < boardCols; c += 1) {
      const at = r * MAX_COLS + c;
      cellKey[at] = -1;
      if (cellSeen[at] == 0) continue;
      const strike = strikePrice[r];
      const expiry = net ? netSetKey : expiryMs[c];
      let key = keyOf(strike, expiry);
      if (key < 0) {
        key = takeKey(barMs);
        if (key < 0) continue; // no key left for this cell: it shows no badge
        mapPut(strike, expiry, key);
        keyStrike[key] = strike;
        keyExpiry[key] = expiry;
        keyBorn[key] = barMs;
      }
      keySeen[key] = barMs;
      velocity.push(barMs, key, cellValue[at]);
      cellKey[at] = key;
    }
  }
}
function readable(key: i32, windowMin: i32): bool { // whether the key's ring holds its pair's reading windowMin minutes back
  return key >= 0 && windowMin > 0 && velNowMs - f64(windowMin) * 60000.0 >= keyBorn[key];
}
function moveOf(at: i32, velActive: bool): f64 { // the cell's move over the window in its unit; NaN for none
  if (!velActive) return NaN;
  const key = cellKey[at];
  return readable(key, velMin) ? velocity.velocity(key, velMin) : NaN;
}
function haloWindow(key: i32, windowMin: i32): i32 { // a halo window the chart can read for this cell, 0 for one it cannot
  return windowMin > 0 && velocity.available(windowMin, intervalMs) && readable(key, windowMin) ? windowMin : 0;
}
function haloOf(key: i32): bool { // one sign over at least two of the windows that can be read (contract C)
  return velocity.halo(key, haloWindow(key, velBelow), haloWindow(key, velMin), haloWindow(key, velAbove));
}

// ── The levels through the options kit: the flip over all expiries, max pain over the whole chain, the walls inside the window ──
function nearestStrikeIndex(price: f64): i32 { // the kit table's strike nearest a price, -1 on an empty table
  const n = chain.strikes();
  let best = -1;
  let bestGap = Infinity;
  for (let i = 0; i < n; i += 1) {
    const gap = Math.abs(chain.strike(i) - price);
    if (gap < bestGap) {
      bestGap = gap;
      best = i;
    }
  }
  return best;
}
function rankOf(value: f64, a: f64, b: f64): i32 { // 1 when this level carries the most |net GEX| of the three, 3 the least
  let rank = 1;
  if (a > value) rank += 1;
  if (b > value) rank += 1;
  return rank;
}
function measureLevels(n: i32): void {
  // OptionsChain keeps the contracts whose stamp is after the clock it is handed: a millisecond before the front live
  // expiry keeps every live one (an OPRA expiry trades 15 minutes past its stamp) and none that has stopped trading.
  const liveFrom = expiryCount > 0 ? expiryMs[0] - 1.0 : nowMs;
  chain.load(in_chain_view(), n, liveFrom, close, 0, 0.0); // every live expiry, every strike: max pain
  windowChain.load(in_chain_view(), n, liveFrom, close, 0, windowPct * 100.0); // the board's window: the walls a chart of this range trades against
  curve.load(in_chain_view(), n, nowMs, 0, close, marketZone); // every live expiry at the as-of: the flip is the curve's zero nearest S0
  const count = windowChain.strikes();
  wallPrice = NaN;
  wallGex = NaN;
  for (let i = 0; i < count; i += 1) {
    const g = windowChain.netGex(i);
    if (g > 0.0 && (isNaN(wallGex) || g > wallGex)) {
      wallGex = g;
      wallPrice = windowChain.strike(i);
    }
  }
  flipPrice = curve.flip();
  painPrice = chain.maxPain();
  putWallPrice = windowChain.putWall();
  const fi = isNaN(flipPrice) ? -1 : nearestStrikeIndex(flipPrice);
  const pi = isNaN(painPrice) ? -1 : nearestStrikeIndex(painPrice);
  const wi = isNaN(putWallPrice) ? -1 : nearestStrikeIndex(putWallPrice);
  flipStrike = fi < 0 ? NaN : chain.strike(fi);
  const fg = fi < 0 ? 0.0 : Math.abs(chain.netGex(fi));
  const pg = pi < 0 ? 0.0 : Math.abs(chain.netGex(pi));
  const wg = wi < 0 ? 0.0 : Math.abs(chain.netGex(wi));
  flipRank = rankOf(fg, pg, wg);
  painRank = rankOf(pg, fg, wg);
  putWallRank = rankOf(wg, fg, pg);
}

// ── Text: the legend entries and the level labels, built without allocating ──
function sbUsd(v: f64): void { // "+$84.3M", "-$4.5M", "+$950.0K"
  if (!isFinite(v)) {
    sb_text("n/a");
    return;
  }
  sb_text(v < 0.0 ? "-$" : "+$");
  const a = Math.abs(v);
  if (a >= 1.0e9) {
    sb_f64(a / 1.0e9, 2);
    sb_text("B");
  } else if (a >= 1.0e6) {
    sb_f64(a / 1.0e6, 1);
    sb_text("M");
  } else if (a >= 1.0e3) {
    sb_f64(a / 1.0e3, 1);
    sb_text("K");
  } else sb_f64(a, 0);
}
function sbCount(v: f64): void { // "12.3K", "995": an open interest, whole contracts under 1,000
  const a = Math.abs(v);
  if (a >= 1.0e6) {
    sb_f64(a / 1.0e6, 1);
    sb_text("M");
  } else if (a >= 1.0e3) {
    sb_f64(a / 1.0e3, 1);
    sb_text("K");
  } else sb_f64(a, oiDecimals);
}
function sbStrike(p: f64): void { // "$86K", "$2.4K", "$0.42": the strike as a short price
  sb_text("$");
  if (p >= 10000.0) {
    sb_f64(p / 1000.0, 0);
    sb_text("K");
  } else if (p >= 1000.0) {
    sb_f64(p / 1000.0, 1);
    sb_text("K");
  } else sb_f64(p, 2);
}
function sbPrice(p: f64): void { // "$85.7K", "$2.44K", "$0.42"
  sb_text("$");
  if (p >= 1000.0) {
    sb_f64(p / 1000.0, 1);
    sb_text("K");
  } else sb_f64(p, 2);
}
function clearTags(): void {
  for (let k = 0; k < 4; k += 1) tags[k].delete(); // no-ops when never drawn
}
function clearNodeTexts(): void { // the columns, the chip and the movers write nothing without a board
  sb_clear();
  str_board_text_sb();
  sb_clear();
  str_nodes_text_sb();
  sb_clear();
  str_movers_text_sb();
}
function writeBoardText(): void { // the legend's first entry: the columns the board shows, and the preset's word
  sb_clear();
  if (shownCols > 0 && rowCount > 0) {
    sb_int(shownCols);
    sb_text(shownCols == 1 ? " expiry" : " expiries");
    if (preset == EXPIRY_PRESET_FRONT) sb_text(", front");
    else if (preset == EXPIRY_PRESET_TO_FRIDAY) sb_text(", to Friday");
    else if (preset == EXPIRY_PRESET_TO_NEXT_FRIDAY) sb_text(", to next Friday");
    else if (preset == EXPIRY_PRESET_TO_OPEX) sb_text(", to opex");
    else if (preset == EXPIRY_PRESET_TO_NEXT_OPEX) sb_text(", to next opex");
    else if (preset == EXPIRY_PRESET_TO_Q_OPEX) sb_text(", to quarterly opex");
    else if (preset == EXPIRY_PRESET_ALL) sb_text(", all");
  }
  str_board_text_sb();
}
function writeTexts(): void { // the legend entries, then each label built in the line buffer and sent with its handle
  writeBoardText();
  sb_clear();
  sb_text("live spot ");
  sbPrice(close);
  str_spot_text_sb();
  const boardPx = net ? 96.0 + 76.0 : 66.0 * f64(shownCols) + 76.0; // the board: 66 px a column (Layout net's one 96 px) plus the price column
  const inset = Math.max(boardPx, 340.0) + 108.0; // past the board (the bars' offset at least) and the 100 px of bars left of it
  if (isNaN(wallPrice)) tags[0].delete();
  else {
    sb_clear();
    sbUsd(wallGex);
    tags[0].set(inset, wallPrice).text(str_wall_text_sb).color(theme.MUTED).valign(VALIGN_BOTTOM); // each tag's box rests on its line, the words above it, so the line never runs through them
  }
  if (isNaN(flipPrice)) tags[1].delete();
  else {
    sb_clear();
    sb_text("#");
    sb_int(flipRank);
    sb_text(" ");
    sbStrike(flipStrike);
    sb_text(" | Flip · all expiries ");
    sbPrice(flipPrice);
    tags[1].set(inset, flipPrice).text(str_flip_text_sb).color(theme.MUTED).valign(VALIGN_BOTTOM);
  }
  if (isNaN(painPrice)) tags[2].delete();
  else {
    sb_clear();
    sb_text("#");
    sb_int(painRank);
    sb_text(" ");
    sbStrike(painPrice);
    sb_text(" | MP ");
    sbPrice(painPrice);
    tags[2].set(inset, painPrice).text(str_pain_text_sb).color(theme.MUTED).valign(VALIGN_BOTTOM);
  }
  if (isNaN(putWallPrice)) tags[3].delete();
  else {
    sb_clear();
    sb_text("#");
    sb_int(putWallRank);
    sb_text(" ");
    sbStrike(putWallPrice);
    tags[3].set(inset, putWallPrice).text(str_put_wall_text_sb).color(theme.MUTED).valign(VALIGN_BOTTOM);
  }
}
function sbLensNet(v: f64): void { // the chip's net in the lens's unit: signed dollars, or an open interest
  if (lens == OPEN_INTEREST) sbCount(v);
  else sbUsd(v);
}
function sbStrikeExact(k: f64): void { // a strike as listed: "103", "6652.5", "0.42"
  sb_f64(k, k == Math.floor(k) ? 0 : k * 10.0 == Math.floor(k * 10.0) ? 1 : 2);
}
function badgeSize(p: f64): f64 { // a move's percent as the badge prints it: no decimals from 10 up, one below
  const a = Math.min(Math.abs(p), 99999.0);
  return Math.abs(p) < 9.95 ? Math.round(a * 10.0) / 10.0 : Math.round(a);
}
function sbBadge(p: f64): void { // "+25%", "-3.4%"
  sb_text(p < 0.0 ? "-" : "+");
  sb_f64(badgeSize(p), Math.abs(p) < 9.95 ? 1 : 0);
  sb_text("%");
}
function writeNodeTexts(velActive: bool): void { // the Above/Below chip, then the movers
  sb_clear();
  if (rowCount > 0 && nodes.top() >= 0) {
    sb_text("Above ");
    sbLensNet(nodes.aboveNet());
    sb_text(" | Below ");
    sbLensNet(nodes.belowNet());
  }
  str_nodes_text_sb();
  sb_clear();
  if (moverCount > 0 && velActive) {
    // A significant strike's move: its cells' moves summed over its reading back then, so every cell needs a reading.
    for (let r = 0; r < rowCount; r += 1) {
      rowTaken[r] = 0;
      rowMove[r] = NaN;
      if (!nodes.isSignificant(r)) continue;
      let move = 0.0;
      let then = 0.0;
      let cells = 0;
      for (let c = 0; c < boardCols; c += 1) {
        const at = r * MAX_COLS + c;
        if (cellSeen[at] == 0) continue;
        const d = moveOf(at, true);
        if (!isFinite(d)) {
          cells = -1;
          break;
        }
        move += d;
        then += cellValue[at] - d;
        cells += 1;
      }
      if (cells > 0 && then != 0.0) rowMove[r] = (100.0 * move) / Math.abs(then);
    }
    let listed = 0;
    for (let k = 0; k < moverCount; k += 1) {
      let best = -1;
      let bestSize = -1.0;
      for (let r = 0; r < rowCount; r += 1) {
        if (rowTaken[r] != 0 || !isFinite(rowMove[r]) || rowMove[r] == 0.0) continue; // a strike that did not move is no mover
        const size = Math.abs(rowMove[r]);
        if (size > bestSize) {
          best = r;
          bestSize = size;
        }
      }
      if (best < 0) break;
      rowTaken[best] = 1;
      sb_text(listed == 0 ? "Movers " : ", ");
      sbStrikeExact(strikePrice[best]);
      sb_text(" ");
      sbBadge(rowMove[best]);
      listed += 1;
    }
  }
  str_movers_text_sb();
}

// ── Frames: the board and the bars, appended as JSON text without allocating ──
function tradeDayOf(sec: f64): f64 { // an instant's trade date on the market's own clock, days since 1970-01-01: CME's trade day opens at 17:00 Chicago (zone 2), every other market's at midnight
  return sessionTradeDate(sec, marketZone, marketZone == 2 ? 1020.0 : 0.0);
}
function expiryDayKey(ms: f64): i32 { // the expiry's trade date on the market's own clock, days since 1970-01-01; a stamp at exactly 00:00 UTC is the date a venue stamped
  if (ms % 86400000.0 == 0.0) return i32(ms / 86400000.0);
  return i32(tradeDayOf(Math.floor(ms / 1000.0)));
}
function todayKey(tradeDate: f64, clockMs: f64, intervalSec: f64): i32 { // today on the same calendar: the bar's trade date, or the trade date of the chain's as-of when that is later on a bar longer than a day (a 1W or 1M bar carries its first day's date)
  const clockDay = tradeDayOf(Math.floor(clockMs / 1000.0));
  if (!isFinite(tradeDate)) return isFinite(clockDay) ? i32(clockDay) : 0;
  const tradeDay = Math.floor(tradeDate / 86400.0);
  return i32(intervalSec > 86400.0 && clockDay > tradeDay ? clockDay : tradeDay);
}
function fbColumnLabel(ms: f64, nearest: bool): void { // "0DTE" for the front expiry on the bar's trade date, else its date as the kit's fbExpiryLabel spells it ("27 Jun", "15 Jan '27" in another year), never the hours left to it
  fb_text("\"");
  if (nearest && expiryDayKey(ms) <= today) fb_text("0DTE");
  else fbExpiryLabel(ms, nowMs, marketZone);
  fb_text("\"");
}
function fbUsd(v: f64): void { // "+$84.3M" inside a frame string
  if (!isFinite(v)) {
    fb_text("n/a");
    return;
  }
  fb_text(v < 0.0 ? "-$" : "+$");
  const a = Math.abs(v);
  if (a >= 1.0e9) {
    fb_f64(a / 1.0e9, 2);
    fb_text("B");
  } else if (a >= 1.0e6) {
    fb_f64(a / 1.0e6, 1);
    fb_text("M");
  } else if (a >= 1.0e3) {
    fb_f64(a / 1.0e3, 1);
    fb_text("K");
  } else fb_f64(a, 0);
}
function priceDecimals(v: f64): i32 { // decimals follow the price's size: strikes at 84,000 / 2,437.5 / 12.5 / 0.42
  return v >= 1000.0 ? 1 : v >= 10.0 ? 2 : v >= 1.0 ? 3 : 5;
}
function fbCount(v: f64): void { // "12.3K", "995" inside a frame string: an open interest, whole contracts under 1,000
  const a = Math.abs(v);
  if (a >= 1.0e6) {
    fb_f64(a / 1.0e6, 1);
    fb_text("M");
  } else if (a >= 1.0e3) {
    fb_f64(a / 1.0e3, 1);
    fb_text("K");
  } else fb_f64(a, oiDecimals);
}
// A cell's own text, at most 16 characters: a node's mark, then its share of the top or the cell's value as the board's
// number words spell it, then the velocity badge. Each piece's length is counted before it is written, so a long one
// drops the mark's space, then the badge's, then the badge.
function digitsOf(x: f64): i32 { // the integral digits of a number at or above 0
  let d = 1;
  let v = Math.floor(x);
  while (v >= 10.0) {
    v = Math.floor(v / 10.0);
    d += 1;
  }
  return d;
}
function unitOf(a: f64, top: i32): i32 { // the value's unit for one decimal, the way the board's number words round: 0 none, 1 K, 2 M, 3 B, 4 T
  if (a < 999.95 || top < 1) return 0;
  if (a < 999950.0 || top < 2) return 1;
  if (a < 999950000.0 || top < 3) return 2;
  if (a < 999950000000.0 || top < 4) return 3;
  return 4;
}
function unitSize(unit: i32): f64 {
  return unit == 1 ? 1.0e3 : unit == 2 ? 1.0e6 : unit == 3 ? 1.0e9 : unit == 4 ? 1.0e12 : 1.0;
}
function scaledOf(a: f64, unit: i32): f64 { // the value in its unit, rounded to one decimal
  return Math.round((a / unitSize(unit)) * 10.0) / 10.0;
}
function valueTextLength(v: f64): i32 {
  const a = Math.abs(v);
  if (lens == OPEN_INTEREST) {
    const unit = unitOf(a, 2);
    if (unit > 0) return digitsOf(scaledOf(a, unit)) + 3;
    return oiDecimals > 0 ? digitsOf(Math.round(a * 10.0) / 10.0) + 2 : digitsOf(Math.round(a));
  }
  if (a < 0.05) return 4; // "$0.0"
  const unit = unitOf(a, 4);
  return 2 + digitsOf(scaledOf(a, unit)) + 2 + (unit > 0 ? 1 : 0);
}
function fbUnit(unit: i32): void {
  if (unit == 1) fb_text("K");
  else if (unit == 2) fb_text("M");
  else if (unit == 3) fb_text("B");
  else if (unit == 4) fb_text("T");
}
function fbValueText(v: f64): void { // "+$84.3M", "-$60.0", "$0.0" (usd, signed, one decimal), or "12.3K", "995" on open interest
  const a = Math.abs(v);
  if (lens == OPEN_INTEREST) {
    const unit = unitOf(a, 2);
    if (unit > 0) {
      fb_f64(scaledOf(a, unit), 1);
      fbUnit(unit);
    } else fb_f64(oiDecimals > 0 ? Math.round(a * 10.0) / 10.0 : Math.round(a), oiDecimals);
    return;
  }
  if (a < 0.05) {
    fb_text("$0.0");
    return;
  }
  const unit = unitOf(a, 4);
  fb_text(v < 0.0 ? "-$" : "+$");
  fb_f64(scaledOf(a, unit), 1);
  fbUnit(unit);
}
function fbBadge(p: f64): void { // "+12%", "-3.4%"
  fb_text(p < 0.0 ? "-" : "+");
  fb_f64(badgeSize(p), Math.abs(p) < 9.95 ? 1 : 0);
  fb_text("%");
}
function fbCellText(prefix: i32, showPct: bool, pct: f64, v: f64, badge: f64): void {
  const markLength = prefix == PREFIX_TOP ? 1 : prefix != PREFIX_NONE ? 2 : 0;
  const bodyLength = showPct ? digitsOf(Math.round(pct)) + 1 : valueTextLength(v);
  let badgeLength = isFinite(badge) ? 3 + digitsOf(badgeSize(badge)) + (Math.abs(badge) < 9.95 ? 2 : 0) : 0;
  let markSpace = prefix >= PREFIX_GATE;
  let badgeSpace = badgeLength > 0;
  let total = markLength + bodyLength + badgeLength;
  if (total > TEXT_MAX && markSpace) {
    markSpace = false;
    total -= 1;
  }
  if (total > TEXT_MAX && badgeSpace) {
    badgeSpace = false;
    total -= 1;
  }
  if (total > TEXT_MAX) badgeLength = 0;
  if (prefix == PREFIX_TOP) fb_text("★");
  else if (prefix == PREFIX_GATE) fb_text("G");
  else if (prefix == PREFIX_FLOOR) fb_text("F");
  else if (prefix == PREFIX_CEILING) fb_text("C");
  if (markSpace) fb_text(" ");
  if (showPct) {
    fb_f64(Math.round(pct), 0);
    fb_text("%");
  } else fbValueText(v);
  if (badgeLength > 0) {
    if (badgeSpace) fb_text(" ");
    fbBadge(badge);
  }
}
function fbHexDigit(d: i32): void {
  if (d < 10) fb_int(d);
  else if (d == 10) fb_text("a");
  else if (d == 11) fb_text("b");
  else if (d == 12) fb_text("c");
  else if (d == 13) fb_text("d");
  else if (d == 14) fb_text("e");
  else fb_text("f");
}
function fbRampColor(drawn: f64, range: f64): void { // "#21918c": the palette's stops at the square root of the cell's share of the range, the dark end at zero
  const first = RAMP_FIRST[palette];
  const stops = RAMP_STOPS[palette];
  const t = range > 0.0 ? Math.sqrt(Math.min(1.0, Math.abs(drawn) / range)) : 0.0;
  const pos = t * f64(stops - 1);
  let i = i32(Math.floor(pos));
  if (i > stops - 2) i = stops - 2;
  const f = pos - f64(i);
  const a = RAMPS[first + i];
  const b = RAMPS[first + i + 1];
  fb_text("#");
  for (let shift = 16; shift >= 0; shift -= 8) {
    const ca = f64((a >> shift) & 0xff);
    const cb = f64((b >> shift) & 0xff);
    const ch = i32(Math.round(ca + (cb - ca) * f));
    fbHexDigit(ch >> 4);
    fbHexDigit(ch & 15);
  }
}
function prefixOf(r: i32): i32 { // the mark a node's cell starts with: the star on the top, G, F and C under Node % focus
  const role = nodes.role(r);
  if (role == NODE_ROLE_TOP) return PREFIX_TOP;
  if (pctMode != PCT_FOCUS) return PREFIX_NONE;
  if (role == NODE_ROLE_GATE) return PREFIX_GATE;
  if (role == NODE_ROLE_FLOOR) return PREFIX_FLOOR;
  if (role == NODE_ROLE_CEILING) return PREFIX_CEILING;
  return PREFIX_NONE;
}
function pctShown(r: i32): bool { // whether the strike's node prints its share of the top
  if (labels != LABELS_PCT) return false;
  if (pctMode == PCT_FOCUS) return nodes.isSignificant(r);
  if (pctMode == PCT_TOP) return nodes.role(r) == NODE_ROLE_TOP;
  return false;
}
function rowHidden(r: i32): bool { // a strike under Hide strikes under, or a low node under Low nodes hide
  if (hideUnderPct > 0.0 && nodes.pctOfTop(r) < hideUnderPct) return true;
  return lowNodes == LOW_HIDE && !nodes.isSignificant(r);
}
function cellFiltered(at: i32, velActive: bool): bool { // a cell the velocity filter leaves out: its move has the other sign, or none
  if (!velActive || (velFilter != FILTER_UP && velFilter != FILTER_DOWN)) return false;
  const move = moveOf(at, true);
  return velFilter == FILTER_UP ? !(move > 0.0) : !(move < 0.0);
}
function dominantCol(r: i32): i32 { // the row's largest cell, where its node's text goes (the nearer expiry on a tie); -1 for none
  let best = -1;
  let bestSize = -1.0;
  for (let c = 0; c < boardCols; c += 1) {
    const at = r * MAX_COLS + c;
    if (cellSeen[at] == 0) continue;
    const size = Math.abs(cellValue[at]);
    if (size > bestSize) {
      best = c;
      bestSize = size;
    }
  }
  return best;
}
function writeCell(r: i32, c: i32, node: i32, low: bool, velActive: bool, range: f64, valueDecimals: i32): void {
  const at = r * MAX_COLS + c;
  if (cellSeen[at] == 0 || cellFiltered(at, velActive)) {
    fb_text("null"); // no open interest (or no reading on the lens) in this cell, or the velocity filter leaves it out
    return;
  }
  const v = cellValue[at];
  const faded = low && lowNodes == LOW_FADE;
  const drawn = faded ? v * FADE : v; // a faded low node keeps its reading in its text
  const prefix = c == node && labels != LABELS_OFF ? prefixOf(r) : PREFIX_NONE;
  const showPct = c == node && pctShown(r);
  const key = velActive ? cellKey[at] : -1;
  const badge = labels != LABELS_OFF && readable(key, velMin) ? velocity.velocityPct(key, velMin) : NaN;
  const texted = labels == LABELS_OFF || prefix != PREFIX_NONE || showPct || isFinite(badge) || faded;
  const dim = low && lowNodes == LOW_DIM;
  const bold = haloOn && key >= 0 && haloOf(key);
  if (!texted && !dim && !bold && palette == 0) { // a plain cell: the number, printed by the board's own words
    fb_f64(drawn, valueDecimals);
    return;
  }
  fb_text("{\"value\":");
  fb_f64(drawn, valueDecimals);
  if (texted) {
    fb_text(",\"text\":\"");
    if (labels != LABELS_OFF) fbCellText(prefix, showPct, nodes.pctOfTop(r), v, badge);
    fb_text("\"");
  }
  if (palette > 0) {
    fb_text(",\"color\":\"");
    fbRampColor(drawn, range);
    fb_text("\"");
  }
  if (dim) fb_text(",\"text_color\":\"theme.muted\"");
  if (bold) fb_text(",\"font_weight\":\"bold\"");
  fb_text("}");
}
function fbNetLabel(): void { // Layout net's one header, the expiries its column sums: "Net · 5 exp"
  fb_text("\"");
  fb_text(NET_HEADERS[shownCols]);
  fb_text("\"");
}
function writeBoard(velActive: bool): void { // strikes ascending, one cell per expiry column (Layout net: one column), the row of the strike nearest spot highlighted
  const cols = boardCols;
  const decimals = priceDecimals(close);
  const valueDecimals = lens == OPEN_INTEREST ? oiDecimals : 0;
  let range = 0.0; // a ramp's top: the largest |value| the board draws
  if (palette > 0) {
    for (let r = 0; r < rowCount; r += 1) {
      if (rowHidden(r)) continue;
      const fade = !nodes.isSignificant(r) && lowNodes == LOW_FADE ? FADE : 1.0;
      for (let c = 0; c < cols; c += 1) {
        const at = r * MAX_COLS + c;
        if (cellSeen[at] == 0 || cellFiltered(at, velActive)) continue;
        const a = Math.abs(cellValue[at] * fade);
        if (a > range) range = a;
      }
    }
  }
  fb_clear();
  fb_text("{\"prices\":[");
  for (let r = 0; r < rowCount; r += 1) {
    if (r > 0) fb_text(",");
    fb_f64(strikePrice[r], decimals);
  }
  fb_text("],\"cells\":[");
  for (let r = 0; r < rowCount; r += 1) {
    if (r > 0) fb_text(",");
    fb_text("[");
    const hidden = rowHidden(r);
    const low = !nodes.isSignificant(r);
    const node = dominantCol(r);
    for (let c = 0; c < cols; c += 1) {
      if (c > 0) fb_text(",");
      if (hidden) fb_text("null");
      else writeCell(r, c, node, low, velActive, range, valueDecimals);
    }
    fb_text("]");
  }
  fb_text("],\"cols\":[");
  for (let c = 0; c < cols; c += 1) {
    if (c > 0) fb_text(",");
    if (net) fbNetLabel();
    else fbColumnLabel(expiryMs[c], c == 0);
  }
  fb_text("],\"title\":\"");
  fb_text(net ? NET_TITLES[lens] : LENS_TITLES[lens]);
  fb_text("\",\"highlight\":{\"price\":"); // the row alone: a col here would outline the whole column too
  fb_f64(atmStrike(), decimals);
  fb_text("}}");
  writeFrameBuffer(lens == OPEN_INTEREST ? (net ? oiNetBoard : oiBoard) : net ? netBoard : board);
}
function writeBars(): void { // the board's row sums as bars, positive in the chart's up colour and negative in its down colour, a hover hint per row
  const decimals = priceDecimals(close);
  fb_clear();
  fb_text("{\"prices\":[");
  for (let r = 0; r < rowCount; r += 1) {
    if (r > 0) fb_text(",");
    fb_f64(strikePrice[r], decimals);
  }
  fb_text("],\"values\":[");
  for (let r = 0; r < rowCount; r += 1) {
    if (r > 0) fb_text(",");
    fb_f64(rowCall[r] + rowPut[r], lens == OPEN_INTEREST ? oiDecimals : 0);
  }
  fb_text("],\"colors\":[");
  for (let r = 0; r < rowCount; r += 1) {
    if (r > 0) fb_text(",");
    fb_text(rowCall[r] + rowPut[r] >= 0.0 ? "\"theme.up\"" : "\"theme.down\"");
  }
  fb_text("],\"tooltips\":[");
  for (let r = 0; r < rowCount; r += 1) {
    if (r > 0) fb_text(",");
    fb_text("\"C ");
    if (lens == OPEN_INTEREST) fbCount(rowCall[r]);
    else fbUsd(rowCall[r]);
    fb_text(" | P ");
    if (lens == OPEN_INTEREST) fbCount(rowPut[r]);
    else fbUsd(rowPut[r]);
    fb_text("\"");
  }
  fb_text("]}");
  writeFrameBuffer(lens == OPEN_INTEREST ? oiRows : gexRows);
}

function noReadings(): void { // a bar without the chain, or a history bar: the readings are the live bar's
  out_net_gex(NaN);
  out_net_lens(NaN);
  out_wall_price(NaN);
  out_flip_price(NaN);
  out_pain_price(NaN);
  out_put_wall_price(NaN);
}

// onBar() runs once per bar: a bar without the chain costs one read; a bar that carries it is measured, its cells read
// into the velocity rings; the live bar writes the readings, places the labels and writes the two boards.
function onBar(): void {
  prevT = t;
  t = bar.time();
  close = bar.close();
  out_spot(close);
  out_t_prev(prevT);
  out_t_last(t);
  const last = bar.isLast();
  const n = isNaN(close) || isNaN(t) ? 0 : in_chain_cells();
  if (n < TUPLE) {
    if (last) {
      clearTags();
      clearNodeTexts();
    }
    noReadings();
    return;
  }
  nowMs = optionsAsOfMs(t * 1000.0, intervalMs); // the chain's as-of: the bar's close time
  measureChain(n);
  if (velOn && rowCount > 0) pushVelocity(t * 1000.0);
  if (!last) {
    noReadings();
    return;
  }
  today = todayKey(in_trade_date(), nowMs, intervalMs > 0.0 ? intervalMs / 1000.0 : t - prevT); // the day the 0DTE label asks for
  measureLevels(n);
  out_net_gex(rowCount > 0 ? netGex : NaN);
  out_net_lens(rowCount > 0 ? netLens : NaN);
  out_wall_price(wallPrice);
  out_flip_price(flipPrice);
  out_pain_price(painPrice);
  out_put_wall_price(putWallPrice);
  writeTexts();
  const velActive = velOn && rowCount > 0 && velocity.available(velMin, intervalMs);
  writeNodeTexts(velActive);
  if (rowCount > 0) {
    writeBoard(velActive);
    writeBars();
  }
}
How it works
The chain is live only. input("chain", options_chain.cells, { max_cells: 4000, venue: "auto" }) delivers the chart's own listed contracts as [strike, expiry_ms, side, oi, gamma, delta, mark_iv, underlying, multiplier, vega] tuples on the live row (a BTC chain is about 1,550; on a governed chain, OPRA or CME, the chart serves as many strikes each side of every expiry's money as 4,000 contracts fit, 27 on SPY's 36 expiries); history bars carry an empty block and cost one read, so the boards and the levels are measured on the last bar and rewritten as the chain moves. venue: "auto" reads the chart's own market when it lists options, else the coin's Deribit chain.
The lens per cell. On the default gamma lens each cell is gamma times open interest times the multiplier times spot squared times 0.01 (Deribit open interest is in coin units with multiplier 1; CME open interest is contracts times the point value), calls positive and puts negative; each contract lands in the cell of its strike row and its expiry column. window_pct (7) keeps the strikes within that percent of spot each side and expiries (4) the nearest expiries; a strike table of 128 rows holds the window, and when a window is wider than that the strike farthest from spot gives way. Each row also keeps its call and put halves for the bars' hover card, and net_gex sums the net GEX of the rows the board keeps as a data-only output, live bar only, whatever the lens (a strike the table drops for a nearer one takes its contracts with it, so the nets always match the cells). The other lenses follow Greek exposure's definitions in dollars, with the dealers long the calls and short the puts: delta is delta times open interest times the multiplier times spot, each option in its own sign; vega is the venue's vega (or the model's, where the venue serves none) times open interest times the multiplier, per IV point; vanna and charm are priced from each contract's mark IV (Black-Scholes on spot on a US stock at the Rate setting, Black-76 on the forward elsewhere, a crypto chain at a rate of 0), times open interest, the multiplier and spot, per IV point and per calendar day; the open interest lens sums both sides' open interest in the chain's own amount (contracts, or coins on Deribit) and prints it on a board of its own, one ramp from the background to the up colour: the frame carries whole contracts on OPRA and CME (coins to a tenth on Deribit) and format: "auto" prints a number as written, so a cell of 995 contracts reads 995, never 995.0, and 12,345 reads 12,345; the bars and both hovers print the same way. net_lens sums the board's rows on the lens. A contract with no reading on the lens (no IV to price) leaves its cell as it was.
The chain's as-of. The chain is read as of the live bar's close time, optionsAsOfMs(t * 1000, intervalMs) with the bar's length from chart.interval_sec(): the chart serves the snapshot as of a moment inside the live bar and names it to no module, so the close is the clock every options card reads on that bar, never a time solved back from a gamma. An expiry is live while optionsLiveUntilMs(expiry, zone) is after the as-of: on OPRA 15 minutes past its stamp, since a US listed PM expiry stamped 16:00 New York trades to 16:15, so on the 5-minute bar opening at 16:00 (read as of 16:05) today's expiry still heads the board as 0DTE, and from the bar opening at 16:15 tomorrow's leads; on CME and crypto the stamp itself. Vega, vanna and charm price each contract to that end. OptionsChain keeps the contracts stamped after the clock it is handed, so it is handed a millisecond before the front live expiry: max pain and the walls read the same live expiries as the board and the flip. On a bar of a day or longer the close is the bar's end, so an expiry that settles inside the live bar is already off the board.
The date decides 0DTE. The front column reads 0DTE when its expiry's trade date is today's, never when it is under 24 hours away: at 11:00, tomorrow's 10:00 expiry is 23 hours off and still reads 16 Oct. Both dates are read on the market's own clock, sessionTradeDate() on market.zone(), the calendar time.trade_date uses: the UTC date on crypto, New York's on a US stock, and on CME the trade date, which opens at 17:00 Chicago (tradeDayOf()). Today is the bar's trade date, and on a 1W or 1M bar, which carries its first day's date all period, the later of that and the trade date of the as-of (todayKey()). expiryDayKey() reads a stamp at exactly 00:00 UTC as the date a venue stamped and every other stamp at its instant, so Binance's metals expiry at 21:00 UTC stays today's. The header's dates are the same reading, written by the frame buffer's fbExpiryLabel(expiryMs, nowMs, zone): the day and the month (16 Oct), and the year's last two digits once the expiry's trade date falls in another year than the as-of's (15 Jan '27), at most ten characters inside a column's 16, so the 66 px column holds every label whole.
The columns. expiry_preset (count by default) picks how many of the live expiries the board shows with the kit's expiryPresetCount(expiryMs, expiryCount, nowMs, zone, preset, columns), on the market's trade days at the as-of: front keeps the first expiry, to_friday every expiry through the first Friday on or after today, to_next_friday a week further, to_opex through this month's third Friday (next month's once it has passed), to_next_opex through the month after that, to_q_opex through the next third Friday of March, June, September or December, all every live expiry, and count the expiries setting's N. The board holds 12 columns at most, so all keeps the nearest 12; a preset that keeps none (a chain whose nearest expiry falls after this Friday, read to Friday) writes no board. The headers keep their dates, the front one 0DTE on its own trade date.
The nodes. Each strike's reading is its row summed across the board's columns (calls plus puts, the bar's value), loaded into the kit's NodeBoard against the close at significance_pct (15): the top is the largest |reading|, the gate the largest strictly between spot and the top, kept at 35% of the top or more, the floor and the ceiling the largest strictly below and above spot, the standouts the other local peaks at 50% of the top or more, and a significant strike one at significance_pct of the top or more. A strike's text goes on its largest cell (the nearer expiry on a tie): the top's starts with the star, and under Node % focus the gate's, the floor's and the ceiling's with G, F and C. Under Node labels pct that cell prints the strike's share of the top (★100%, G 36%, 55%) where Node % asks for one (focus: every significant strike; top: the top alone; off: none), and every other cell prints its own value through the board's number words; under value a marked cell prints its own value after the mark (★+$60.0); under off no cell prints anything, the fills alone. A cell carrying a text, an ink or a weight is written as an object, { "value": 60, "text": "★100%" }, every other cell as its number. The legend's chip reads aboveNet() and belowNet(): the readings of the strikes above the close and below it, summed (Above +$179 | Below -$60; an open interest reads unsigned).
Low nodes and hidden strikes. The strikes under the significance share are low nodes: Low nodes shows them as they are, hides them (empty cells), dims them (text_color: "theme.muted", the value kept) or fades them (the value at a fifth, so the fill fades, the text keeping the reading). Hide strikes under empties every strike whose share of the top is under the setting, 0 hiding none. Centre on top measures the board again around the top node's strike, so a node away from spot sits in the middle of the window; the highlight still marks the strike nearest the close.
The palettes. Classic keeps the sheet's palette, the chart's down, background and up colours. Viridis, cividis, inferno and plasma colour each cell in the module: the ramp's stops (dark theme hex, low to high) interpolated at the square root of the cell's |value| over the largest one the board draws, so the dark end sits at zero on both sides of the signed board (the ramp mirrored) and at the smallest count on the open interest board, and the largest cell takes the top stop (#fde725 on viridis). The colour rides the cell as color.
Velocity. With velocity_window on and a lens that has velocity (gamma, delta, vega and open interest; vanna and charm show none), every bar that carries the chain pushes each cell's reading into the kit's StrikeVelocity, keyed by the cell's strike and expiry, so a column that moves when an expiry rolls keeps its readings. On the live bar a cell's text ends with its move over the window in percent (+12%, -3.4%: no decimals from 10 up, one below); velocity_filter increasing or decreasing empties the cells that did not rise or fall; halo bolds the cells whose move has one sign over at least two of the window and its two neighbours among 1m, 5m, 10m, 15m, 1h, 4h and 1d, counting only the windows the chart can read (a 1m neighbour on a 5m chart casts no vote); movers lists the significant strikes with the largest move in the legend (Movers 103 +25%, 110 -12%), a strike's move being its cells' moves over its reading back then. A window shorter than the chart's bar, or longer than the bars that carried the chain reach back, is unavailable: no badge, and the filter keeps every cell. The chart serves the chain on the live bar, so a window reads once the bars that carried it reach that far back. The rings reach the window (and, with the halo, its wider neighbour) in the chart's bars, and hold 81,920 readings in all (1.25 MiB inside the module's 4 MiB). A cell keeps its ring while it stays on the board, a pair that leaves frees its ring for a cell that arrives (read from the bar it arrived on), and the rings go to the strikes nearest the board's centre first: every cell of a full board on a short window; on a long one the nearest cells (a 1h window with its halo on a 1m chart keeps 338, a 1d window there 56), the farthest strikes showing no badge. A move of spot keeps every ring of the cells that stay on the board.
The net layout. layout net (matrix by default) draws each board as one column: a strike's cell is its reading summed over the columns the preset or the count keeps, the row sum the nodes and the bars already read, so the column, the bars and the Above/Below chip agree. It rides a board of its own, the net_board frame on the gex_net matrix (oi_net_board on oi_net for open interest), declared after the frames and matrices that were there so every earlier slot stays, with column_width: 96 so a summed value's text fits whole inside the 16 characters a cell holds. The header reads Net and the count of expiries it sums (Net · 5 exp), the title names the lens (Net GEX, Net OI). Every node rule reads that one column: the star on the top, G, F and C under Node % focus, the share or the value under Node labels, Low nodes, Hide strikes under and Centre on. The velocity rings key the strike alone and read its summed value each bar, so a strike whose expiries move apart shows its net move (+25%) where the matrix shows each cell's own (+50% and +0.0%). The levels and their labels (placed past the narrower board), the highlight row, the bars (at their 340 px offset, a little apart from the board) and the legend read as the matrix layout's. A host that sends the settings list from before Layout existed reads it as matrix, byte for byte the board it drew before.
The frame's size. A board frame holds 96 KiB. Each cell's bytes at most follow the settings (its text, a ramp colour, the dimmed ink, the halo's weight), so the board keeps the strikes nearest its centre whose cells fit: all 128 rows at four columns, 98 at twelve on the defaults, 65 at twelve with every option on; Layout net's one column keeps all 128.
The levels. The gamma flip is the options kit's GammaCurve over every live expiry at the as-of, curve.load(in_chain_view(), n, nowMs, 0, close, marketZone) pricing each contract to its expiry's end: gamma exposure priced again at each hypothetical spot with every contract's own underlying moved with it, and the flip the curve's zero nearest S0 (the nearest expiry's median underlying), walked out in 0.25% steps up to 50% each side and bisected, the level Gamma Map and the Options Dashboard read too (The canonical numbers); with no zero within 50% it reads NaN and draws no line. The chain goes through the OptionsChain kit twice: the whole chain, every live expiry and every strike, gives maxPain(), and a second load with the board's window_pct gives the walls a chart of this range trades against, read as Gamma Map reads them: netGex(i) finds the strike inside the window holding the largest positive net GEX and putWall() the heaviest put strike at or below spot inside it, so the two templates name the same put wall on the same chain. The labels rank the flip, max pain and the put wall 1 to 3 by the absolute net GEX at the strike nearest each (#1 $86K | Flip · all expiries $85.7K, the flip's label naming its scope), so the heaviest level reads first. The level prices are data-only outputs, NaN on history bars, and t_prev and t_last carry the two newest bar times the lines are placed from.
Two frames, two canvases. A dollar lens writes the board and gex_rows frames, the open interest lens the oi_board and oi_rows frames, so the pair the lens does not pick stays absent; Layout net writes net_board or oi_net_board in place of the lens's board, and the matrix board stays absent then. The board frame carries prices (the strikes, ascending), cells (one row per price, one entry per column: a number, null where the expiry lists no open interest at the strike or a setting empties the cell, or an object carrying the number beside its text, colour, ink and weight), cols (the expiry labels, 0DTE for the front expiry on the bar's trade date, else its date: 27 Jun, or 15 Jan '27 in another year), a title naming the lens (GEX by expiry, OI by expiry) and a highlight naming the price of the strike nearest spot, so the board outlines that one row. The bars frame carries the same prices, the row sums as values, a colour per row (theme.up for a positive sum, theme.down for a negative one) and a tooltips entry naming the call and put halves. Both are appended with fb_text and fb_f64 into the generated frame buffer and sent with writeFrameBuffer, so the live bar allocates nothing. plot.matrix({ frame: board, dock: "right" }) docks the board at the price axis, each row on its strike's price, the header sticky at the top; palette: ["theme.down", "theme.bg", "theme.up"] with center: 0 and scale: "sqrt" tints the cells on a diverging ramp from the chart's down colour through its background to its up colour, format: "usd" with signed: true prints them as signed dollars, grid_lines: "all" rules every cell, highlight_color: "theme.text" outlines the at-the-money row in the text ink and tooltip puts a readout under the cursor. plot.levels({ frame: gexRows, dock: "right", baseline: "center" }) draws the bars from a zero line mid-dock, width_px: 100 and thickness_px: 10 size them, and hover: true opens the row's card. Two canvases docked on the same side overprint and no word stacks them: offset: [340, 0], the board's width (four columns of 66 px plus the price column), pushes the bars inward so they sit left of the board instead of under it. In the sheet beside names another level only; once it can name a matrix, beside naming the board replaces this pixel offset and follows the board's own width, and until then the offset stays.
The legend. legend({ title: "±{{window_pct}}%" }) puts the strike window after the indicator's name (±7%), filled from the setting of that name, so the words stay true on every coin; a title reads settings alone, so the columns the board shows ride the first entry instead, render.legend("board_entry", { text: "board_text" }), written on the live bar from the columns the preset kept (4 expiries, 3 expiries, to Friday, 12 expiries, all). render.legend("spot_entry", { text: "spot_text" }) adds the live spot from a string slot written on the live bar (live spot $86.5K: the live bar's reading, which a crosshair on an older bar leaves as it is). Two more entries read the nodes_text and movers_text slots: the Above/Below chip and, with Movers above 0 and a velocity window that reads, the movers; each is empty otherwise.
The lines and their labels. Each draw.line runs from t_prev to t_last at its level's price with extend: "both", so the dashed line spans the whole pane. The labels are label handles declared once with handles.label({ anchor: "right", align: "right", style: "plain", font_weight: "medium" }): tags[k].set(inset, price) puts a label's right edge inset pixels in from the price axis at its level's price, and inset is the board's width (66 px a column plus the 76 px price column, at least the bars' 340 px offset) plus the 100 px of bars and an 8 px gap, so a label never covers a cell or a bar or runs into the axis whatever expiries reads. Its text is built with sb_text, sb_f64 and sb_int and sent with its own slot's sender (.text(str_flip_text_sb)), and .color(theme.MUTED) inks every label as plain text in the muted colour, whatever its line's colour. A level that is NaN deletes its label and draws no line.
What the settings do
- Lens: What the boxes show: gamma (how fast dealers must hedge) by default. delta shows how much of the asset dealers must hold to hedge. vega shows how much they gain or lose when option prices rise. vanna and charm show how that hedge changes with option prices (vanna) or with time (charm). oi shows open interest (contracts still held open).
- Strike window, percent: How far above and below the price the board's strikes reach, in percent.
- Expiry columns: How many expiry dates get a column when Expiry preset is count, nearest first.
- Rate, percent: The interest rate used to price vega, vanna and charm on US stocks and CME futures.
- Expiry preset: Picks the columns: front keeps the nearest expiry date. to_friday and to_next_friday reach this or next Friday. to_opex and to_next_opex reach this or next monthly expiry (opex, its third Friday). to_q_opex reaches the next quarterly one, all shows up to 12, and count follows Expiry columns.
- Node labels: A node is one strike's total across the board. off prints nothing in the boxes, and value prints each box's number. pct prints a node's share of the strongest node on its biggest box.
- Node %: focus prints the shares on every key node (see Significant at), top on the strongest only, and off nowhere. focus also tags the floor (F), the biggest node below the price, and the ceiling (C), the biggest above it. The gate (G) is the biggest node between the price and the strongest one.
- Significant at, percent of the top: A strike is key when its total reaches this share of the strongest strike's.
- Low nodes: Shows, hides, dims or fades the strikes below the key share.
- Hide strikes under, percent of the top: Blanks every strike whose total is under this share of the strongest, 0 hiding none.
- Palette: Uses the chart's own down and up colours, or a colour-blind-safe scale that is dark at zero.
- Centre on: Centres the strike window on the price (spot) or on the strongest strike (top).
- Velocity window: How far back each box is compared, shown as a percent badge after its text.
- Velocity filter: Keeps every box, or only the boxes whose number rose or fell.
- Halo: Bolds a box whose move points the same way in at least two of three windows. Those are the Velocity window and the next shorter and longer ones.
- Movers: Lists this many key strikes with the biggest moves in the legend.
- Layout: Matrix shows one column per expiry date, and net folds them into one summed column.
Where it runs
It works on any chart with listed options. On crypto, that is any coin Deribit lists options for, such as BTC, ETH and SOL, on any exchange. For example, Binance Futures BTCUSDT and Binance spot ETHUSDT both work. On a US stock or ETF chart, every indicator can read that symbol's US listed options. On a futures chart from CME, the Chicago exchange, it reads that future's own options. US options data is 15 minutes behind unless you have real-time US options data. CME data is 10 minutes behind unless you have real-time CME data. A copy you run from the editor (where you write and run indicators) reads crypto, US stock and CME options. On a CME chart, accept the CME market data terms first. The chart sends the newest options snapshot on the live bar only, about every 30 seconds. Older bars get no options data. On a 1-minute or 5-minute chart, the candles span only a few strikes. Drag the price axis to zoom out, and the board shows more strikes. The picture above is a 5-minute chart zoomed out that way.
When data is missing
On a market with no listed options, it stops before loading anything. The error names the problem and the way out. On HYPERLIQUID_FUTURES/PURR, for example, it says PURR is not listed on Deribit. It then suggests a CME futures chart or a coin Deribit lists, such as BTC, ETH or SOL. Until the options data arrives, the chart shows only the candles. If no expiry is still trading, no board and no bars appear. A box with no open interest (contracts still open) prints nothing and stays uncoloured. A level it cannot find draws no line and no label. That happens with no gamma flip, or no put strike at or below the price on the board. An Expiry preset that keeps no date draws no board. A Velocity window shorter than one bar, or longer than the data so far, shows no badge. The Velocity filter then keeps every box. A chart saved with an older version opens on the same columns. Every setting that version lacked starts at its default, and Layout starts on matrix. A choice the setting does not list also falls back to its default.
Customize it
- Another lens. Set Lens to delta, vega, vanna, charm or oi; the board, the bars and their hover cards follow, the levels stay gamma's.
- A narrower board. Lower
window_pctfor the strikes nearest spot, orexpiriesto 2 for the front of the curve. - More columns. Raise
expiries(up to 12) and add 66 px to theoffsetofplot.levelsfor every added column, so the bars keep clear of the wider board; the labels move left with the board on their own. - Bars on the other side.
dock: "left"onplot.levelsputs the bars at the left edge of the pane; drop theoffsetthen. - Fewer levels. Delete a
draw.line, its label's block inwriteTexts(), the output the line reads and the string slot the label sends; the rest keeps drawing. - Pin the venue. Change
venue: "auto"to"deribit"and Run again to read the coin's Deribit chain even where the chart's market lists options of its own;"cme"reads a CME futures chart's chain. - A calendar of columns. Set Expiry preset to to_friday for this week's expiries, to_opex through the monthly, or all for every live one (12 at most).
- One net column. Set Layout to net: each board folds into one 96 px column, every strike's reading summed over the expiries Expiry preset keeps (
Net · 5 exp), the star and the marks on that column. - Fewer labels. Node % top labels the top node alone; Node labels off leaves the fills.
- Less noise. Low nodes hide, or Hide strikes under 20, keeps the strikes that matter.
- A colour-blind-safe board. Palette viridis or cividis paints the cells on a ramp dark at zero.
- Velocity. On a 1m chart, Velocity window 5m with Halo on and Movers 5 marks the cells moving fastest.
- Your own colours. The palette's two ends, the bars and the four levels are theme words (
theme.up,theme.down,theme.text,theme.muted), so they follow the chart's theme and the user's up and down colours; a hex word in their place fixes a colour (Style anything).
Run it
- In the editor's Explorer, press the Templates icon ("Browse starter templates") and pick Strike Matrix under On price.
- Press Run on a BTC or ETH chart: the board docks at the price axis once the chain arrives, the bars beside it, the four dashed levels across the chart with their labels just left of the bars. Drag the price axis to zoom it out if the board shows only a few rows.
- Hover a cell for its net GEX or a bar for the row's call and put halves; at the editor's Console prompt, type
net_gexto read the board's sum, orflip_pricefor the gamma flip. - In the settings, set Expiry preset, Node labels, Velocity window or Layout: the board is rewritten on the next bar, the star on the top node.
Concepts used
- Data sources for the
options_chaincelled class, its tuple and thevenueword - Price canvases for
plot.matrix, the matrix frame, the colour scale and the hover readout - Docked profiles for
plot.levelsover a frame,baseline,hoverandoffset - Drawing objects for
draw.lineplaced from the newest bar and label handles pinned in pixels from the price axis - Options kit for
GammaCurveand the flip andOptionsChainfor max pain and the walls, and The market's own date and the chain's clock foroptionsAsOfMsandoptionsLiveUntilMs - The strike board for
NodeBoard,expiryPresetCountandStrikeVelocity: the nodes, the columns and the velocity - Panel frames for
fbExpiryLabel, the column dates - Style anything for the whole desk, part by part