Options Dashboard
Eight tiles below the chart read the chart coin's live options chain at a glance: live net GEX at spot, the gamma flip and max pain with their distance from spot (the flip is the curve's own zero crossing nearest spot, so the tile, the legend and the curve name one level, and the tile reads No flip in range while the curve keeps one sign across its grid), the dealer regime in words (Negative Gamma, dips sold and rallies bought; Positive Gamma, dips bought and rallies sold), the put/call ratio, the 25-delta skew of the front expiry, net vega exposure and dealer delta in coins. Under them, the net gamma exposure curve over a grid of hypothetical spots: a smooth line in the chart's text ink, filled in its up colour above zero and its down colour below, a dashed Spot marker, callouts pinned on the curve at the gamma flip, the peak and the trough, and a badge chip naming the regime (SHORT GAMMA, AMPLIFIED in the down colour, LONG GAMMA, DAMPENED in the up colour). At the bottom, a rolling cumulative volume delta histogram in a pane of its own, in the up colour while positive and the down colour while negative. The legend entry names the regime and the flip, in the up colour under positive gamma and the down colour under negative. Every colour is a theme word, so the desk follows the chart's theme and the user's own up and down colours. The chain is live only: the tiles and the curve are rewritten on the last bar, and the CVD runs over every bar.
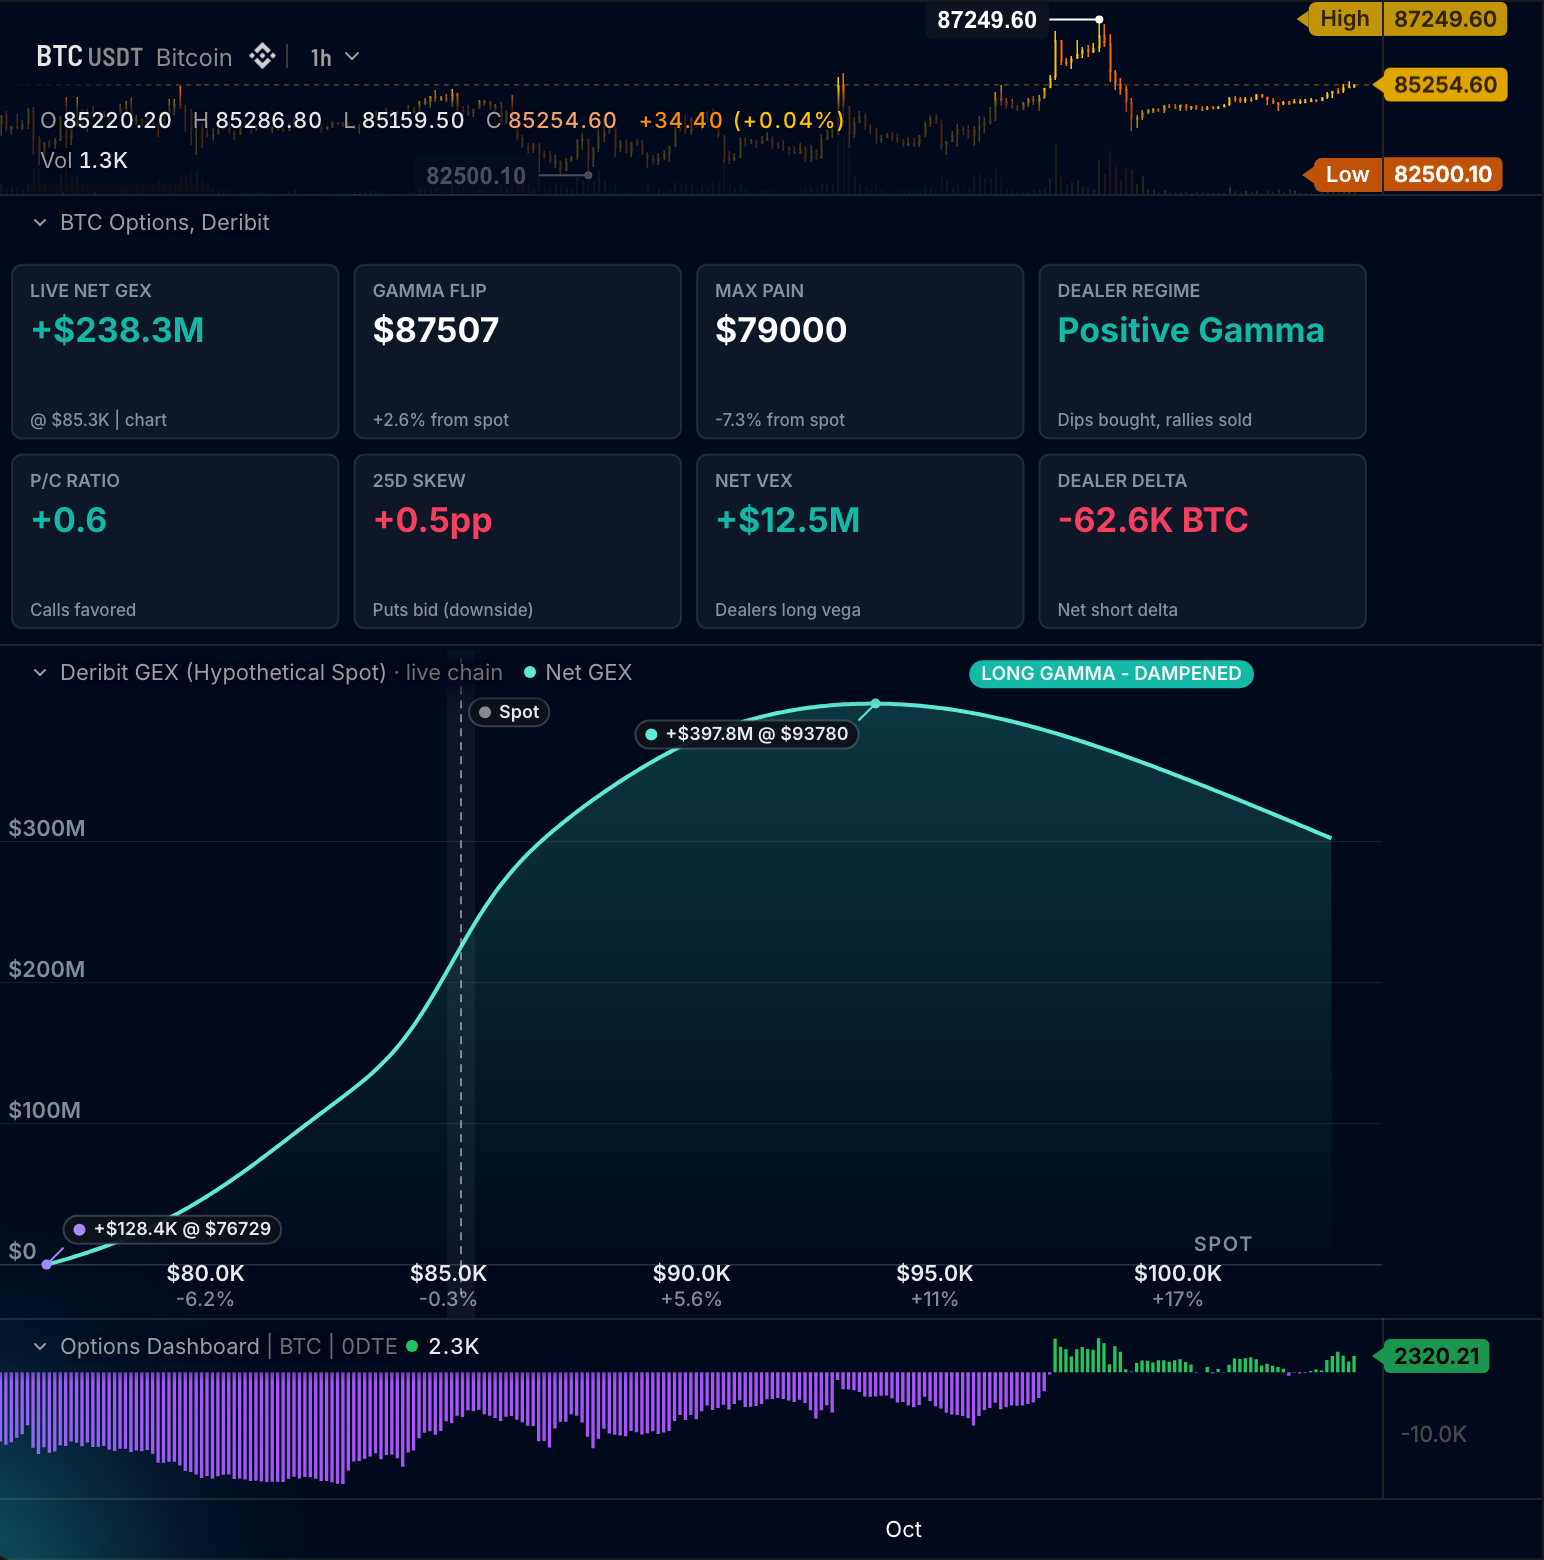
The parts are a celled options_chain.cells input read as a block on the live bar and two sided trades.volume inputs (Data sources), two frames written from the generated frame buffer feeding a panel.tiles and a panel.line placed below the chart (Frames, panels and compact widgets), the OptionsChain kit for the totals, max pain and the ratio (Options kit), a named pane for the histogram (Panes) and a legend entry coloured by a ladder (Styling). It is the right cell of the options desk that Style anything walks through part by part; the Strike Matrix recipe is its left cell. This is also the options-dashboard template: the Options Dashboard card under Beyond the time axis in the editor's starter list, and it compiles as written.
The wrun indicator
// Options Dashboard: eight stat tiles over the chart coin's live options chain (net GEX, the gamma flip, max pain,
// the dealer regime, the put/call ratio, the 25-delta skew, net vega exposure, dealer delta), the net gamma exposure
// curve over a grid of hypothetical spots with a signed fill and marked spot, flip, peak and trough, and a rolling
// cumulative volume delta histogram in a pane of its own. The gamma flip is the curve's own zero crossing (the one
// nearest spot), so the tile, the legend and the curve name one level. The chain is live only: the tiles and the
// curve are rewritten on the last bar; the CVD runs over every bar.
param.int("cvd_bars", 96, { min: 2, max: 500, label: "CVD window, bars", description: "Bars in the rolling CVD window" });
param.number("grid_down", 10, { min: 1, max: 50, label: "Grid below spot, percent", description: "The spot grid's reach below spot, percent" });
param.number("grid_up", 21, { min: 1, max: 50, label: "Grid above spot, percent", description: "The spot grid's reach above spot, percent" });
input("close", ohlcv.close); // spot: the grid's centre and the "spot" marker
input("buy", trades.volume, { side: "BUY", missing: "zero", description: "Aggressive buy volume" });
input("sell", trades.volume, { side: "SELL", missing: "zero", description: "Aggressive sell volume" });
input("chain", options_chain.cells, { max_cells: 4000, venue: "auto", description: "The live options chain of the chart's coin (venue auto: the chart's own market when it lists options, else the coin's Deribit chain)" }); // [strike, expiry_ms, side, oi, gamma, delta, mark_iv, underlying, multiplier, vega] per contract
output("net_gex", none, overlay, { description: "Net gamma exposure at spot, USD per 1% move; live bar only" });
output("gamma_flip", none, overlay, { description: "The spot where the net GEX curve crosses zero, the crossing nearest spot; NaN while the curve keeps one sign across the grid; live bar only" });
output("max_pain", none, overlay, { description: "The strike that pays option holders the least; live bar only" });
output("regime_sign", none, overlay, { description: "0 under negative net gamma, 1 under positive: the legend entry's colour index" });
output("cvd_sign", none, lower, { description: "0 while the rolling CVD is negative, 1 while positive: the histogram's palette index" });
output("cvd", histogram, lower, { pane: "cvd", color_by: "cvd_sign", colors: ["theme.down", "theme.up"], width: 0.7, label: "Agg. Rolling CVD", format: "si", description: "Rolling cumulative volume delta: aggressive buys minus sells over the window" });
pane("cvd", { height_frac: 0.12, format: "si" }); // the Indicator's home pane: it carries the Indicator's name, so no title here
string("regime_text", { max_bytes: 48 }); // the legend entry: "Neg Gamma | flip $85,722"
render.legend("regime_entry", { text: "regime_text", color_by: "regime_sign", colors: ["theme.down", "theme.up"] });
const tileRows = frame("tile_rows", { max_bytes: 4096 });
const gexCurve = frame("curve_rows", { max_bytes: 16384 });
// Eight tiles in two rows of four: the panel prints signed dollars, a tile's own format word or text wins, and the
// accent tints a numeric tile by its sign (the chart's up colour above zero, its down colour below); a tile with its own
// colour keeps it. The tiles, the curve and the CVD pane take 0.55 of the chart, so the candles keep the rest.
panel.tiles({ name: "tiles", title: "Options, Deribit", x: "category", place: "below", frame: tileRows, columns: 4, accent: "auto", positive_color: "theme.up", negative_color: "theme.down", format: "usd", signed: true, hover_card: true, height_frac: 0.18 });
// The gamma curve: a smooth line in the chart's text ink over hypothetical spot, filled in the up colour above zero
// and the down colour below, both axes in dollars; the spot marker, the point callouts (the flip, the peak, the trough)
// and the regime badge chip are written per run into the frame. The one series needs no legend chip: the title names
// it and the hover card reads it.
panel.line({ name: "gex_curve", title: "Deribit GEX (Hypothetical Spot)", x: "number", place: "below", frame: gexCurve, series: [{ name: "Net GEX", color: "theme.text", width: 2 }], chrome: "grid", smooth: true, fill_mode: "signed", fill_positive_color: "theme.up", fill_negative_color: "theme.down", fill_fade: true, x_format: "usd", x_decimals: 1, format: "usd", signed: true, decimals: 0, x_title: "Spot", y_zero: true, legend_style: "none", hover_card: true, height_frac: 0.25, maximize: true, stats_row: true });

const TUPLE = 10; // f64s per contract: strike, expiry_ms, side, oi, gamma, delta, mark_iv, underlying, multiplier, vega
const POINTS = 125; // grid spots
const MAX_EXPIRIES = 64; // distinct live expiries the chain may list
const MAX_CVD = 500; // the ring the rolling CVD reads
const YEAR_MS = 31536000000.0;
const SQRT_TWO_PI = 2.5066282746310002;
const gridSpot = new StaticArray<f64>(POINTS);
const gridGex = new StaticArray<f64>(POINTS);
const expiryMs = new StaticArray<f64>(MAX_EXPIRIES); // the live expiries, sorted ascending
const deltas = new StaticArray<f64>(MAX_CVD); // buy minus sell per bar, the rolling window
let chain = new OptionsChain(1); // the whole chain measured by strike: the totals, max pain, the ratio
let cvdBars = 96; // settings, read in onStart()
let gridDown = 0.1;
let gridUp = 0.21;
let close: f64 = NaN; // this bar
let t: f64 = NaN;
let nowMs: f64 = 0.0; // the chain's clock, read on the live bar
let cvd: f64 = 0.0; // the rolling CVD and its ring
let cvdHead = 0;
let cvdCount = 0;
let haveChain = false; // the live bar measured a chain
let expiryCount = 0;
let netGex: f64 = NaN; // the readings, measured on the live bar
let pain: f64 = NaN;
let pcr: f64 = NaN;
let skewPp: f64 = NaN;
let vex: f64 = NaN;
let dealerDelta: f64 = NaN;
let curveFlip: f64 = NaN; // the gamma flip: the curve's zero crossing nearest spot, interpolated on the grid
let peakIdx = 0;
let troughIdx = 0;

function onStart(): void {
  chain = new OptionsChain(512);
  cvdBars = i32(p_cvd_bars());
  if (cvdBars > MAX_CVD) cvdBars = MAX_CVD;
  gridDown = p_grid_down() / 100.0;
  gridUp = p_grid_up() / 100.0;
}

// ── The expiry list: sorted insertion of a distinct live expiry ──
function noteExpiry(ms: f64): void {
  let lo = 0;
  let hi = expiryCount;
  while (lo < hi) {
    const mid = (lo + hi) >> 1;
    if (expiryMs[mid] < ms) lo = mid + 1;
    else hi = mid;
  }
  if (lo < expiryCount && expiryMs[lo] == ms) return;
  if (expiryCount >= MAX_EXPIRIES) return;
  for (let i = expiryCount; i > lo; i -= 1) expiryMs[i] = expiryMs[i - 1];
  expiryMs[lo] = ms;
  expiryCount += 1;
}

// ── The chain's clock: when its gammas were priced, not the bar's open ──
// The chart prices each contract's gamma by Black-Scholes from its mark IV and underlying at the moment it reads the
// chain, so the contract nearest the money (|delta| nearest 0.5), solved for the time to expiry its gamma implies,
// names that moment. A venue that serves its own greeks gives no such answer: the bar's open stands in.
function chainClockMs(cells: StaticArray<f64>, n: i32, barOpenMs: f64): f64 {
  let best = -1;
  let bestGap = 0.25; // |delta| within 0.25 of 0.5
  let nearest = Infinity; // the nearest listed expiry: the chain lists none that has passed
  for (let i = 0; i + TUPLE - 1 < n; i += TUPLE) {
    if (cells[i + 1] < nearest) nearest = cells[i + 1];
    const gap = Math.abs(Math.abs(cells[i + 5]) - 0.5);
    if (cells[i] > 0.0 && cells[i + 4] > 0.0 && cells[i + 6] > 0.0 && cells[i + 7] > 0.0 && gap < bestGap) {
      bestGap = gap;
      best = i;
    }
  }
  if (best < 0) return barOpenMs;
  const sigma = cells[best + 6] > 3.0 ? cells[best + 6] / 100.0 : cells[best + 6]; // percent a year, or a fraction
  const m = Math.log(cells[best + 7] / cells[best]);
  const q = cells[best + 4] * cells[best + 7]; // gamma times spot = pdf(d1) / u, u = sigma * sqrt(T), d1 = m / u + u / 2
  let lo = Math.sqrt(2.0 * (Math.sqrt(1.0 + m * m) - 1.0)); // where pdf(d1) / u peaks: past it the gamma falls as T grows
  let hi = 10.0;
  for (let k = 0; k < 80; k += 1) { // bisection on the falling side
    const u = 0.5 * (lo + hi);
    const d1 = m / u + 0.5 * u;
    if (Math.exp(-0.5 * d1 * d1) / (2.5066282746310002 * u) > q) lo = u;
    else hi = u;
  }
  const u = 0.5 * (lo + hi);
  const clock = cells[best + 1] - ((u * u) / (sigma * sigma)) * 31536000000.0;
  return clock > barOpenMs - 86400000.0 && clock < nearest ? clock : barOpenMs; // anything else is no reading
}

function bsGamma(spot: f64, strike: f64, sigma: f64, years: f64): f64 { // Black-Scholes gamma, r = 0
  if (!(spot > 0.0) || !(strike > 0.0) || !(sigma > 0.0) || !(years > 0.0)) return 0.0;
  const v = sigma * Math.sqrt(years);
  const d1 = (Math.log(spot / strike) + 0.5 * sigma * sigma * years) / v;
  const pdf = Math.exp(-0.5 * d1 * d1) / SQRT_TWO_PI;
  return pdf / (spot * v);
}

// ── The chain, measured on the live bar: the curve, the skew, the vega and delta exposure, then the kit's totals ──
// Each contract sits on the curve at its own underlying moved with spot (a dated future moves with the coin), priced
// at the chain's clock, so the curve at spot reads the net GEX tile.
function measureChain(n: i32): void { // n = f64 cells in the live block
  const cells = in_chain_view(); // the live chain in place: the first n values of the build's own buffer
  expiryCount = 0;
  for (let i = 0; i + TUPLE - 1 < n; i += TUPLE) if (cells[i + 1] > nowMs) noteExpiry(cells[i + 1]);
  for (let p = 0; p < POINTS; p += 1) {
    gridSpot[p] = close * (1.0 - gridDown + ((gridDown + gridUp) * f64(p)) / f64(POINTS - 1));
    gridGex[p] = 0.0;
  }
  const front = expiryCount > 0 ? expiryMs[0] : NaN;
  let callIv: f64 = NaN; // the 25-delta call and put of the front expiry
  let callGap = Infinity;
  let putIv: f64 = NaN;
  let putGap = Infinity;
  vex = 0.0;
  dealerDelta = 0.0;
  let contracts = 0;
  for (let i = 0; i + TUPLE - 1 < n; i += TUPLE) {
    const strike = cells[i];
    const expiry = cells[i + 1];
    const side = cells[i + 2];
    const oi = cells[i + 3];
    const delta = cells[i + 5];
    let iv = cells[i + 6];
    const multiplier = cells[i + 8] > 0.0 ? cells[i + 8] : 1.0;
    const vega = cells[i + 9];
    if (!(strike > 0.0) || !(oi > 0.0) || !(expiry > nowMs)) continue;
    if (iv > 3.0) iv = iv / 100.0; // a percent iv (55.3) read as a fraction
    const sign = side > 0.0 ? 1.0 : -1.0;
    if (isFinite(vega)) vex += sign * vega * oi * multiplier; // USD per vol point, the dealer-naive sign
    if (isFinite(delta)) dealerDelta -= delta * oi * multiplier; // dealers hold the other side of the open interest
    if (expiry == front && iv > 0.0 && isFinite(delta)) {
      if (side > 0.0) {
        const gap = Math.abs(delta - 0.25);
        if (gap < callGap) {
          callGap = gap;
          callIv = iv;
        }
      } else {
        const gap = Math.abs(delta + 0.25);
        if (gap < putGap) {
          putGap = gap;
          putIv = iv;
        }
      }
    }
    if (!(iv > 0.0)) continue;
    const years = (expiry - nowMs) / YEAR_MS;
    const basis = cells[i + 7] > 0.0 ? cells[i + 7] / close : 1.0; // the contract's underlying over the chart's spot
    for (let p = 0; p < POINTS; p += 1) {
      const s = gridSpot[p] * basis;
      gridGex[p] += sign * bsGamma(s, strike, iv, years) * oi * multiplier * s * s * 0.01;
    }
    contracts += 1;
  }
  haveChain = contracts > 0;
  skewPp = isNaN(callIv) || isNaN(putIv) ? NaN : (putIv - callIv) * 100.0;
  curveFlip = NaN;
  peakIdx = 0;
  troughIdx = 0;
  for (let p = 1; p < POINTS; p += 1) {
    if (gridGex[p] > gridGex[peakIdx]) peakIdx = p;
    if (gridGex[p] < gridGex[troughIdx]) troughIdx = p;
    const a = gridGex[p - 1];
    const b = gridGex[p];
    if ((a < 0.0 && b > 0.0) || (a > 0.0 && b < 0.0)) { // a zero crossing; the one nearest spot is the flip
      const x = gridSpot[p - 1] + (gridSpot[p] - gridSpot[p - 1]) * (a / (a - b));
      if (isNaN(curveFlip) || Math.abs(x - close) < Math.abs(curveFlip - close)) curveFlip = x;
    }
  }
  chain.load(in_chain_view(), n, nowMs, close, 0, 0.0); // every live expiry, every strike
  netGex = chain.totalNetGex();
  pain = chain.maxPain();
  pcr = chain.putCallRatio();
}

// ── Text and frames, built without allocating ──
function fbUsd(v: f64): void { // "+$34.7M", "-$42.0M", "+$1.23B"
  if (!isFinite(v)) {
    fb_text("n/a");
    return;
  }
  fb_text(v < 0.0 ? "-$" : "+$");
  const a = Math.abs(v);
  if (a >= 1.0e9) {
    fb_f64(a / 1.0e9, 2);
    fb_text("B");
  } else if (a >= 1.0e6) {
    fb_f64(a / 1.0e6, 1);
    fb_text("M");
  } else if (a >= 1.0e3) {
    fb_f64(a / 1.0e3, 1);
    fb_text("K");
  } else fb_f64(a, 0);
}
function fbPctFromSpot(price: f64): void { // "+1.4% from spot"
  const pct = (price / close - 1.0) * 100.0;
  if (pct >= 0.0) fb_text("+");
  fb_f64(pct, 1);
  fb_text("% from spot");
}
function fbTone(v: f64): void { // the colour word of a signed reading
  fb_text(v < 0.0 ? "\"theme.down\"" : "\"theme.up\"");
}
function priceDecimals(v: f64): i32 { // decimals follow the price's size, so the tiles read on any coin: $87,526, $150.25, $0.4213
  return v >= 1000.0 ? 0 : v >= 1.0 ? 2 : 4;
}
function fbGrouped(n: i64): void { // 85979 -> 85,979
  if (n >= 1000) {
    fbGrouped(n / 1000);
    fb_text(",");
    const r = n % 1000;
    if (r < 100) fb_text("0");
    if (r < 10) fb_text("0");
    fb_int(r);
  } else fb_int(n);
}
function fbPrice(v: f64): void { // "$85,979", "$150.25", "$0.4213"
  fb_text("$");
  if (v >= 1000.0) fbGrouped(i64(Math.round(v)));
  else fb_f64(v, priceDecimals(v));
}
function fbPct(v: f64): void { // 10 -> "10", 12.5 -> "12.5"
  fb_f64(v, v == Math.floor(v) ? 0 : 1);
}
function writeTiles(): void { // [label, value, caption, color, spark, format], null to skip an element
  fb_clear();
  fb_text("{\"rows\":[");
  fb_text("[\"Live net GEX\",");
  fb_f64(netGex, 0);
  fb_text(",\"@ $");
  if (close >= 1000.0) {
    fb_f64(close / 1000.0, 1);
    fb_text("K");
  } else fb_f64(close, priceDecimals(close));
  fb_text(" | chart\",null,null,\"usd\"]");
  if (isNaN(curveFlip)) { // the curve keeps one sign across the grid: no flip to name
    fb_text(gridGex[0] < 0.0 ? ",[\"Gamma flip\",\"No flip in range\",\"Negative from -" : ",[\"Gamma flip\",\"No flip in range\",\"Positive from -");
    fbPct(gridDown * 100.0);
    fb_text("% to +");
    fbPct(gridUp * 100.0);
    fb_text("%\",\"theme.text\"]");
  } else {
    fb_text(",[\"Gamma flip\",\"");
    fbPrice(curveFlip);
    fb_text("\",\"");
    fbPctFromSpot(curveFlip);
    fb_text("\",\"theme.text\"]");
  }
  fb_text(",[\"Max pain\",\"");
  fbPrice(pain);
  fb_text("\",\"");
  fbPctFromSpot(pain);
  fb_text("\",\"theme.text\"]");
  fb_text(netGex < 0.0 ? ",[\"Dealer regime\",\"Negative Gamma\",\"Dips sold, rallies bought\",\"theme.down\"]" : ",[\"Dealer regime\",\"Positive Gamma\",\"Dips bought, rallies sold\",\"theme.up\"]");
  fb_text(",[\"P/C ratio\",\""); // a ratio, so text: two decimals and no sign
  if (isFinite(pcr)) fb_f64(pcr, 2);
  else fb_text("n/a");
  fb_text(pcr > 1.0 ? "\",\"Puts favored\",\"theme.down\"]" : "\",\"Calls favored\",\"theme.up\"]");
  fb_text(",[\"25D skew\",\"");
  if (isFinite(skewPp)) {
    if (skewPp >= 0.0) fb_text("+");
    fb_f64(skewPp, 1);
    fb_text("pp");
  } else fb_text("n/a");
  fb_text(skewPp > 0.0 ? "\",\"Puts bid (downside)\"," : "\",\"Calls bid (upside)\",");
  fbTone(skewPp > 0.0 ? -1.0 : 1.0);
  fb_text("]");
  fb_text(",[\"Net VEX\",");
  fb_f64(vex, 0);
  fb_text(vex >= 0.0 ? ",\"Dealers long vega\",null,null,\"usd\"]" : ",\"Dealers short vega\",null,null,\"usd\"]");
  fb_text(",[\"Dealer delta\",\""); // in the chart's coin (the chain's open interest is in coin units); the module has no name for the coin, so the caption says "in coins"
  if (isFinite(dealerDelta)) {
    const a = Math.abs(dealerDelta);
    if (dealerDelta < 0.0) fb_text("-");
    if (a >= 1000.0) {
      fb_f64(a / 1000.0, 1);
      fb_text("K");
    } else fb_f64(a, 0);
  } else fb_text("n/a");
  fb_text(dealerDelta < 0.0 ? "\",\"Net short delta, in coins\"," : "\",\"Net long delta, in coins\",");
  fbTone(dealerDelta);
  fb_text("]");
  fb_text("]}");
  writeFrameBuffer(tileRows);
}
function fbMarker(idx: i32, color: string): void { // a point callout pinned on the curve: "<usd> @ $<spot>" with a leader and a dot
  fb_text(",{\"x\":");
  fb_f64(gridSpot[idx], 1);
  fb_text(",\"valign\":\"point\",\"series\":\"Net GEX\",\"label\":\"");
  fbUsd(gridGex[idx]);
  fb_text(" @ $");
  fb_f64(gridSpot[idx], priceDecimals(gridSpot[idx]));
  fb_text("\",\"color\":\"");
  fb_text(color);
  fb_text("\",\"badge\":true}");
}
function writeCurve(): void {
  fb_clear();
  fb_text("{\"rows\":[");
  for (let p = 0; p < POINTS; p += 1) {
    if (p > 0) fb_text(",");
    fb_text("[");
    fb_f64(gridSpot[p], 1);
    fb_text(",");
    fb_f64(gridGex[p], 0);
    fb_text("]");
  }
  fb_text("],\"markers\":[{\"x\":\"spot\",\"label\":\"Spot\",\"badge\":true,\"wash\":true}");
  if (!isNaN(curveFlip)) { // the flip as a point callout on the curve (its value is zero there), the x reading in the pill
    fb_text(",{\"x\":");
    fb_f64(curveFlip, 1);
    fb_text(",\"valign\":\"point\",\"series\":\"Net GEX\",\"label\":\"Gamma flip\",\"color\":\"theme.text\",\"badge\":true,\"show_value\":true}");
  }
  fbMarker(peakIdx, "theme.up");
  fbMarker(troughIdx, "theme.down");
  fb_text("],\"caption\":\"live chain\",\"badge\":");
  fb_text(netGex < 0.0 ? "{\"text\":\"SHORT GAMMA - AMPLIFIED\",\"color\":\"theme.down\"}" : "{\"text\":\"LONG GAMMA - DAMPENED\",\"color\":\"theme.up\"}"); // short gamma in the chart's down colour, long gamma in its up colour
  fb_text("}");
  writeFrameBuffer(gexCurve);
}
function sbGrouped(n: i64): void { // 85979 -> 85,979
  if (n >= 1000) {
    sbGrouped(n / 1000);
    sb_text(",");
    const r = n % 1000;
    if (r < 100) sb_text("0");
    if (r < 10) sb_text("0");
    sb_int(r);
  } else sb_int(n);
}
function writeLegendText(): void {
  sb_clear();
  sb_text(netGex < 0.0 ? "Neg Gamma | " : "Pos Gamma | ");
  if (isNaN(curveFlip)) sb_text("no flip in range");
  else {
    sb_text("flip $");
    if (curveFlip >= 1000.0) sbGrouped(i64(Math.round(curveFlip)));
    else sb_f64(curveFlip, priceDecimals(curveFlip));
  }
  str_regime_text_sb();
}

// onBar() runs once per bar: the rolling CVD on every bar; the live bar measures the chain and writes the tiles,
// the curve and the legend entry.
function onBar(): void {
  t = bar.time();
  close = bar.close();
  // The rolling CVD: this bar's delta joins the ring, the bar that falls out of the window leaves it.
  const d = in_buy() - in_sell();
  if (cvdCount == cvdBars) cvd -= deltas[cvdHead];
  else cvdCount += 1;
  deltas[cvdHead] = d;
  cvdHead = (cvdHead + 1) % cvdBars;
  cvd += d;
  out_cvd(cvd);
  out_cvd_sign(cvd >= 0.0 ? 1.0 : 0.0);
  haveChain = false;
  if (bar.isLast() && !isNaN(close) && !isNaN(t)) {
    const n = in_chain_cells();
    if (n >= TUPLE) {
      nowMs = chainClockMs(in_chain_view(), n, t * 1000.0);
      measureChain(n);
    }
  }
  out_net_gex(haveChain ? netGex : NaN);
  out_gamma_flip(haveChain ? curveFlip : NaN);
  out_max_pain(haveChain ? pain : NaN);
  out_regime_sign(haveChain ? (netGex < 0.0 ? 0.0 : 1.0) : NaN);
  if (haveChain) {
    writeLegendText();
    writeTiles();
    writeCurve();
  }
}
How it works
The chain is live only. input("chain", options_chain.cells, { max_cells: 4000, venue: "auto" }) delivers the chart coin's listed contracts as [strike, expiry_ms, side, oi, gamma, delta, mark_iv, underlying, multiplier, vega] tuples on the live row (a BTC chain is about 1,550); history bars carry an empty block and cost one read, so the tiles and the curve are measured on the last bar and rewritten as the chain moves. venue: "auto" reads the chart's own market when it lists options, else the coin's Deribit chain.
The curve. A grid of 125 hypothetical spots runs from grid_down (10) percent below spot to grid_up (21) percent above it. Each live contract with an implied volatility sits on the curve at its own underlying moved with spot (a dated future moves with the coin: the underlying times the grid spot over the chart's spot), and Black-Scholes gamma there (rate zero, the time to expiry in years) times open interest, the multiplier and that underlying squared times 0.01 is added to the grid spot's reading, calls positive and puts negative; an implied volatility above 3 is read as a percent. The time to expiry runs from the chain's clock, the moment the chart priced the chain, never the bar's open: chainClockMs() solves the gamma of the contract whose delta sits nearest 0.5 for the time to expiry it implies, and a venue that serves its own greeks gives no answer, so the bar's open stands in there. At spot the curve therefore reads the live net GEX tile. The pass also finds the peak and the trough of the curve and interpolates its zero crossings; the one nearest spot is the gamma flip, the level the tile, the legend entry, the gamma_flip output and the flip callout all read. Then the whole chain goes through the OptionsChain kit: totalNetGex() for the live net GEX tile, maxPain() for max pain and putCallRatio() for the ratio.
The other tiles. The 25-delta skew is the front expiry's put implied volatility nearest delta minus 0.25, less its call implied volatility nearest 0.25, in volatility points; net VEX sums vega times open interest times the multiplier with the dealer-naive sign; dealer delta sums minus delta times open interest times the multiplier, since dealers hold the other side of the open interest; it reads in the chart's coin (the chain's open interest is in coin units), and because the module has no name for the coin its caption says in coins instead of naming one. The tiles frame is { rows: [[label, value, caption, color, spark, format], ...] }, null skipping an element: a number prints through the panel's format: "usd" with signed: true unless the row carries its own format word, a text value prints as written ($85,722, 0.56 for the ratio, +1.4pp; prices carry thousands separators and their decimals follow the coin's price size; with no zero crossing the gamma flip tile reads No flip in range over the grid's reach, Positive from -10% to +21%), and accent: "auto" tints a numeric tile by its sign, positive_color: "theme.up" or negative_color: "theme.down", while a row with its own colour keeps it.
The curve frame. { rows: [[spot, gex], ...], markers, caption, badge }: the rows are the grid, markers carry the Spot marker (x: "spot", with a wash), the flip as a point callout (valign: "point" and series: "Net GEX" pin it on the line, show_value prints the spot in its pill) and the peak and trough callouts with their readings, and badge is the regime chip on the title row. panel.line draws it with x: "number" over the spot grid (x_format: "usd"), smooth on the line (its series colour theme.text, the chart's text ink), fill_mode: "signed" with fill_positive_color: "theme.up", fill_negative_color: "theme.down" and fill_fade, y_zero so the zero line always shows, legend_style: "none" (the one series needs no chip: the title names it and the hover card reads it), a stats_row, hover_card and maximize; height_frac: 0.25 gives it the larger share of the space below the chart, the tiles 0.18, so with the CVD pane's 0.12 the three take 0.55 of the chart and the candles keep the rest.
The CVD pane. Each bar's aggressive buy volume minus its sell volume joins a ring of cvd_bars (96) deltas and the bar that falls out of the window leaves it; the sum is the cvd histogram. output("cvd", histogram, lower, { pane: "cvd", color_by: "cvd_sign", colors }) colours each bar from the cvd_sign ladder, theme.down while the sum is negative and theme.up while positive, and pane("cvd", { height_frac: 0.12, format: "si" }) sizes the pane and formats its axis; the pane carries the indicator's name, so it declares no title.
The legend entry. render.legend("regime_entry", { text: "regime_text", color_by: "regime_sign", colors }) reads the string slot written on the live bar (Neg Gamma | flip $85,722, or Pos Gamma | no flip in range) and colours it from the regime ladder.
Where it runs
Charts of a coin Deribit lists options for (BTC, ETH, SOL and the rest of its list), on any venue: Binance Futures BTCUSDT, Binance spot ETHUSDT and so on. The chart serves the newest chain on the live bar only, every history bar an empty block, and refreshes it with a snapshot about every 30 seconds; the sided trades behind the CVD are the chart market's own. Run it beside the Strike Matrix on a second chart cell for the whole desk, and on a short timeframe drag that cell's price axis to zoom it out and see more strikes. A CME futures chart has its own chain, but the editor's Run is paused on CME markets and a community indicator cannot read CME data; OpenMarket's official wrun indicators can.
When data is missing
Other markets are refused by name before any fetch, naming the input and the way out: Input 'chain' reads options_chain cells, but the chart market HYPERLIQUID_FUTURES/PURR has no option chain (wrun_options_chain_unavailable): coin 'PURR' is not listed on Deribit and the market is not an options venue; open a CME futures chart or a chart of a coin Deribit lists (BTC, ETH, SOL, ...). While the chain has not arrived yet the tiles and the curve are empty and the CVD pane runs on its own; a bar without sided trades reads zero into the CVD (missing: "zero" on both volume inputs); a reading the chain cannot give prints n/a in its tile, and a curve with no zero crossing gets no flip callout, its tile reads No flip in range and gamma_flip reads NaN.
Customize it
- A wider or narrower grid.
grid_downandgrid_uptake 1 to 50 percent each side of spot; the curve's zero crossing has to fall inside the grid for the flip to show, so widengrid_downwhen the tile readsNo flip in range. - A longer CVD window.
cvd_barsup to 500. - Fewer tiles. Delete a row in
writeTiles()and setcolumnsonpanel.tilesto the new row length; the panel lays the rest out. - Pin the venue. Change
venue: "auto"to"deribit"and Run again to read the coin's Deribit chain even where the chart's market lists options of its own;"cme"reads a CME futures chart's chain. - The look. The badge's words and colours are written into the frame in
writeCurve(), and every colour on the desk is a theme word (theme.up,theme.down,theme.text) in the twopanel.*declarations, the ladders and the frames, so it follows the chart's theme; a hex word in any of those places fixes a colour instead (Style anything).
Run it
- In the editor's Explorer, press the Templates icon ("Browse starter templates") and pick Options Dashboard under Beyond the time axis.
- Press Run on a BTC or ETH chart: the tiles and the curve appear below the chart once the chain arrives, the CVD pane at the bottom from the first bar.
- Hover a tile or the curve for its card; at the editor's Console prompt, type
net_gexto read live net GEX, orlast 20 cvdfor the rolling delta over the last 20 bars.
Concepts used
- Data sources for the
options_chaincelled class, its tuple, thevenueword and sidedtrades.volume - Frames, panels and compact widgets for
panel.tiles,panel.line, the panel frames, markers and the badge - Panes for a named pane, its height and its format
- Styling for
color_byladders on an output and a legend entry - Options kit for
OptionsChain, the totals, max pain and the ratio - Style anything for the whole desk, part by part