
This page documents every option in the Volume Footprint settings dialog, tab by tab: General, Profile, Imbalance, Color, and Advanced. To open the dialog, click the gear on the Volume Footprint legend row, or double-click the footprint itself. Changes apply to the chart immediately, so keep it visible while you tune.
General
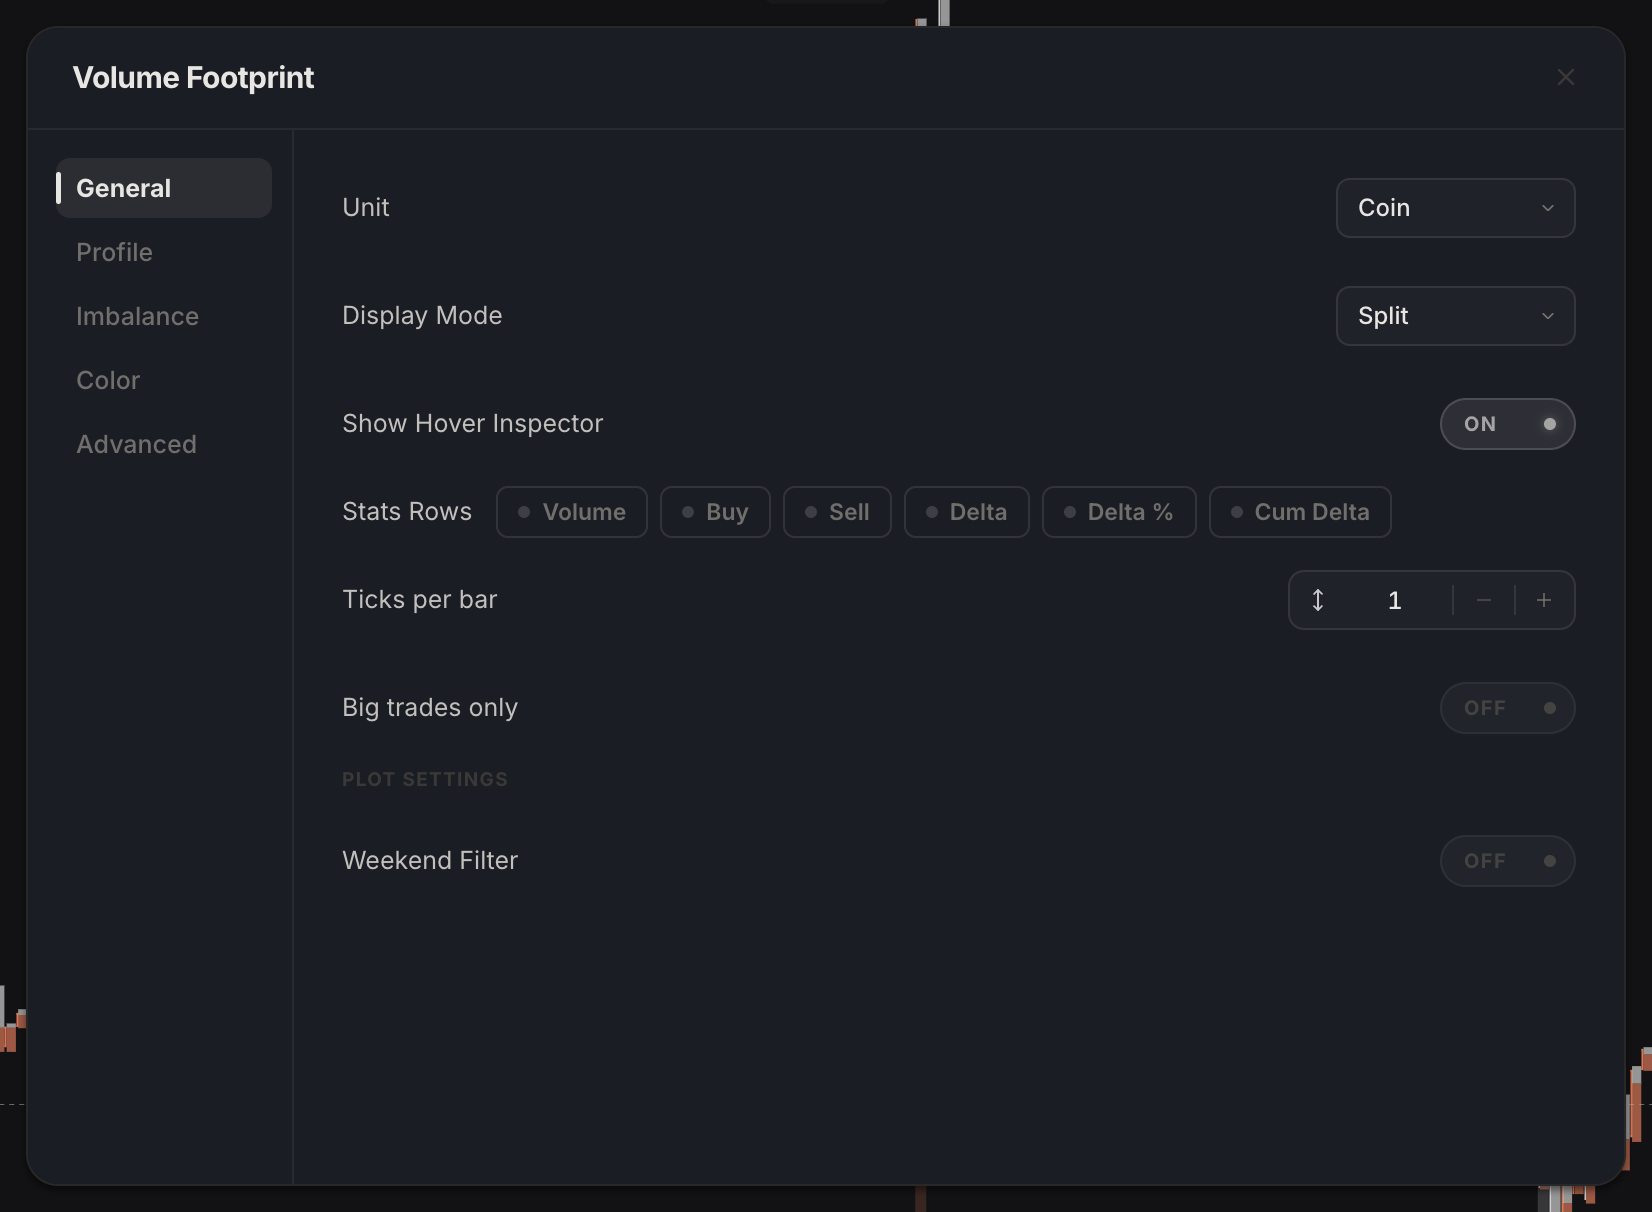
The General tab controls the footprint's overall shape: what unit the numbers use, which display mode draws the candles, how tall each price row is, the per-candle stats rows, and an optional big-trades filter. The Plot Settings section at the bottom holds chart-level options that follow the symbol (such as Hide weekends), not the footprint.
| Setting | What it does | Default |
|---|---|---|
| Exchanges | Appears on the Aggregated Volume Footprint variant only: picks which exchanges' volume gets combined into one footprint. | A supported set of exchanges for your coin, chosen when you add it |
| Unit | Shows traded amounts in quote currency (USD) or in units of the asset itself (Coin). | Coin |
| Display Mode | Picks how each candle's order flow is drawn. The six modes are described below the table. | Split |
| Show Hover Inspector | Shows a compact tooltip with a cell's exact numbers when you hover it. | On |
| Stats Rows | Pins summary rows to every candle. Toggle each badge separately: Volume, Buy, Sell, Delta (buy volume minus sell volume), Delta % and Cum Delta (the running delta total across candles). | All off |
| Stats Position | Places the stats rows above the candles (Top) or under them (Bottom). Shown when at least one stats row is on. | Bottom |
| Stats Labels | Draws the labeled summary card behind the stats rows; turned off, you get bare colored numbers instead. Shown when at least one stats row is on. | On |
| Ticks per bar | How many price ticks (the market's minimum price steps) merge into one footprint row, from 1 to 500. Bigger values mean taller rows and fewer levels, and the value is remembered per interval so your 1m and 1h charts keep separate settings. | Varies by interval (1 on 1m, 15 on 1h, 50 on 1d) |
| Big trades only | Hides cells whose total volume is below the Min cell volume threshold, so block activity stands out in any display mode. | Off |
| Min cell volume | The size a cell must trade to survive the Big trades only filter; smaller cells are dropped before drawing. Shown when Big trades only is on. | 0 |
| Threshold unit | Whether Min cell volume is measured in Notional (USD) value or the asset's Native quantity. Shown when Big trades only is on. | Notional (USD) |
| Cluster Cell Metric | In cluster grid modes, picks what shades each cell: total Volume or net Delta. Shown when Display Mode is Cluster, Imbalance Only, or Ladder. | Delta |
| Render Profile | In cluster grid modes, adds a volume histogram behind the rows: Total (one bar per price), Split (buy and sell bars), or Delta (net bar). Shown when Display Mode is Cluster, Imbalance Only, or Ladder. | Off |
The six display modes:
- Split: sell and buy volume as side-by-side bars at every price level, the classic bid/ask footprint.
- Delta: one bar per price level, colored by which side won there (net delta).
- Total: one bar per price level showing combined volume, sides merged.
- Cluster: a grid of shaded cells with the numbers printed inside; shading follows the Cluster Cell Metric.
- Imbalance Only: only imbalance-flagged cells keep their numbers and colors, everything else is dimmed.
- Ladder: both buy and sell numbers stay visible, but only each row's dominant side is colored; ties stay neutral. The POC row (the price with the most traded volume) remains highlighted.
Profile
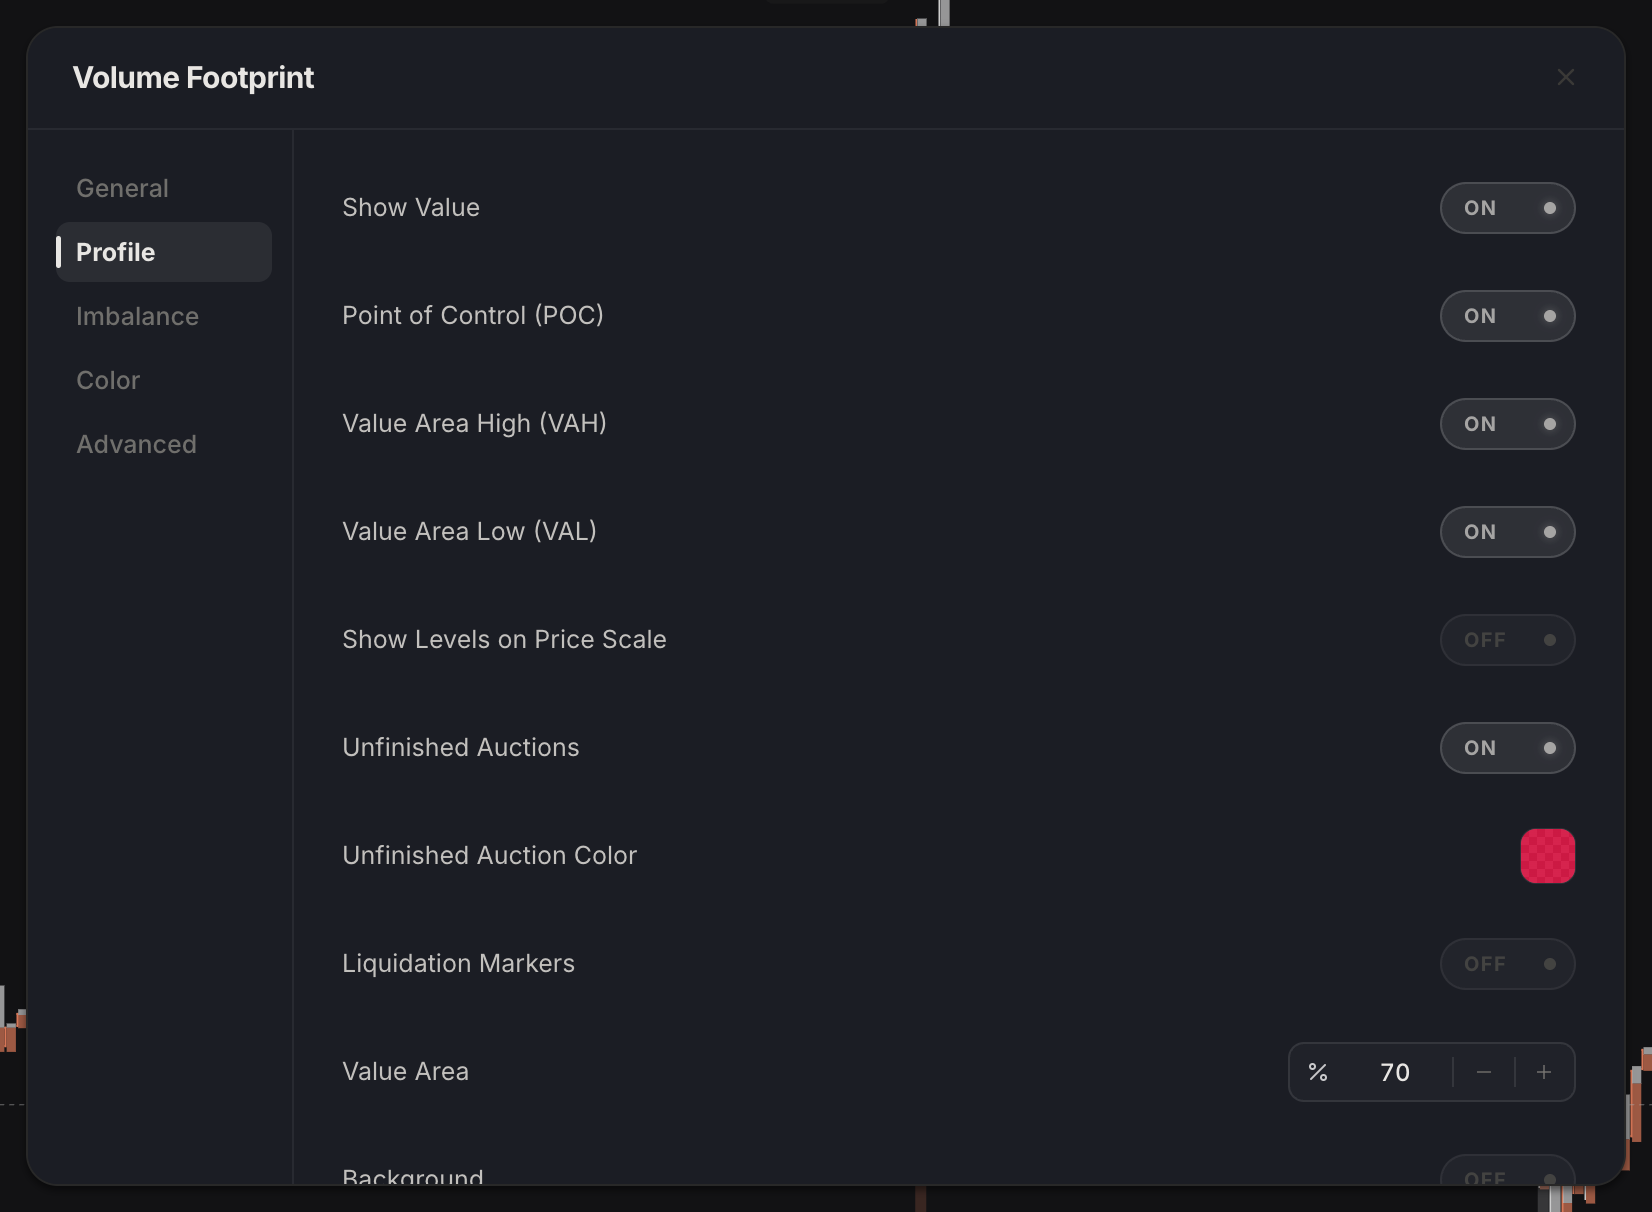
The Profile tab controls the market-profile layer drawn over the footprint: the POC (the price with the most traded volume), the value area lines, unfinished auctions, and liquidation markers.
| Setting | What it does | Default |
|---|---|---|
| Show Value | Prints the traded numbers inside cells when there is room. Off keeps the colored cells but hides the numbers. | On |
| Point of Control (POC) | Marks each candle's POC, the price level where the most volume traded. | On |
| POC Thickness | How thick the POC line draws (minimum 1). Shown when Point of Control (POC) is on. | 1 |
| POC Outline | Outlines the POC row's cell so the heaviest price stands out even in dense grids. Shown when Point of Control (POC) is on. | On |
| POC Naked Extension | Extends each POC to the right until price trades back through it, keeping untested ("naked") POCs on your chart as live levels. Shown when Point of Control (POC) is on. | Off |
| Value Area High (VAH) | Draws the VAH line, the top of the value area (the price band that holds the bulk of the candle's volume). | On |
| Value Area Low (VAL) | Draws the VAL line, the bottom of the value area. | On |
| Value Area | What percentage of a candle's total volume the value area should contain, from 1 to 100. Shown while the value area itself is enabled (on by default). | 70 |
| Show Levels on Price Scale | Pins POC, VAH, VAL, and naked POC markers as pills in the price-axis gutter, so you can read the exact prices without tracing lines. | Off |
| Unfinished Auctions | Flags candle extremes where both buyers and sellers were still trading when price turned, meaning the auction never finished. These levels are often read as likely to be revisited. | On |
| Unfinished Auction Color | The color used for unfinished auction marks. Shown when Unfinished Auctions is on. | Your Sell color |
| Liquidation Markers | Draws live liquidation events (forced position closes) on the footprint as they happen. | Off |
| Min Notional | Hides liquidations smaller than this notional value (size times price), stepping in thousands. Shown when Liquidation Markers is on. | 0 |
| Max Markers | Caps how many liquidation markers stay on the chart at once (minimum 1). Shown when Liquidation Markers is on. | 200 |
| Background | Fills the vertical span behind each footprint column with a tint, so the grid stands out from the chart behind it. | Off |
| Show Total Profile | Draws one extra combined volume profile built from the loaded candles together, in addition to the per-candle footprints. | Off |
Imbalance
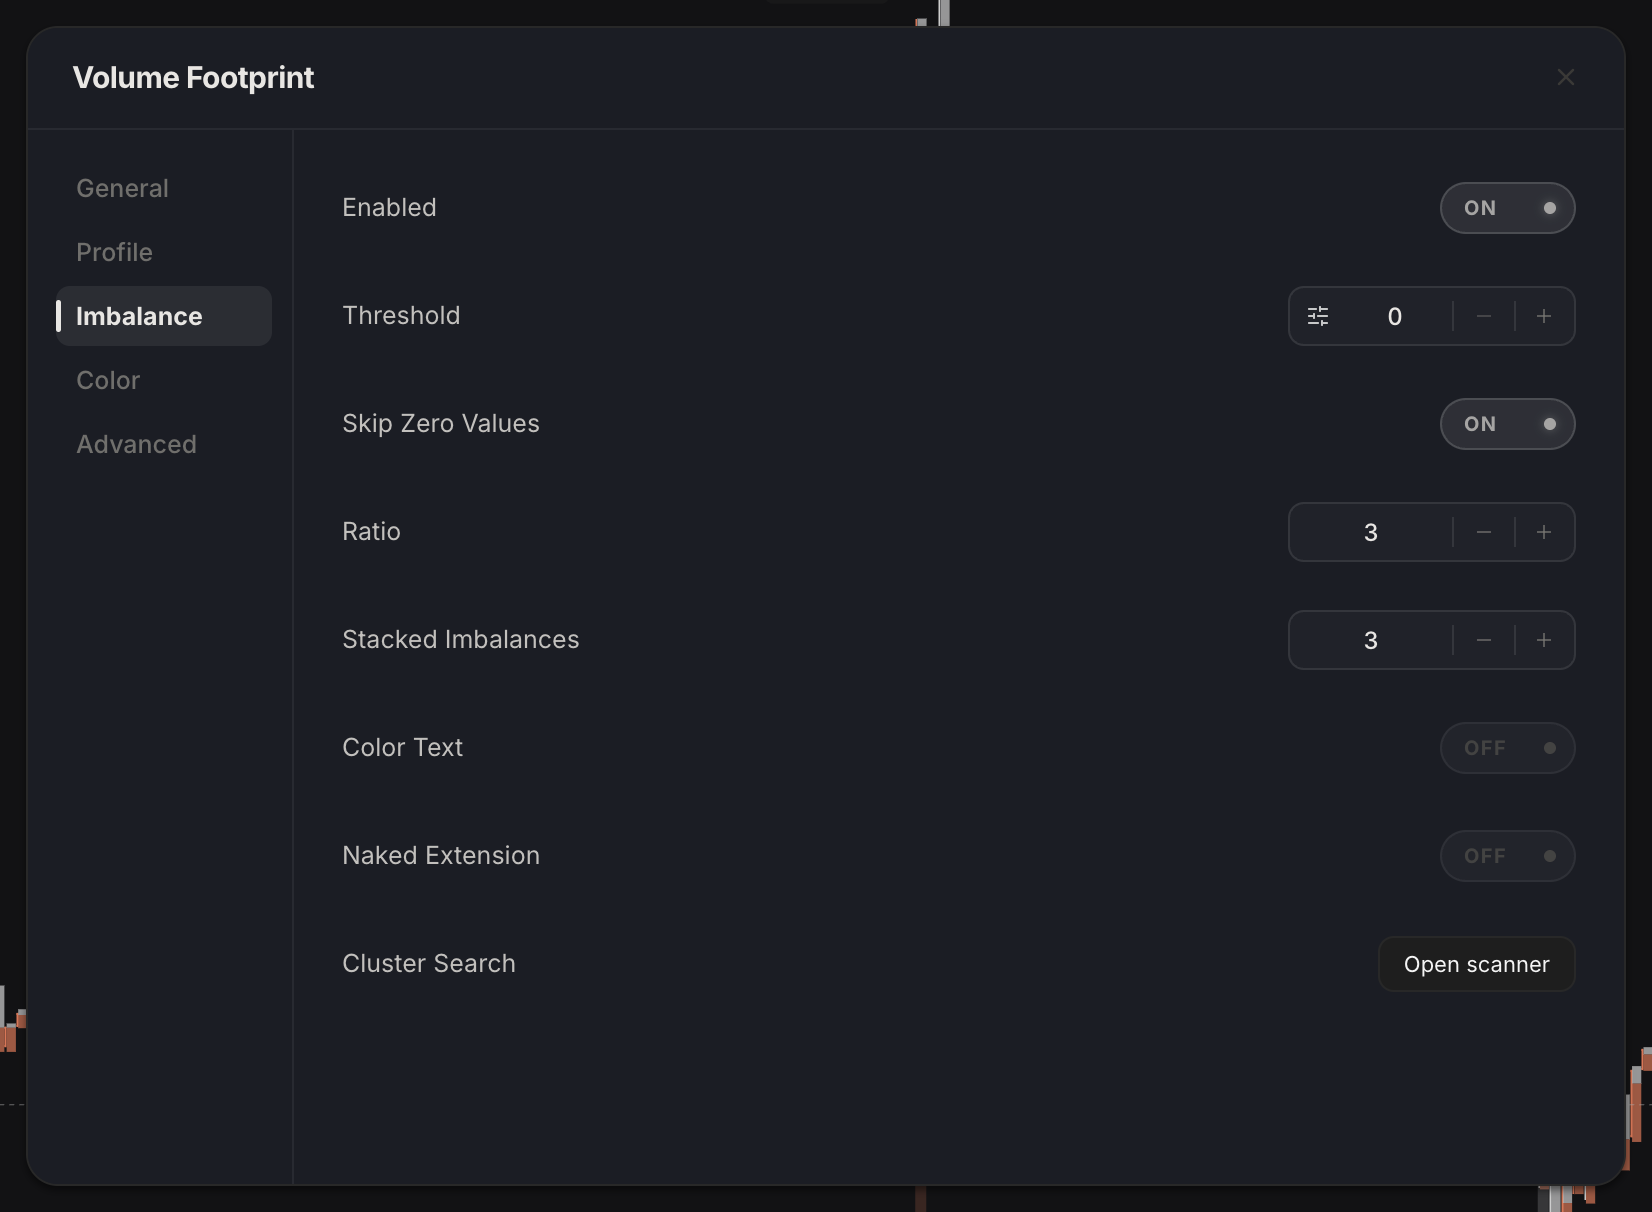
The Imbalance tab configures imbalance detection: flagging price levels where one side traded several times more than the other. The comparison is diagonal, buy volume at one price against sell volume one level away, which is how aggressive orders actually consume the book.
| Setting | What it does | Default |
|---|---|---|
| Enabled | Turns imbalance detection on. Flagged cells get highlighted in the Buy Imbalance and Sell Imbalance colors from the Color tab. | Off |
| Threshold | Fades cells that traded less than this amount so small prints stop drawing attention; the further below the threshold, the dimmer the cell. 0 turns the fade off. | 0 |
| Skip Zero Values | Ignores comparisons where the opposite diagonal cell traded nothing. Turn it off and any print against an empty cell counts as an imbalance. Shown when detection is active (Enabled on, or Display Mode set to Imbalance Only). | On |
| Ratio | How many times bigger one side must be than its diagonal counterpart to get flagged: 3 means buys must be at least 3 times the diagonally opposite sells, or vice versa (minimum 1). Shown when detection is active (Enabled on, or Display Mode set to Imbalance Only). | 3 |
| Stacked Imbalances | How many consecutive flagged levels on the same side it takes to draw a stacked imbalance zone, a shaded band marking a run of one-sided prints. Zones need a value of at least 2. Shown when detection is active (Enabled on, or Display Mode set to Imbalance Only). | 3 |
| Color Text | Also paints the numbers inside flagged cells with the imbalance colors, not just the cell highlight. Shown when Enabled is on. | Off |
| Naked Extension | Extends stacked imbalance zones to the right until price trades back through them, keeping untested zones alive as support and resistance candidates. Works together with Stacked Imbalances (2 or more). Shown when Enabled is on. | Off |
Color
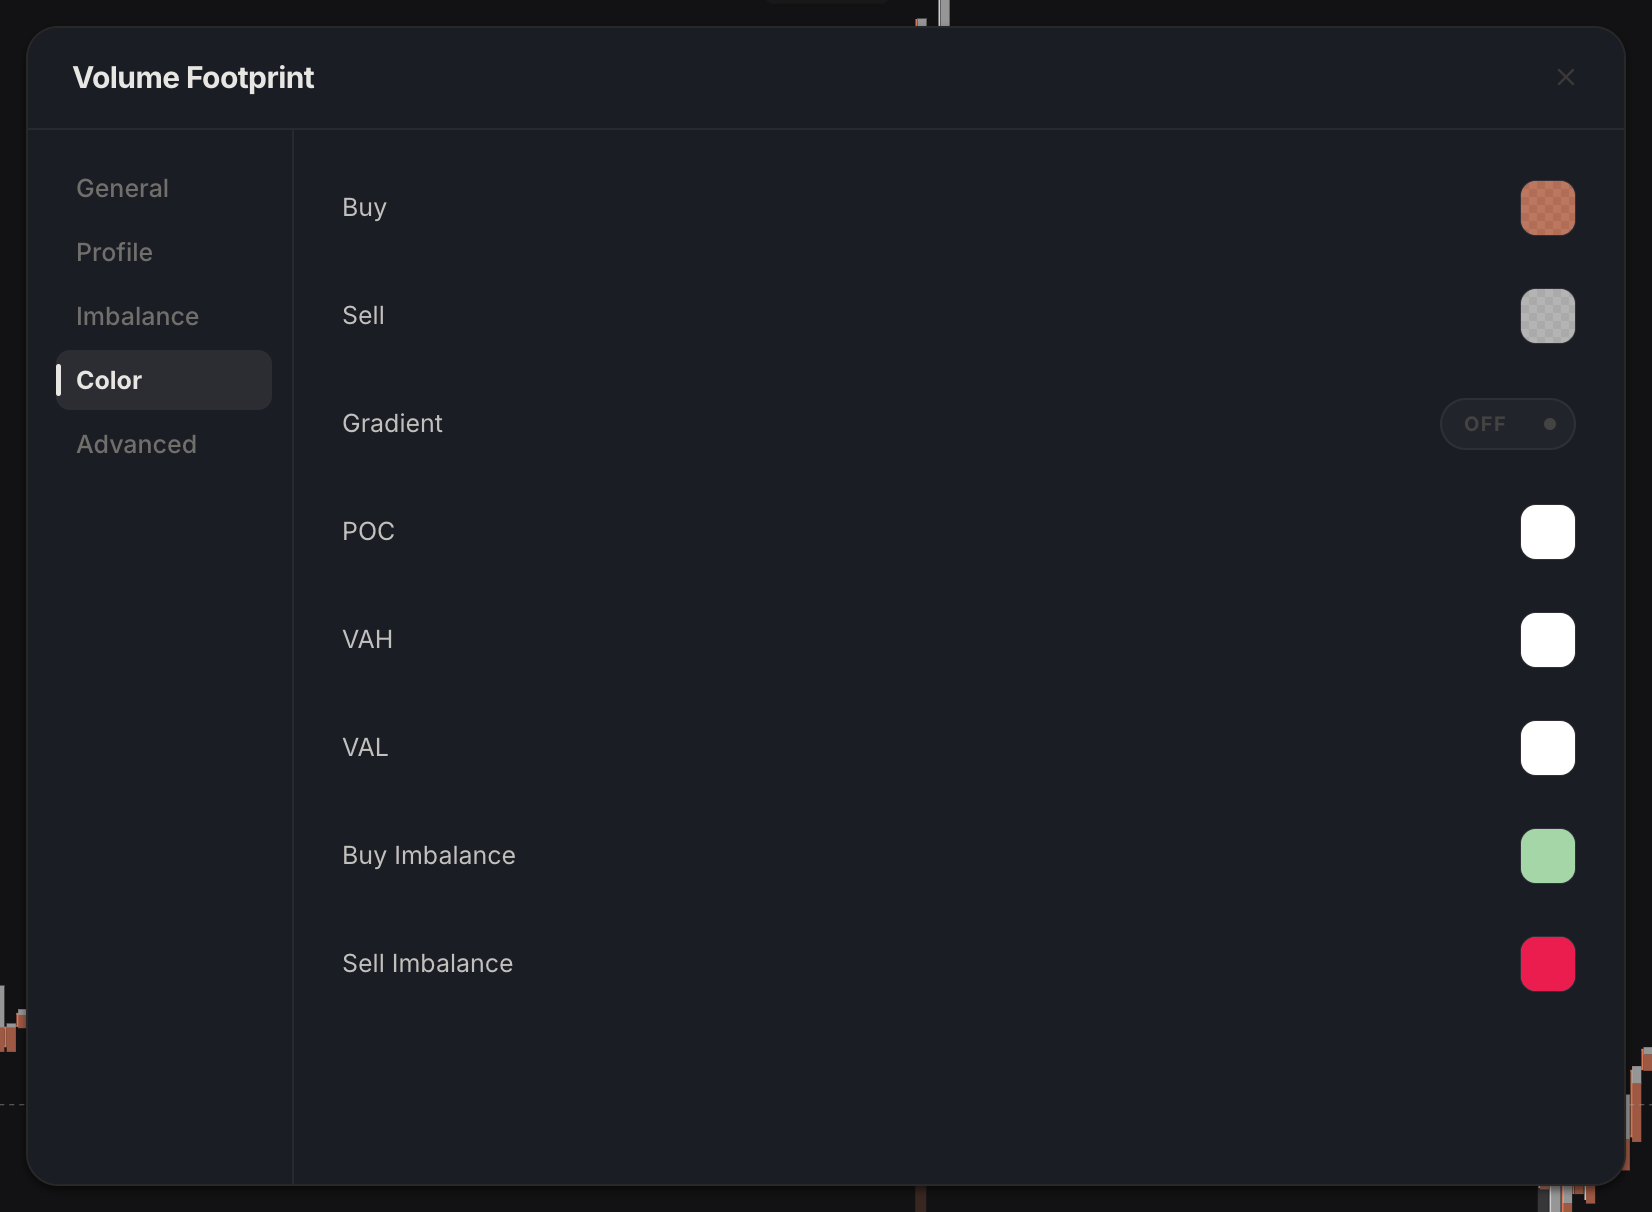
The Color tab is one place for every footprint color. Rows for optional layers only appear while their feature is turned on in the other tabs.
| Setting | What it does | Default |
|---|---|---|
| Buy | The color for buy-side volume across cells, bars, and stats. | Your theme's buy color |
| Sell | The color for sell-side volume. | Your theme's sell color |
| Gradient | Shades each cell's fill intensity by how much volume it holds instead of using flat colors, so heavy prints jump out. | Off |
| POC | The POC line color. Shown when Point of Control (POC) is on. | White on dark themes, black on light |
| VAH | The VAH line color. Shown when Value Area High (VAH) is on. | White on dark themes, black on light |
| VAL | The VAL line color. Shown when Value Area Low (VAL) is on. | White on dark themes, black on light |
| Buy Imbalance | The highlight color for buy imbalances. Shown when imbalance detection is Enabled. | Green (#a5d6a7) |
| Sell Imbalance | The highlight color for sell imbalances. Shown when imbalance detection is Enabled. | Red (#eb1d4e) |
| Volume Color Scale | The color cells shade toward when the Cluster Cell Metric is Volume: light volume stays faint, heavy volume goes full strength. Shown in cluster grid modes with the metric set to Volume. | Blue (#4a90e2) |
Advanced
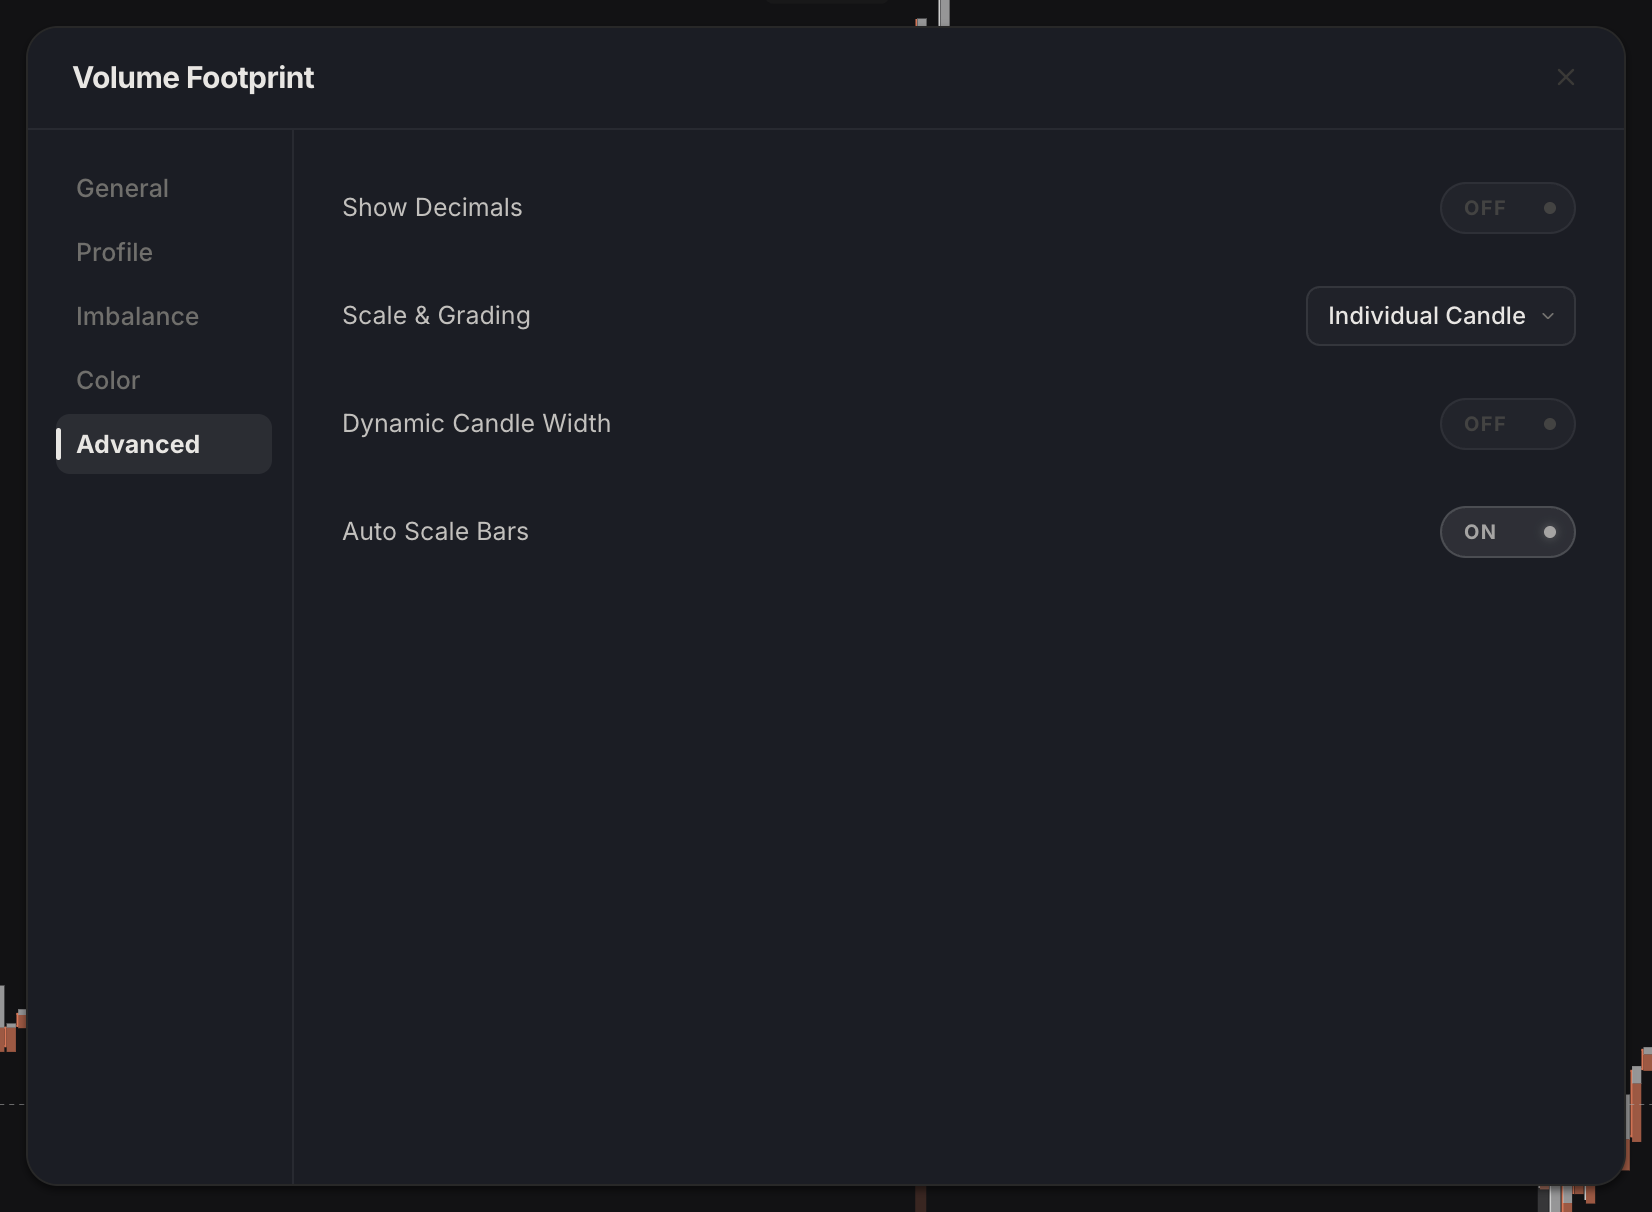
The Advanced tab tunes rendering behavior: number formatting, the reference used for color intensity, and how the grid adapts as you zoom.
| Setting | What it does | Default |
|---|---|---|
| Show Decimals | Prints cell values with decimal places instead of rounding to whole units. Useful where sizes are fractional, like coin-denominated BTC volume. | Off |
| Scale & Grading | Chooses the reference maximum that cell color intensity is graded against: each candle's own biggest cell (Individual Candle), the session's biggest (Session), or the biggest currently on screen (Visible Range). | Individual Candle |
| Dynamic Candle Width | Lets candles return to their natural width when you zoom far out, instead of holding the extra width reserved for footprint columns. | Off |
| Auto Scale Bars | Automatically merges neighboring price rows when they get too thin to read, so cells stay legible as you zoom out. | On |