Every option in OpenMarket's TPO (Market Profile) settings dialog, documented tab by tab — General, Color, Profile, and Volume.
This page documents every option in the TPO (Market Profile) settings dialog, tab by tab: General, Color, Profile, and Volume. To open it, hover the TPO row in the chart legend and click the gear icon; changes apply to the chart immediately. The Aggregated TPO indicator shares the same dialog, so everything here applies to both.
General
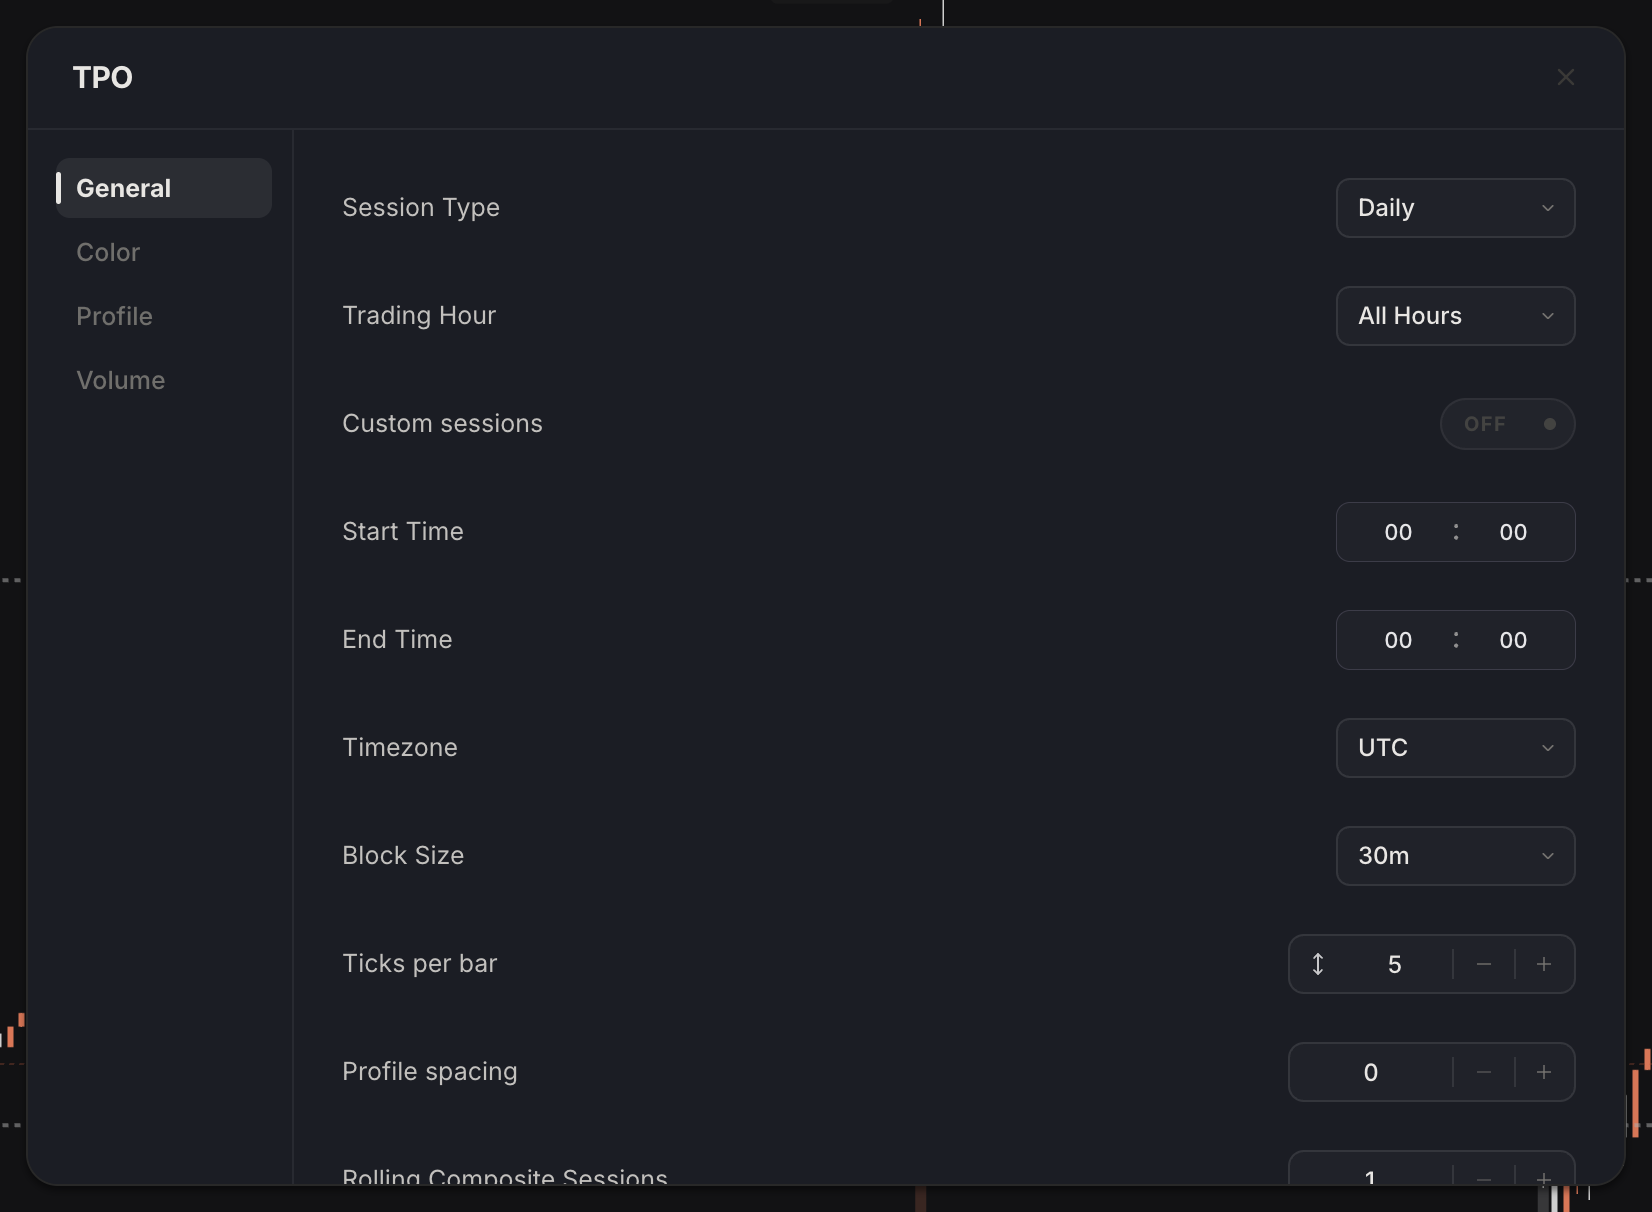
The General tab decides what data each profile is built from: which session it spans, which hours count, how much time one TPO block represents, and how coarse the price rows are.
Session and trading hours
Setting
What it does
Default
Session Type
Sets how much time one profile covers: Daily, Weekly, or Monthly. Daily gives you one profile per day; Weekly and Monthly merge whole weeks or months into single profiles for higher-timeframe context.
Daily
Trading Hour
Restricts each daily profile to a preset session window, so the POC and value area reflect only those hours. Presets include All Hours, Pre-Market (04:00 to 09:30 ET), Regular (09:30 to 16:00 ET), Post-Market (16:00 to 20:00 ET), Asia, Asia Full, London, London Full, New York, New York Full, Pre-Close, and Custom. Hidden while Custom sessions is on.
All Hours
Session
Names your custom window (up to 30 characters); the name appears in the indicator's legend title. Shown only when Trading Hour is Custom and Custom sessions is off.
Empty
Start Time, End Time
Fine-tune the session window as HH:MM times. Editing them switches Trading Hour to Custom automatically (or back to a preset if your times match one). A start at or after the end wraps past midnight. Hidden while Custom sessions is on.
Follows the preset
Timezone
Interprets the start and end times in UTC or ET (New York time). Hidden while Custom sessions is on.
Follows the preset
Custom sessions
Splits each day into up to 8 colored session profiles (times in UTC) instead of one profile per day. Each segment has a color, a label, and a start and end time; segments must be in order and not overlap. Enabling it seeds an editable Asia / London / New York / Close template and switches Block color mode to Period so each session renders in its own color. Available only when Session Type is Daily; switching to Weekly or Monthly turns it off but keeps your segments.
Off
Sizing and display
Setting
What it does
Default
Block Size
Sets how many minutes one TPO block (one letter) represents: 5m, 30m, 1h, or 4h. Smaller blocks mean more letters per row and finer time resolution; the Initial Balance bracket count is re-derived from this automatically.
30m
Ticks per bar
Sets the height of each price row in exchange ticks (1 to 500). Raise it to get fewer, fatter rows on volatile symbols; lower it for finer price resolution. The value is remembered per chart interval and session type.
Scales with the chart interval (for example 50 on a 1D chart with Daily sessions)
Profile spacing
Adds a horizontal gap (0 to 50 pixels) between neighboring session profiles so they stop touching.
0
Rolling Composite Sessions
1 is off. 2 to 20 merges the most recent sessions into one rightmost composite profile, useful for reading multi-day balance areas; manual TPO merges take precedence.
1
Trading Hour Label
Prints the session label (for example the trading-hour name) under each profile so you can tell sessions apart at a glance.
On
Show Hover Inspector
Shows a compact cell-inspection tooltip when hovering TPO cells, with the details of the row and block under your cursor.
On
Color
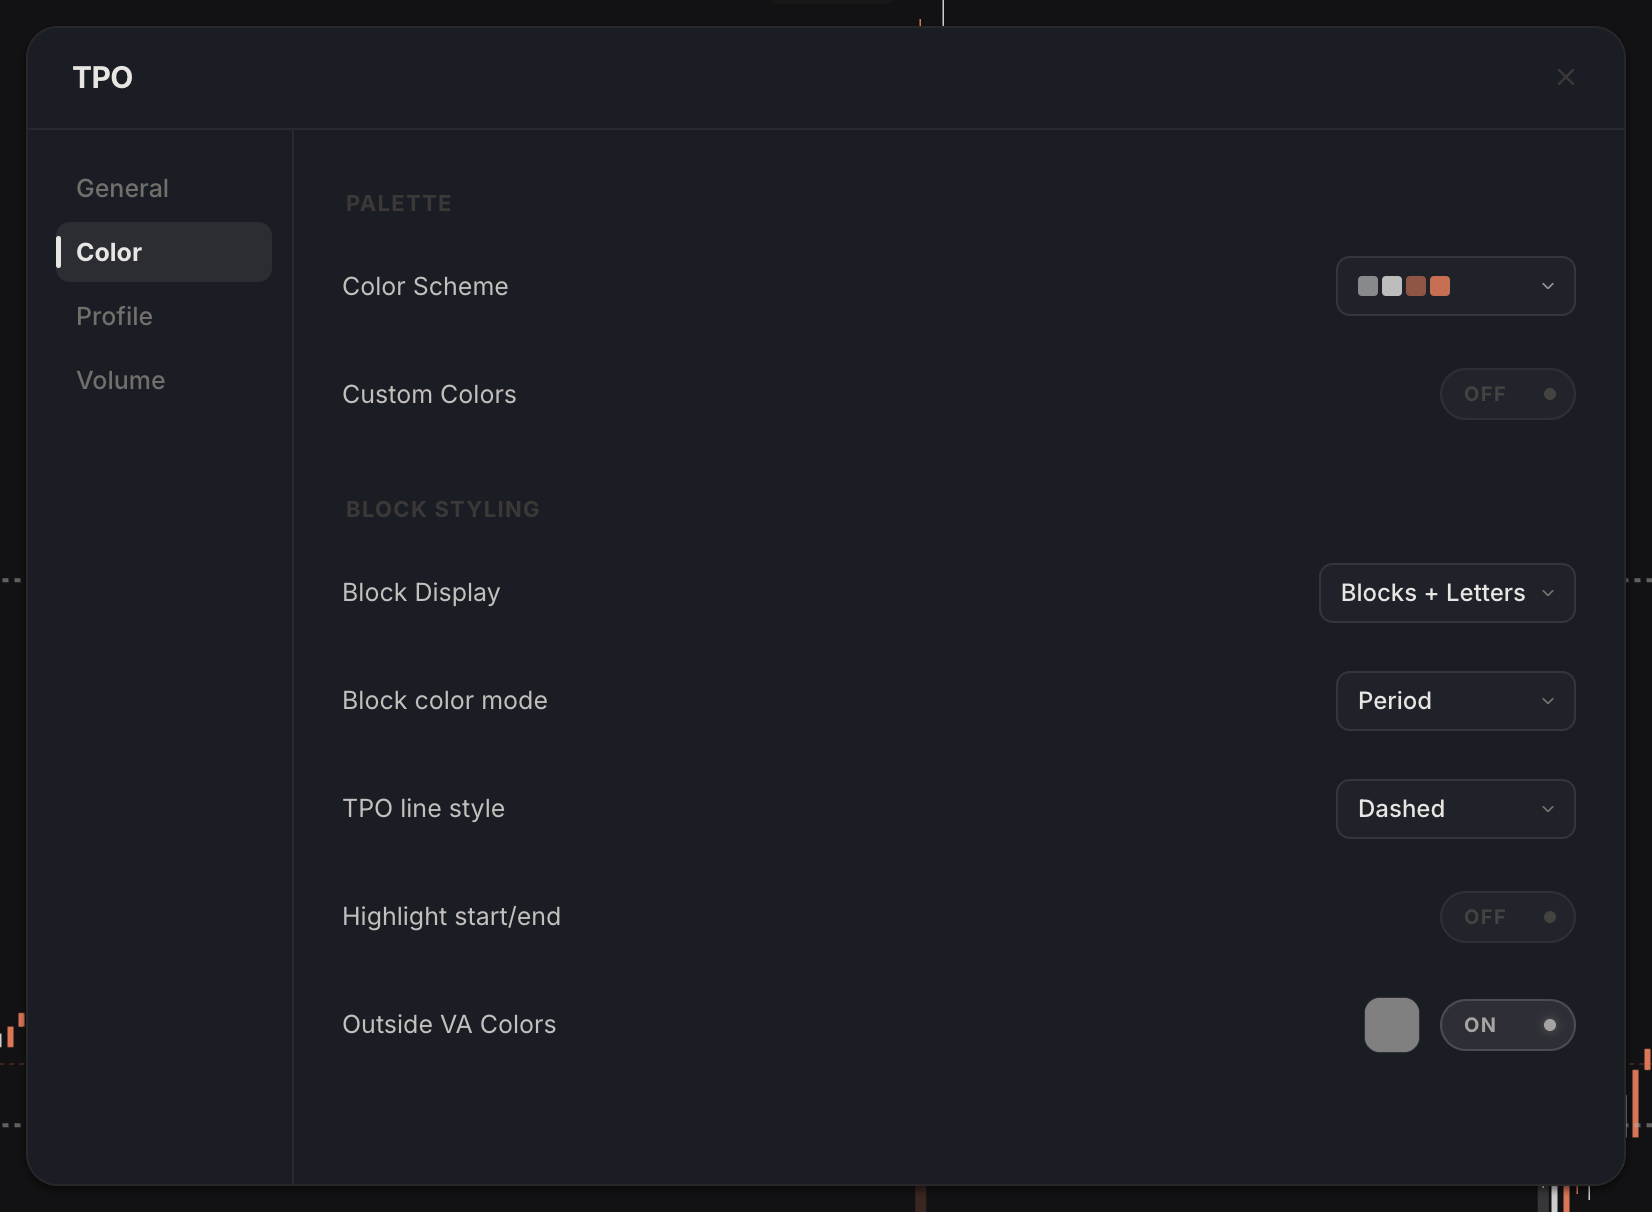
The Color tab controls the palette that paints TPO blocks, how blocks and letters are drawn, and how the area outside the value area is de-emphasized.
Palette
Setting
What it does
Default
Color Scheme
Picks the 4-stop gradient that colors blocks from the session open to the close (schemes include Sunset, Ocean, Classic, Neon, and more). Disabled while Custom Colors is on.
Matches your app theme
Custom Colors
Replaces the scheme with your own 4-stop gradient.
Off
Color 1, Color 2, Color 3, Color 4
The four stops of the custom gradient, from earliest to latest block. Shown when Custom Colors is on.
#33001A, #CC0033, #FF6600, #FFD966
Block styling
Setting
What it does
Default
Block Display
Chooses how each TPO cell is drawn: Blocks + Letters, Letters Only, or Blocks Only. Letters run A to Z, then a to z, then double letters, one per time block.
Blocks + Letters
Block color mode
Chooses what the palette encodes. Period colors blocks by time within the session (or by session color when Custom sessions is on); Count shades rows by how many TPOs printed there; Volume shades rows by traded volume; Delta shades rows by buy-minus-sell volume.
Period
TPO line style
Sets the dash pattern (Solid, Dashed, or Dotted) used for the profile's horizontal level lines, such as the POC and prior-session lines.
Dashed
Highlight start/end
Recolors the session's first and last block so you can see where each period opened and closed inside the profile.
Off
Start block
Color of the session's first TPO block. Shown when Highlight start/end is on.
#3b82f6
End block
Color of the session's last TPO block. Shown when Highlight start/end is on.
#eb1d4e
Outside VA Colors
When on, blocks outside the value area are repainted in a single flat color so the value area pops. When off, those blocks keep their palette colors and are faded instead.
On
Outside VA color swatch
The flat color used for blocks outside the value area. Shown when Outside VA Colors is on.
#808080
Opacity
How strongly blocks outside the value area are faded (0 to 100 percent). Shown when Outside VA Colors is off.
30%
Profile
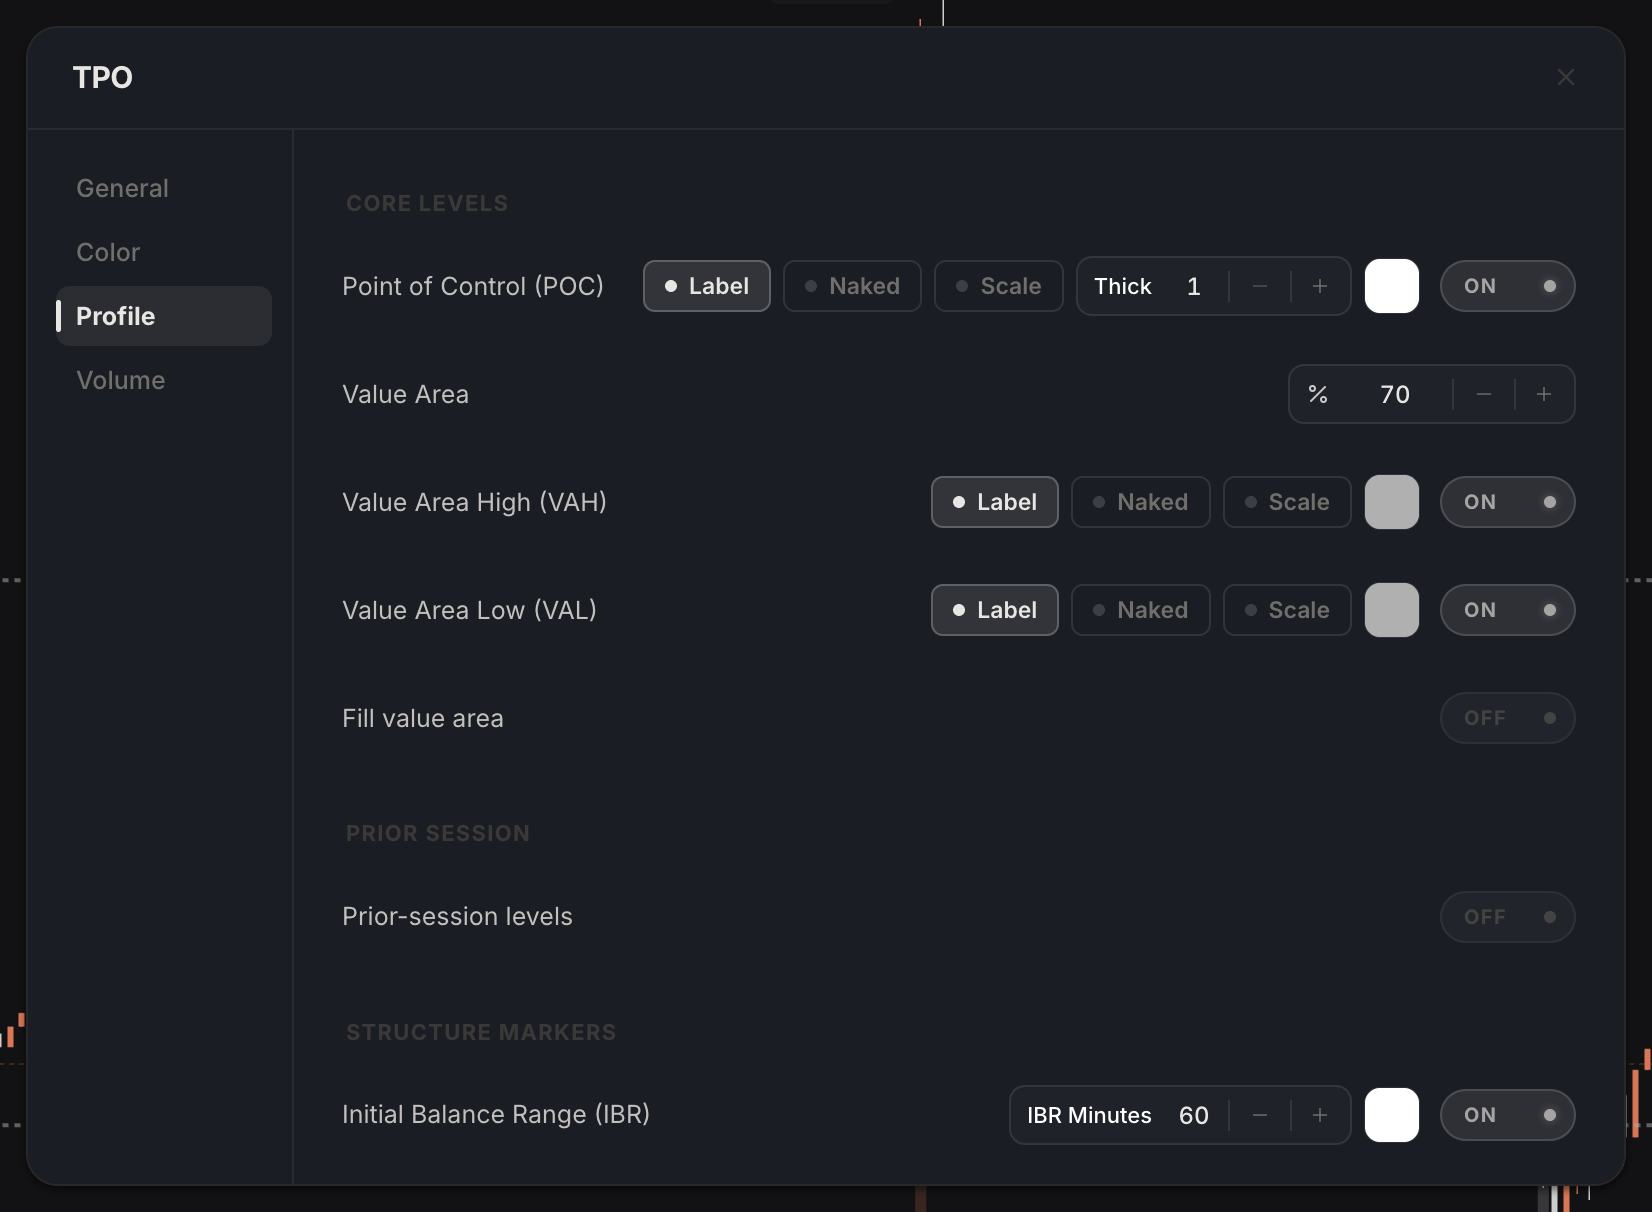
The Profile tab is the heart of the dialog: the POC and value area lines, prior-session levels, Market Profile structure markers (initial balance, poor highs and lows, single prints), and per-profile annotations. Most rows here are a main toggle with small companion controls (Label, Naked, Scale badges plus a color swatch) that appear once the toggle is on.
Core levels
Setting
What it does
Default
Point of Control (POC)
Draws a line at the POC, the price with the most TPO counts in the session, which marks where the market spent the most time.
On
POC color swatch
Color of the POC line. Shown when POC is on.
White in dark mode, black in light mode
POC Thickness
Line width of the POC in pixels (1 to 10). Shown when POC is on.
3
POC: Show Label
Prints "POC" and the price next to the line. Shown when POC is on.
On
POC: Naked Extension
Extends the POC line to the right until a later session trades back through that price, marking it as a naked (untested) level. Shown when POC is on.
Off
POC: Show on Price Scale
Puts the naked POC's price on the price scale so you can track it without scrolling. Shown when Naked Extension is on.
Off
Value Area
The percentage of the session's TPO activity the value area contains (0 to 100). 70 is the classic Market Profile definition.
70
Value Area High (VAH)
Draws a line at the top of the value area, the upper edge of where most business was done.
On
VAH color swatch
Color of the VAH line. Shown when VAH is on.
#B0B0B0 in dark mode, #505050 in light mode
VAH: Show Label
Prints "VAH" and the price next to the line. Shown when VAH is on.
On
VAH: Naked Extension
Extends the VAH line right until price trades back through it. Shown when VAH is on.
Off
VAH: Show on Price Scale
Puts the naked VAH price on the price scale. Shown when Naked Extension is on.
Off
Value Area Low (VAL)
Draws a line at the bottom of the value area.
On
VAL color swatch
Color of the VAL line. Shown when VAL is on.
#B0B0B0 in dark mode, #505050 in light mode
VAL: Show Label
Prints "VAL" and the price next to the line. Shown when VAL is on.
On
VAL: Naked Extension
Extends the VAL line right until price trades back through it. Shown when VAL is on.
Off
VAL: Show on Price Scale
Puts the naked VAL price on the price scale. Shown when Naked Extension is on.
Off
Fill value area
Shades the band between VAH and VAL so the value area reads as one region.
Off
Fill color
Color of the value-area fill. Shown when Fill value area is on.
#3b82f6
Fill opacity
Opacity of the value-area fill, from 0 to 1 in 0.05 steps. Keep it low so letters stay readable. Shown when Fill value area is on.
0.06
Prior session
Setting
What it does
Default
Prior-session levels
Draws the previous session's POC, VAH, VAL, high, and low across the developing profile, so you can see today's trade relative to yesterday's value. All controls below appear when this is on.
Off
Show pPOC label, Show pVAH label, Show pVAL label, Show pHi label, Show pLo label
Toggle the "pPOC", "pVAH", "pVAL", "pHi", and "pLo" tags on each carried-over line individually.
On
Prior POC
Color of the prior POC line.
Follows your POC color
Prior VAH
Color of the prior VAH line.
Follows your VAH color
Prior VAL
Color of the prior VAL line.
Follows your VAL color
Prior high
Color of the prior session-high line.
Follows your VAH color
Prior low
Color of the prior session-low line.
Follows your VAL color
Structure markers
Setting
What it does
Default
Initial Balance Range (IBR)
Marks the initial balance, the price range built during the session's opening minutes, which many profile traders use as the day's reference bracket.
On
IBR Minutes
How many opening minutes define the initial balance (15 to 240, in 15-minute steps). The equivalent number of TPO brackets is re-derived automatically when you change Block Size. Shown when IBR is on.
60
IBR color swatch
Color of the initial-balance marker. Shown when IBR is on.
White in dark mode, black in light mode
Poor Highs
Flags poor highs: session highs where multiple TPOs printed at the extreme, a sign of an unfinished auction, often read as a level likely to be revisited. Label, Naked Extension, and Show on Price Scale badges work like the POC ones.
Off
Poor Highs color swatch
Color of the poor-high marker. Shown when Poor Highs is on.
#FFD966
Poor Highs: Show Label
Prints a tag at each poor high. Shown when Poor Highs is on.
Off
Poor Highs: Naked Extension
Extends a poor high right until price trades back through it. Shown when Poor Highs is on.
Off
Poor Highs: Show on Price Scale
Puts naked poor-high prices on the price scale. Shown when Naked Extension is on.
Off
Poor Lows
Flags poor lows, the mirror image at session lows.
Off
Poor Lows color swatch
Color of the poor-low marker. Shown when Poor Lows is on.
#FFD966
Poor Lows: Show Label
Prints a tag at each poor low. Shown when Poor Lows is on.
Off
Poor Lows: Naked Extension
Extends a poor low right until price trades back through it. Shown when Poor Lows is on.
Off
Poor Lows: Show on Price Scale
Puts naked poor-low prices on the price scale. Shown when Naked Extension is on.
Off
Single Prints
Highlights single prints, rows where only one TPO printed, left behind by fast one-sided moves; the market often rotates back to repair them.
Off
Single Prints color swatch
Color of the single-print highlight. Shown when Single Prints is on.
#CC0033
Single Prints: Naked Extension
Extends single prints right until price revisits them. Shown when Single Prints is on.
Off
Buying/Selling Tails
Also evaluates single-print runs at the profile's extremes as buying and selling tails (aggressive rejection of the highs or lows). Changing this refetches the profile data. Shown when Single Prints is on.
Off
Buy tail edges
Minimum run length, in price rows (0 to 100), before an edge run counts as a buy tail. 0 leaves edge runs unmarked. Shown when Buying/Selling Tails is on.
0
Sell tail edges
Minimum run length, in price rows (0 to 100), before an edge run counts as a sell tail. 0 leaves edge runs unmarked. Shown when Buying/Selling Tails is on.
0
Annotations
Setting
What it does
Default
POC Summary
Prints a compact text summary (POC, VAH, and VAL prices) under each profile.
Off
Volume Summary
Adds buy, sell, total, and delta volume lines beneath the POC summary. Shown when POC Summary is on.
Off
Statistics box
Prints session statistics under each profile: range, total volume, value-area width, and rotation factor, plus TPO counts above and below the POC when Show TPO counts is on.
Off
Show TPO counts
Shows each price row's TPO count and the totals above and below the POC, so you can quantify how lopsided the profile is.
Off
Liquidation Markers
Draws live liquidation events on the TPO surface as they stream in. Min Notional filters out events below that notional value; Max Markers caps how many stay on the chart.
Off (Min Notional 0, Max Markers 200)
One-time framing
Draws one-time-framing ledges when consecutive TPO brackets keep making higher lows (up) or lower highs (down), a classic sign of directional conviction.
Off
OTF: Show OTF labels
Adds a text label at each one-time-framing ledge. Shown when One-time framing is on.
Off
Up OTF
Color of upward one-time-framing ledges. Shown when One-time framing is on.
#43a047
Down OTF
Color of downward one-time-framing ledges. Shown when One-time framing is on.
#e53935
Range extension
Marks the prices where the session extended beyond its initial balance, drawn as an edge strip along the profile.
Off
Range extension color swatch
Color of the range-extension strip. Shown when Range extension is on.
#FFB300
Developing POC
Traces how the POC migrated through the session, bar by bar, on the most recent profile.
Off
Developing: all periods
Draws the developing trail on every visible profile instead of only the current one. Shown when Developing POC is on.
Off
Developing POC color swatch
Color of the developing-POC trail. Shown when Developing POC is on.
#ffffff
Developing VA
Traces how the value area's edges evolved through the session.
Off
Developing VA color swatch
Color of the developing value-area trails. Shown when Developing VA is on.
#888888
Day type
Labels each profile with its Market Profile day classification: Normal, Normal Variation, Trend, Double-Distribution, Neutral-Extreme, or Neutral-Center (abbreviated when space is tight).
Off
Day type color swatch
Color of the day-type label. Shown when Day type is on.
#cccccc
Open type
Labels each profile's open: Open-Drive, Open-Test-Drive, Open-Rejection-Reverse, or Open-Auction, with an in-balance or out-of-balance tag.
Off
Open type color swatch
Color of the open-type label. Shown when Open type is on.
#cccccc
Volume
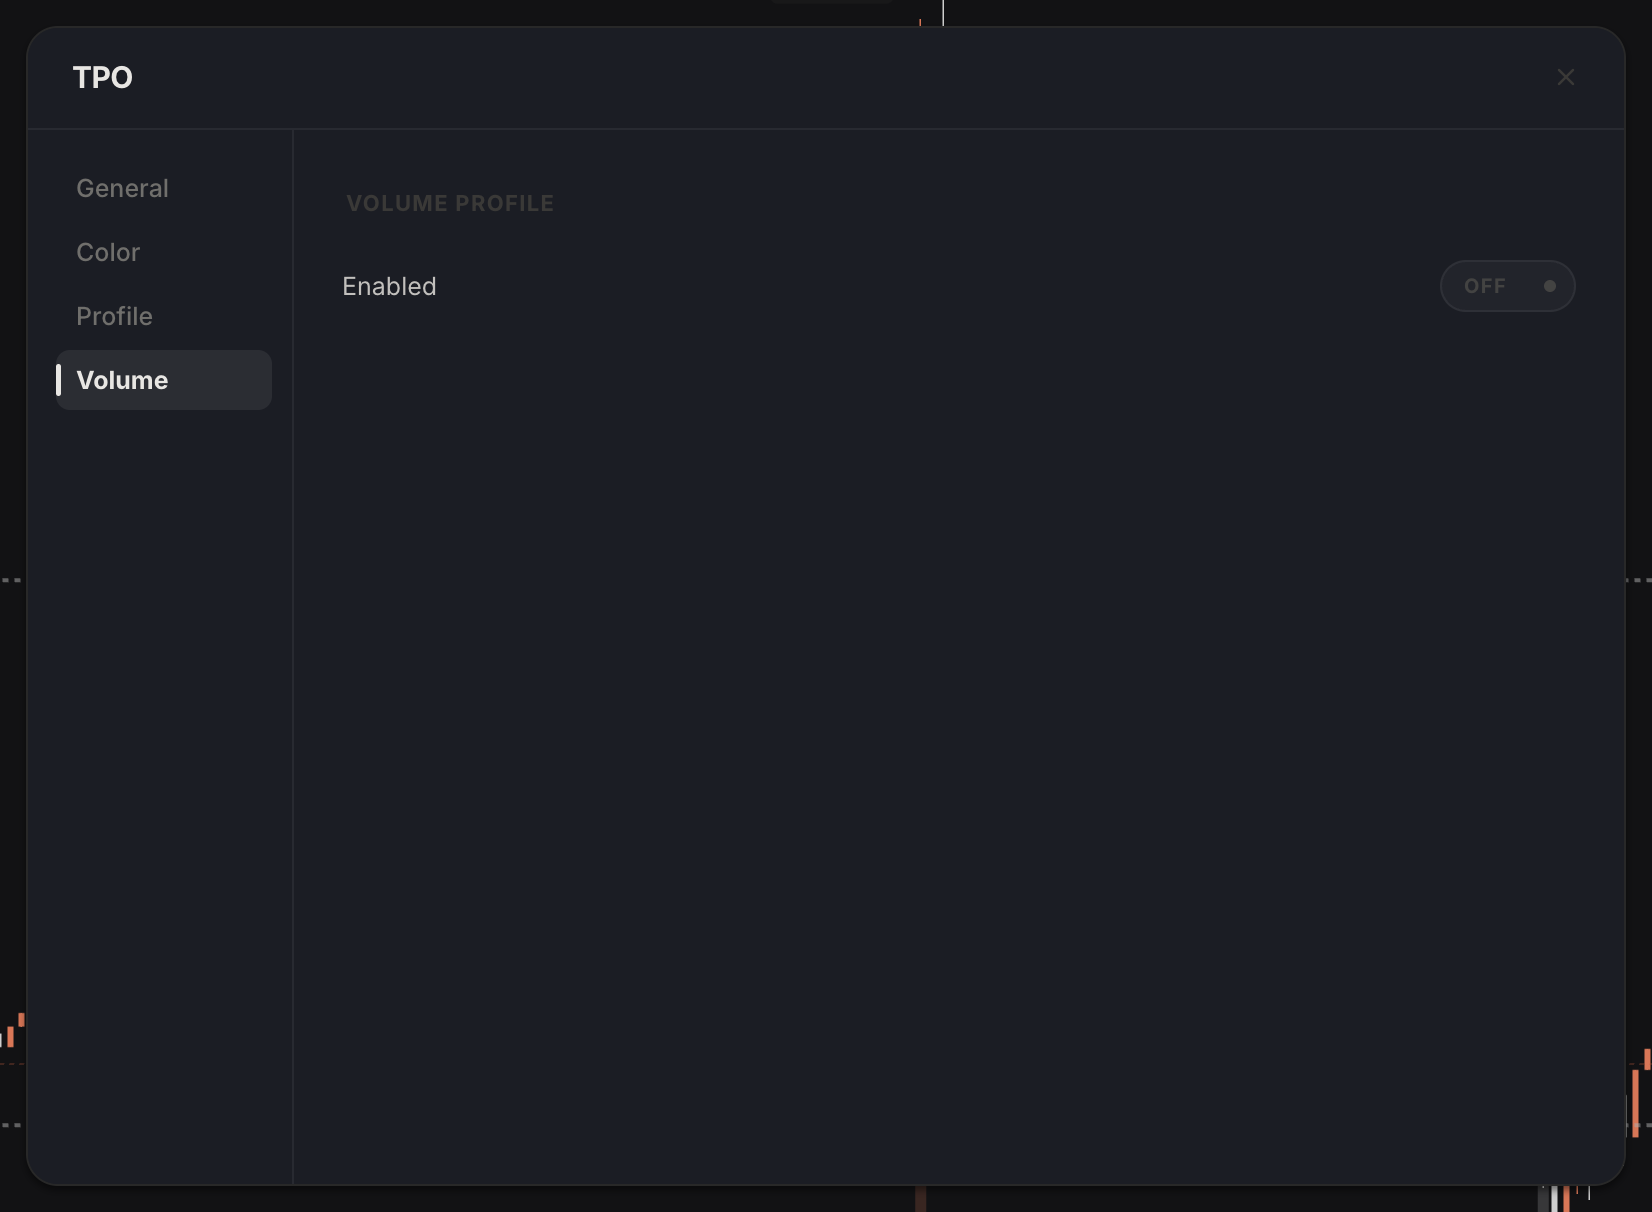
The Volume tab attaches a per-row volume profile to each TPO profile, so you can compare where the market spent time (TPO) against where it actually paid (volume). Everything below the Enabled toggle appears only while it is on.
Volume profile
Setting
What it does
Default
Enabled
Draws a volume histogram alongside each TPO profile, one bar per price row.
Off
Position
Puts the volume bars on the Left or Right side of the TPO blocks.
Left
Display Mode
Total sizes each bar by all volume traded at that row; Delta sizes it by buy-minus-sell volume and colors it by which side won.
Total
Show Value
Prints the volume (or delta) number next to each bar when rows are tall enough to fit it.
Off
Buy
Bar color for buy-dominant rows (and the positive side in Delta mode).
#a5d6a7
Sell
Bar color for sell-dominant rows (and the negative side in Delta mode).
#eb1d4e
Volume color grade
Scales each bar's intensity by its volume relative to the row with the most, making high-volume rows pop.
Off
Volume threshold
Hides price rows whose traded volume is below this value; filtered rows are also ignored by the hover inspector and structure markers. 0 disables the filter.
0
Volume levels
Setting
What it does
Default
Point of Control (POC)
Draws the volume POC, the row with the most traded volume, which can sit far from the TPO POC when time and volume disagree.
On
Volume POC color swatch
Color of the volume POC line. Shown when the volume POC is on.
White in dark mode, black in light mode
Volume POC: Naked Extension
Extends the volume POC right until price trades back through it. Shown when the volume POC is on.
Off
Volume POC: Show on Price Scale
Puts the naked volume POC's price on the price scale. Shown when Naked Extension is on.
Off
Value Area High (VAH)
Draws the volume-based value area high.
Off
Volume VAH color swatch
Color of the volume VAH line. Shown when the volume VAH is on.
#B0B0B0 in dark mode, #505050 in light mode
Volume VAH: Naked Extension
Extends the volume VAH right until price trades back through it. Shown when the volume VAH is on.
Off
Volume VAH: Show on Price Scale
Puts the naked volume VAH price on the price scale. Shown when Naked Extension is on.
Off
Value Area Low (VAL)
Draws the volume-based value area low.
Off
Volume VAL color swatch
Color of the volume VAL line. Shown when the volume VAL is on.
#B0B0B0 in dark mode, #505050 in light mode
Volume VAL: Naked Extension
Extends the volume VAL right until price trades back through it. Shown when the volume VAL is on.
Off
Volume VAL: Show on Price Scale
Puts the naked volume VAL's price on the price scale. Shown when Naked Extension is on.