
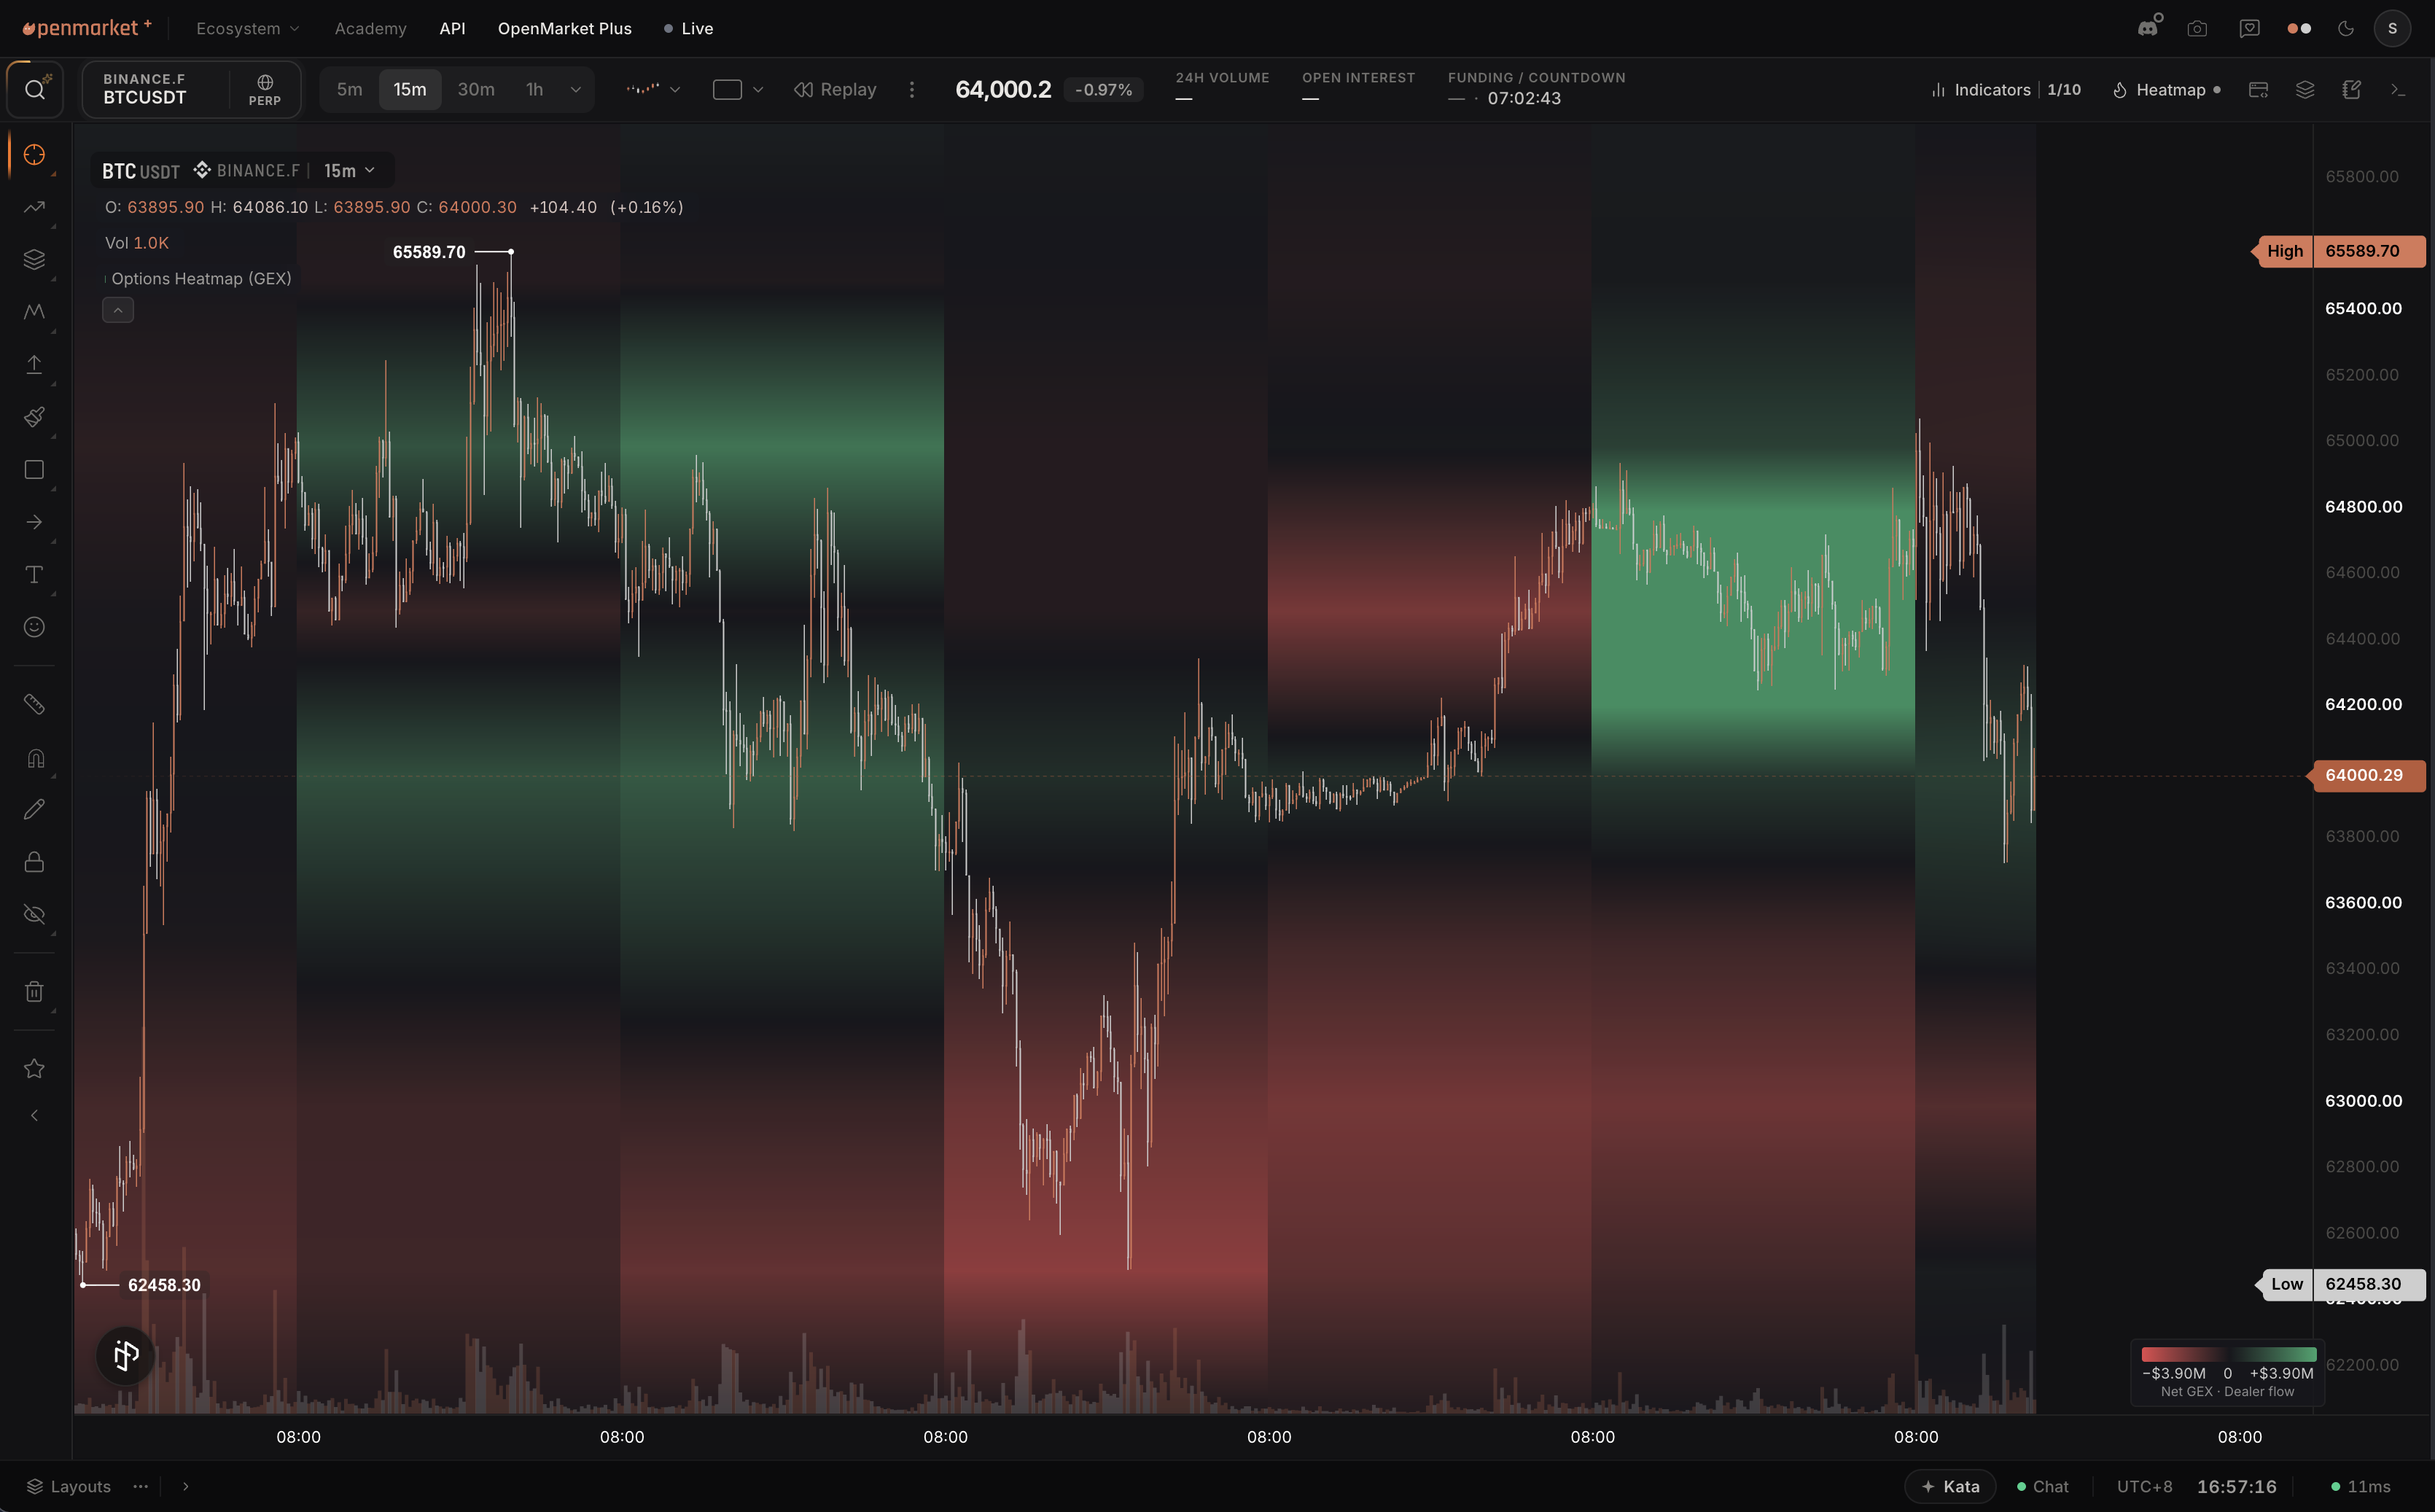
The GEX heatmap paints the options board's history straight onto your chart, behind the price candles: each column is a time bucket, each row a strike, and each cell's color shows how much exposure lived at that strike at that time. Where the GEX profile is a snapshot of today, the heatmap answers the question a snapshot cannot: how did today's walls get here, and are they moving?
Add it to your chart
- Open Indicators in the top bar.
- Search for Options Heatmap and click it once. The surface renders behind the candles on your main chart.
How to read it
By default each cell shows net GEX at that strike and time, signed by estimated dealer inventory (the Dealer flow basis, covered below): green for positive (dampening) exposure, red for negative, and brighter meaning more concentrated. Switch GEX basis to Open interest for the dealer-naive convention in shared conventions instead.
- Steady horizontal bands are strikes that have held positioning for days: today's walls, with a history.
- Bands that step along with price show the board being rolled as the market moves.
- Bands that cut off are expiries rolling away; watch whether the same strike re-loads afterwards.
Because the surface sits behind the candles, you read price's reaction to a band directly: approaches, stalls, and breaks all play out on top of the exposure beneath them.
The Metric setting repaints the whole surface with a different lens: net GEX (default, the only metric with a Dealer flow basis), VEX (vega exposure), DEX (delta exposure, natural delta signs), charm (delta decay per day), vanna (delta sensitivity to vol), plain open interest, or out-of-the-money mark IV. VEX, charm, and vanna always use the dealer-naive convention; open interest and IV are unsigned intensity maps.
Color intensity is auto-calibrated per coin and per metric from a high percentile of recent magnitudes, so colors show relative concentration, not absolute dollars. Switching coins or metrics recalibrates the scale, and a bright cell on a thin board can represent far fewer dollars than a dim cell on BTC.
The math
Each cell applies the suite's standard formulas (conventions) at its own strike and time bucket; for the default metric,
GEXK=∑contracts at KΓ×OI×S2×0.01
Greeks beyond gamma and delta are derived with Black-Scholes (rate zero) from each contract's mark IV. History is reconstructed from daily open-interest and IV aggregates: roughly 90 days of OI history, 30 days of IV history, and aggregate greek accuracy of about 7 percent.
The surface refreshes with the chart: when you add it, switch symbol or interval, pan into new territory, or wake the tab. History does not poll on its own timer; only today's forming column checks for new trades every few minutes. A denser hourly history upgrade is planned.
Basis
Net GEX is the only metric with a dealer-flow variant; GEX basis defaults to Dealer flow here too, and the setting disappears on every other metric, which always render with natural or dealer-naive signs (conventions).
The whole visible surface only switches to Dealer flow once the reconstructed trade tape (estimation math) covers at least 90% of the closed days back to the deepest day you have viewed in this session; until then every column serves Open interest, so a first deep pan-back can briefly show the naive surface while the tape catches up. Once that threshold is met, each closed day is signed with the dealer inventory reconstructed as of that day's own close, and the forming (today) column signs live from the same running inventory the GEX profile uses. A day whose reconstruction genuinely is not ready yet falls back to Open interest on its own.
Switch GEX basis to Open interest to pin every column back to the naive convention. The scale chip's metric label appends "· Dealer flow" and discloses the naive-fallback percentage whenever Dealer flow is active.
How the surface is encoded
Every tile is colored from a fixed anchor magnitude,
M0=Q0.995(∣value∣)
the 99.5th percentile of the metric's magnitude over the batch used to calibrate the surface. M0 is set once per coin, metric, and basis, from the first batch of history delivered after you add the indicator or change one of those three, and held fixed after that, so colors stay stable as you pan.
- Sensitivity (0 to 100, Subtle to Vivid) never touches M0. It instead picks a display magnitude Mdisp≤M0 from a small persisted table of 21 quantiles, interpolated between anchors: q(t)=0.995−100t×0.095 Mdisp is the q(t)-quantile of the same magnitude distribution, and the visible color range becomes {0, 2Mdisp}. Because every tile was already encoded against the fixed M0, dragging the slider only restretches that fixed range across the color ramp: it recalculates live with no refetch and no flash, and the hover readout always shows the true value no matter where the slider sits.
- Surface style picks how tiles connect across the strike axis. Smooth (default) draws continuous color bands between adjacent strikes so the surface reads as a contour; a band only bridges two strikes whose gap is at most 2.5 times the median strike spacing in that column, wider gaps are left as a break instead of stretching color across missing structure, and the outermost edges of the surface fade rather than cutting off sharply. Blocks turns this off and draws the raw discrete tile grid.
- Palette picks the color ramp: Classic, Ice & Fire (the colorblind-friendly choice), Violet Gold, Magma, or Ocean. Every ramp is mixed in OKLab rather than plain RGB, so a multi-hue ramp like Ice & Fire passes through a genuinely neutral midpoint instead of a muddy gray.
- Opacity controls how strongly tiles cover the candles beneath them, with three presets, Subtle (70%), Normal (85%, the default), and Solid (100%), or any value dragged between them.
- Local caching: once a day closes, its reconstructed values for every metric are cached on your device, so switching metric, sensitivity, or scrolling back into history you have already loaded repaints instantly with no new fetch. Today's forming column is always computed live. Flipping the Basis setting recalibrates and repaints the entire visible surface in one pass, so a frame mixing old-basis and new-basis tiles never renders.
- The scale chip in the corner of the chart shows a gradient strip labeled with the calibrated magnitude, the active metric's name, and, under Dealer flow, the fallback disclosure. It hides while any pane on the chart is maximized, and while the surface has not yet calibrated (including right after a coin switch).
Settings
| Setting | What it does | Default |
|---|---|---|
| Metric | Which surface the cells show: net GEX, VEX, DEX, charm, vanna, open interest, or IV | Net GEX |
| GEX basis | Sign convention for Net GEX: Open interest (dealer-naive) or Dealer flow (estimated inventory); hidden on other metrics | Dealer flow |
| Palette | Color theme: Classic, Ice & Fire, Violet Gold, Magma, or Ocean. Ice & Fire is the colorblind-friendly choice. | Classic |
| Surface style | Smooth strike-interpolated bands, or discrete Blocks | Smooth |
| Sensitivity | How quickly colors saturate, Subtle to Vivid | Normal (about 16 of 100) |
| Opacity | How strongly the surface covers the chart, with Subtle / Normal / Solid presets | Normal (85%) |
| Cumulative GEX zero line | Draws the strike where net GEX, summed up the strike ladder, crosses zero in each column; it is not the gamma flip | Off |
Assumptions
- Calibration (the M0 anchor and the sensitivity table) is computed once from the first batch of history delivered for the current coin, metric, and basis, then held fixed; switching any of those three recalibrates from scratch.
- Dealer-flow coverage is a whole-surface decision gated on the reconstructed trade tape covering 90% of closed days back to the deepest day you have viewed this session; a first pan far back in history can therefore show Open interest everywhere until the tape catches up, and dealer flow can never reach further back than about 185 days regardless.
- Basis fallback is decided per instrument, so a single column can still mix a dealer-signed near-dated contract with a naive-signed far-dated one at the same strike, exactly as on the profile and curve.
- The Cumulative GEX zero line reads each column's per-strike totals; a column keeps no individual contracts, so the gamma flip, which re-prices every contract at each price, cannot be drawn per column. Today's flip is on the GEX profile.
Reading it in context
- Walls migrate, not just exist. A call wall stepping up day after day as price climbs is often read as dealers chasing the move. A wall that has not budged while price approaches is often read as a firmer ceiling.
- Date the regime. The heatmap shows how long the current structure around spot has persisted; many traders weight a dampening regime that has held for weeks more heavily than one that appeared yesterday.
- Follow strikes across expiries. A strike that keeps re-loading after every expiry suggests a level someone keeps re-establishing; one that vanishes was likely that cycle's positioning and nothing more.
- Skeptical caveat: the history is reconstructed from daily aggregates and the colors are relative, so treat the heatmap as narrative, not measurement. For today's precise levels, read the GEX profile.