
The GEX profile draws the options board directly onto your price chart: a horizontal bar at every strike showing how much dealer hedging pressure lives there, plus lines for the call wall, put wall, gamma flip and max pain. It answers the first question of every session: which prices matter today, and does the market dampen or amplify moves between them?
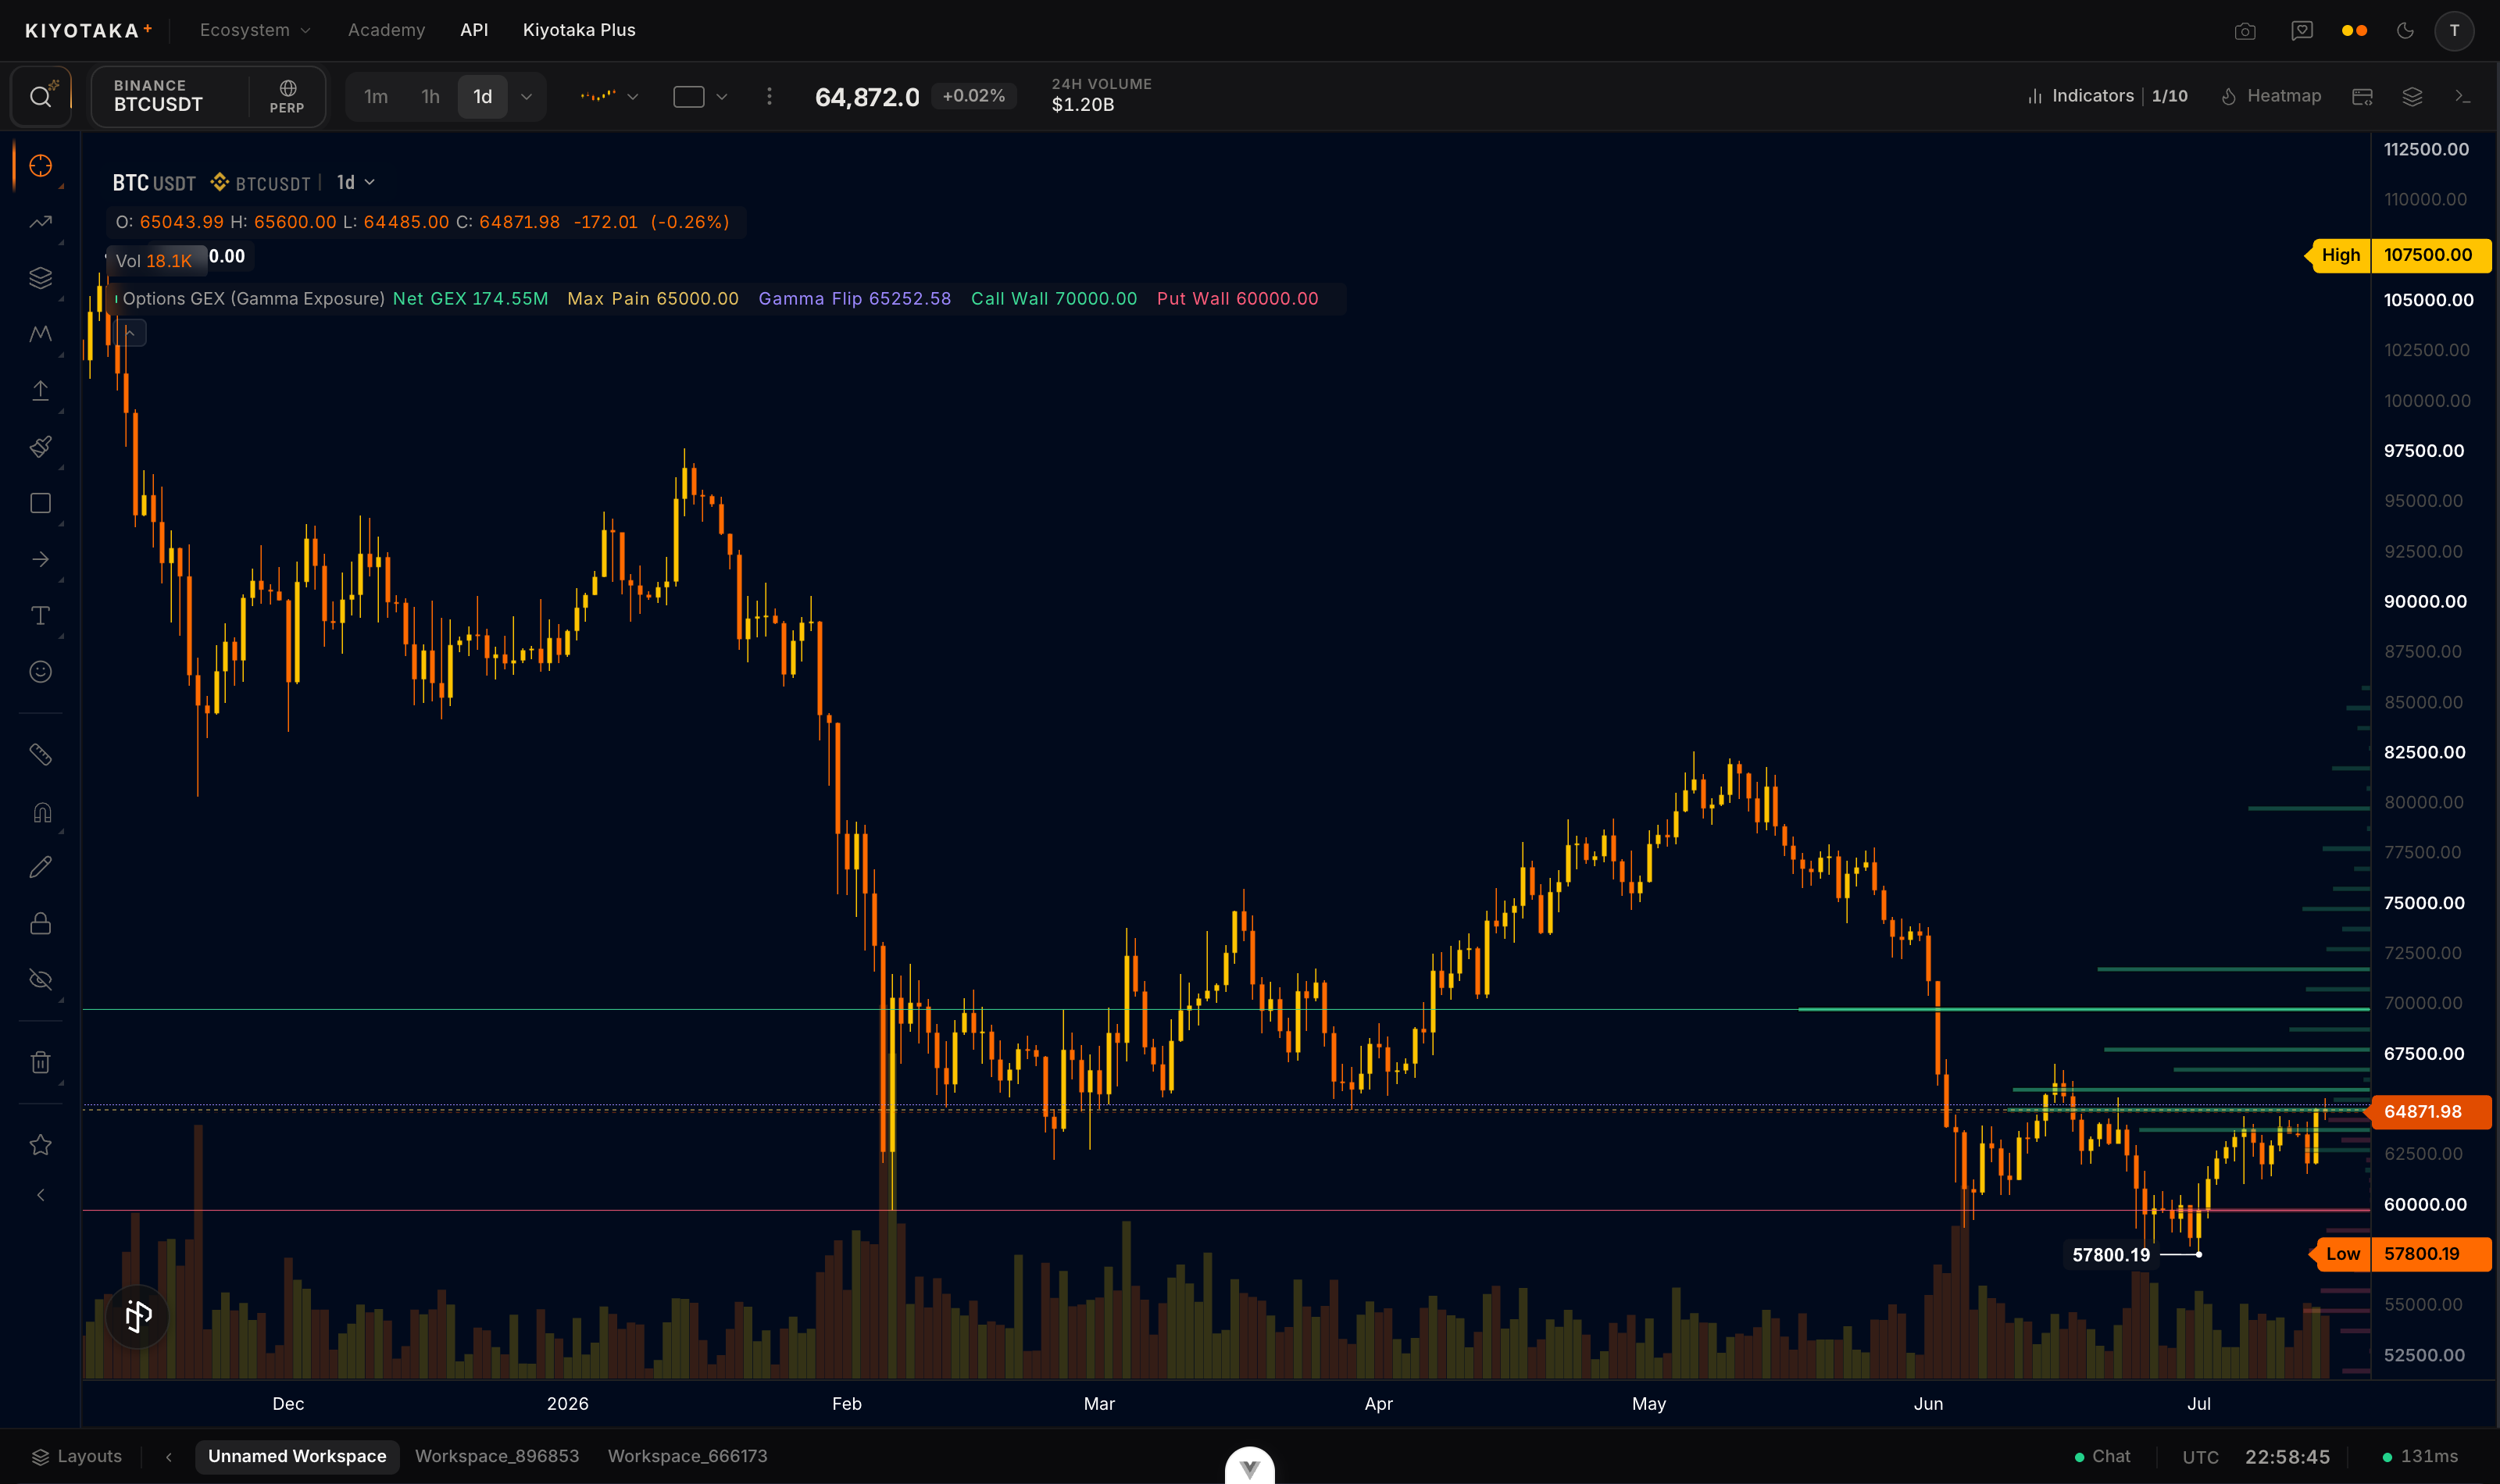
Add it to your chart
- Open Indicators in the top bar.
- Search for Options GEX and click it once. The profile renders on your main chart, anchored to the price axis.
- Works on symbols with Deribit options (BTC and ETH are the deep boards). On anything else the profile stays empty.
How to read it
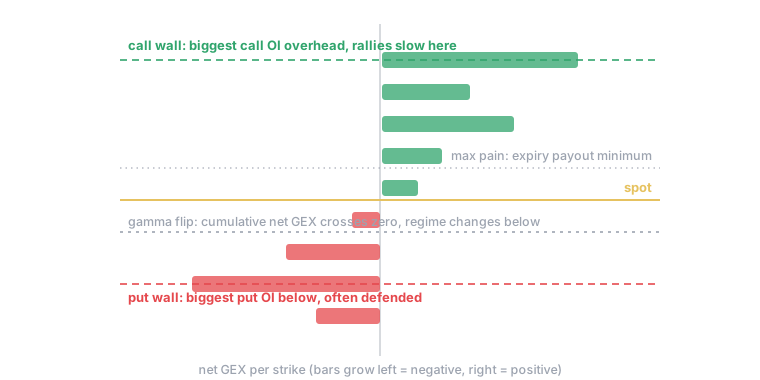
Each bar sits at a strike. Bar length is that strike's net gamma exposure; direction and color split positive from negative:
- Long bars near spot are the strikes dealers must actively hedge. In the dealer-hedging model, price can slow down, chop, or pin around the biggest ones.
- Call wall (line above spot): the largest call open interest overhead. Often read as resistance: in the standard model, dealer selling thickens there as price rises.
- Put wall (line below spot): the put-side equivalent, often read as support.
- Gamma flip (line): the price nearest spot where net GEX, re-derived with every contract repriced there, crosses zero (Dealer-flow flip on the Dealer flow basis). Above the flip dealers dampen movement; below it their hedging chases price and moves can stretch. Many traders treat a close through the flip as a regime change.
- Max pain (line): the expiry-payout minimum. Commonly watched into big expiries rather than as an intraday level.
The legend reads the board's net GEX, colored by the dealer regime its sign sets (green long gamma, red short gamma, gray neutral), with a chip for each level. Net GEX and the flip come from every strike of the expiries the profile reads, not only the bars the strike window draws. With Expiries narrower than all, the legend names that scope first ("nearest expiry", "expiries ≤1W" or "expiries ≤1M").
The call wall and put wall descriptions above are the Open interest basis. The default Dealer flow basis defines both walls a little differently: see Basis below.
The math
Per contract, then summed per strike (conventions):
GEXK=∑contracts at KΓ×OI×S2×0.01
in USD of hedging flow per 1% move. This is the Open interest basis: dealer-naive signs, calls positive and puts negative. The flip is the root of net GEX nearest spot within plus or minus 50 percent, re-derived with every contract repriced by Black-Scholes as its own underlying moves (no root in that range, no flip), walls are the largest call/put open interest by strike, and max pain is the payout argmin either way. Open interest counts both the coin-settled and USDC-settled product lines.
The Display setting switches the bar metric: net GEX (signed), absolute GEX (magnitude only), plain open interest, DEX (delta exposure, natural signs, in USD), or VEX (vega exposure per vol point).
Basis
By default, GEX basis signs each strike by estimated dealer inventory instead of the naive convention above. The suite reconstructs every instrument's maker position from the taker side of the options trade tape (estimation math); an instrument whose reconstruction covers at least 60% of its listed life rides that inventory's actual sign, long or short. Anything thinner, a freshly listed or illiquid contract, falls back to the Open interest convention automatically, strike by strike; the two conventions are never blended within a single instrument.
Switch GEX basis to Open interest in settings to pin the whole board to the naive convention instead.
Dealer flow changes what the wall lines mean: the call wall and put wall become the strikes with the largest positive and largest negative net GEX rather than the largest open interest. Max pain stays open-interest-based either way, and the gamma flip always follows whichever basis is signing the board (on Dealer flow the line reads Dealer-flow flip and the legend Dealer-flow net GEX, so neither passes for the open-interest numbers on the Dashboard).
The legend's basis chip always names the active basis and discloses the fallback share live, for example "Dealer flow · 12% naive fallback" (0% once every visible strike has enough trade history behind it).
Settings
| Setting | What it does | Default |
|---|---|---|
| Display | Bar metric: net GEX, absolute GEX, open interest, DEX, or VEX | Net GEX |
| GEX basis | Sign convention: Open interest (dealer-naive) or Dealer flow (estimated inventory) | Dealer flow |
| Expiries | Which expiries feed the profile: all, nearest only, this week, this month | All |
| Strike window | How far from spot to draw bars, percent of price | 35% |
| Refresh | Poll cadence in seconds (30 to 600) | 60 |
| Max pain / Gamma flip / Call wall / Put wall | Toggle each level line and pick its color | On |
| Level thickness | Line weight for the key levels (1 to 5px) | 2px |
| Colors | Positive / negative bar colors | Green / red |
| Bar width | Bar thickness, percent of the strike gap | 25% |
Assumptions
- Dealer flow only signs an instrument once its reconstructed position covers at least 60% of its listed life; thinly-traded or freshly-listed contracts fall back to Open interest automatically, and that fallback is decided per instrument, not per strike, so one bar can blend a dealer-signed contract with a naive one landing on the same strike.
- The board is a rolling snapshot of the option chain refreshed on the Refresh cadence above, not a live feed; between polls the profile can lag the true book by up to that interval.
- Max pain and the call/put open-interest split always come from open interest; only net/absolute GEX, DEX, and the levels that key off them change with the basis setting.
- Expired instruments (past their 08:00 UTC settlement) drop out of both the board and the dealer inventory the moment they settle.
Reading it in context
- Positive-GEX territory. When spot sits between walls in positive-GEX territory, the dampening regime is commonly associated with mean reversion toward the biggest bars.
- The flip as a boundary. Many traders expect breakouts to behave differently on either side of the flip: more prone to fail above it, more prone to extend below it.
- Expiry days reshuffle the board. A wall built from Friday-expiring contracts vanishes Friday 08:00 UTC. Check the Dashboard and Flow by expiry to see whether a given level expires today.
- Skeptical question to ask: is the wall made of many small strikes or one giant print? One whale rolling a position can move a "wall" in minutes; the Options flow panel shows whether it is being built or unwound right now.