
The GEX curve draws the gamma board in its own pane under the chart, over the strike axis instead of time. Its headline mode recomputes dealer gamma at hypothetical spot prices, answering a question no on-chart profile can: if price goes there, what does dealer gamma become?
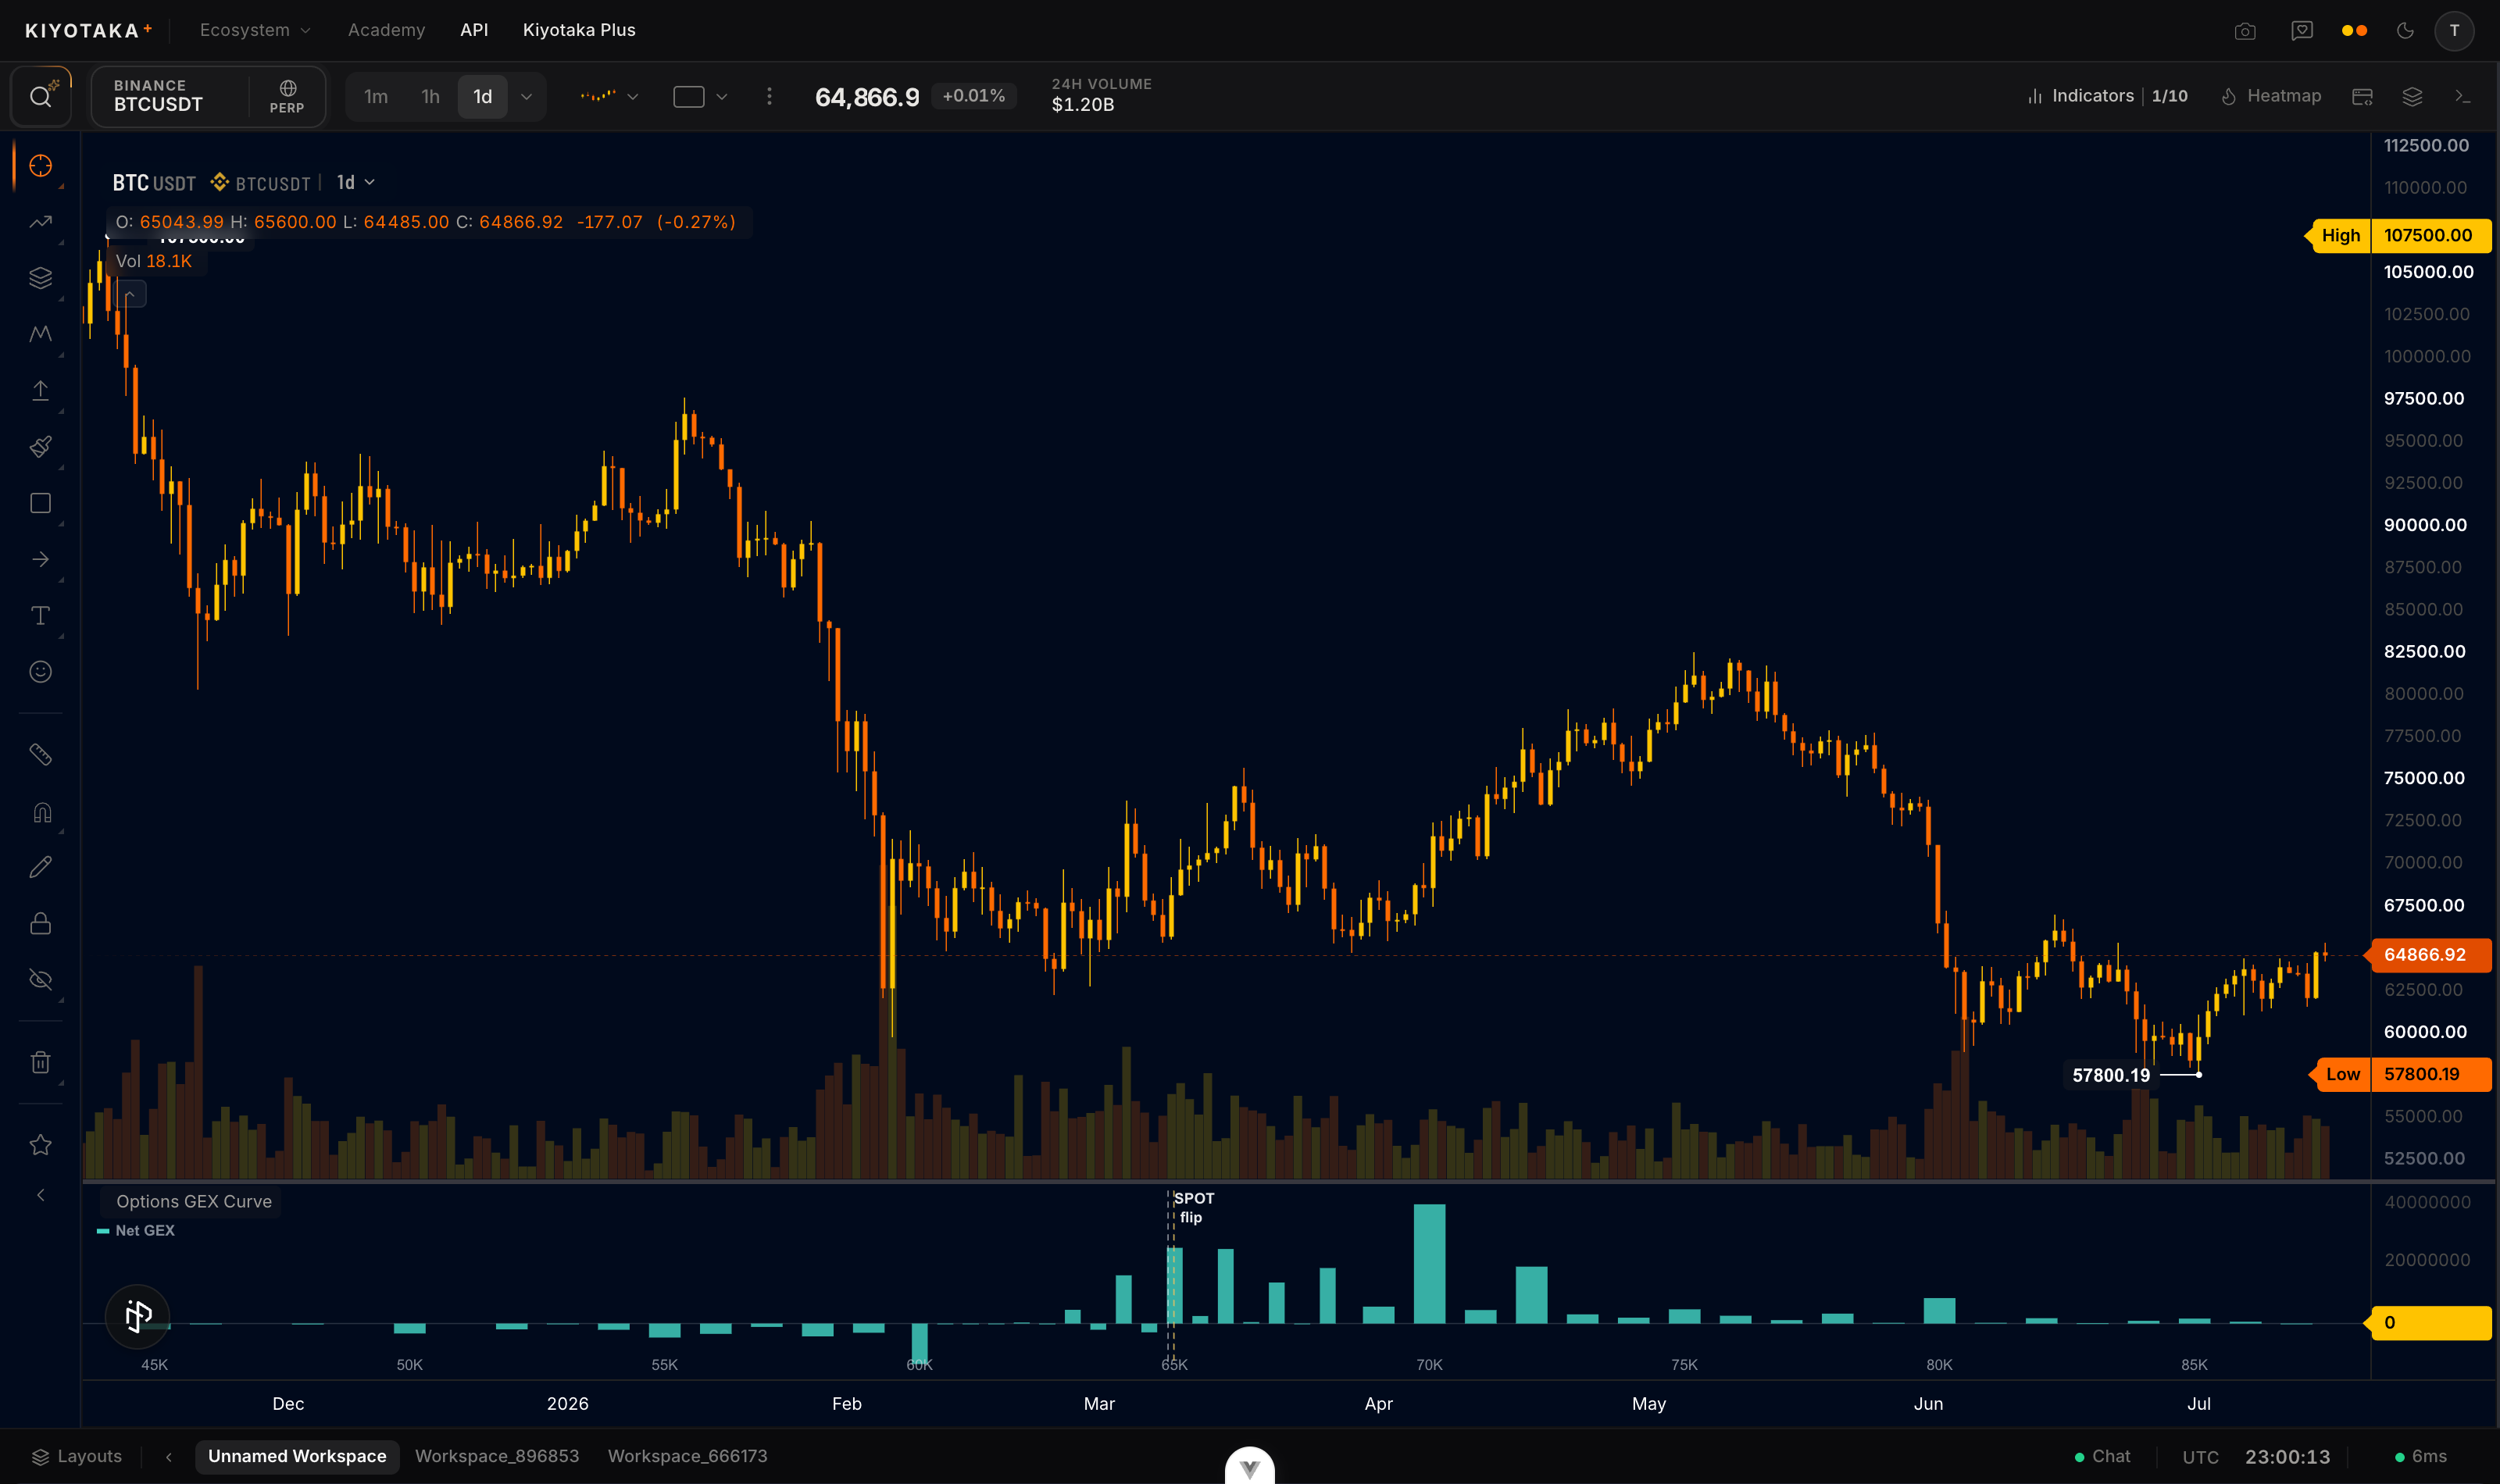
Add it to your chart
- Open Indicators in the top bar.
- Search for Options GEX Curve and click it once. The curve renders in its own pane under the chart.
How to read it
Two markers ride the curve in every mode: the live spot price and the gamma flip, the whole board's flip the GEX profile draws for the same expiries and basis (it reads dealer-flow flip on the Dealer flow basis). The Mode setting picks what the curve itself shows:
- By strike (default): net GEX bars at every listed strike, the same math as the GEX profile, just drawn in a pane instead of on the price axis.
- Over spot: the classic dealer gamma profile, drawn as a line. Total net GEX is recomputed at hypothetical spot prices across roughly plus or minus 15 percent of the current price. Where the line is positive, dealer hedging would dampen moves at that price; where negative, it would amplify them (conventions). This is the calculation the flip comes from, so the line's zero nearest spot sits on the flip marker.
- Cumulative: a running sum of net GEX across strikes, drawn as a line. Its endpoint is the board's sum of per-strike net GEX; its zero crossing is not the gamma flip (the flip marker shows that).
The Expiries setting scopes which contracts feed the curve, and the pane repolls on its own timer like the rest of the suite.
Full-pane stats row
Use the pane's maximize button (or double-click the pane; Esc restores it) for a bigger view. Maximized, the curve gains a stats row across the top: Call Wall and Put Wall (the x-position of the largest positive and largest negative value on screen), and Σ+ / Σ- (the sum of the positive and negative values currently in view). It reads whatever mode, basis, and strike window are active, so it always describes exactly what you are looking at. The row shows no flip: the flip marker is the gamma flip.
The math
By-strike mode sums the standard GEX formula per strike (conventions). Over-spot mode substitutes each hypothetical price Sh into both the gamma and the S2 term, re-deriving every contract's gamma at that level with Black-Scholes from its mark IV:
GEX(Sh)=∑contractsΓ(Sh)×OI×Sh2×0.01
Each contract's own underlying moves in proportion with the hypothetical price. The gamma flip is this function's root nearest spot within plus or minus 50 percent, and net GEX is its value at spot.
Cumulative mode is the running sum of the by-strike values across strikes.
Basis
Like the GEX profile, GEX basis defaults to Dealer flow: every mode signs its contributions by estimated dealer inventory reconstructed from the options trade tape (estimation math) rather than the naive convention, with the same per-instrument fallback to Open interest for contracts short on trade history. The fallback is never blended within one instrument.
By strike and cumulative reuse the same per-strike contributions as the profile. Over spot carries the basis into the Black-Scholes sweep too: each hypothetical-spot gamma is weighted by the instrument's actual signed inventory instead of its raw open interest.
Switch GEX basis to Open interest to pin every mode back to the naive convention.
The flip marker is the whole board's gamma flip in every mode, the GEX profile's level, signed by the same basis. Under Dealer flow the series label discloses the fallback share directly, for example "Net GEX · Dealer flow · 12% naive fallback".
Settings
| Setting | What it does | Default |
|---|---|---|
| Mode | By strike bars, dealer gamma over hypothetical spot, or cumulative sum | By strike |
| GEX basis | Sign convention: Open interest (dealer-naive) or Dealer flow (estimated inventory) | Dealer flow |
| Expiries | all, nearest only, this week, this month | All |
| Strike window | How far from spot the strike-axis modes plot, percent of price (the full listed ladder would crush the near-money view) | 35% |
| Refresh | Poll cadence in seconds (30 to 600) | 60 |
Assumptions
- Dealer flow applies identically to all three modes: by strike and cumulative reuse the same per-instrument contributions as the profile, and over spot re-weights the Black-Scholes sweep by each instrument's signed inventory instead of raw open interest.
- Basis fallback is decided per instrument (at least 60% of its listed life reconstructed), never blended within one instrument, matching the profile.
- The maximized stats row's Call Wall / Put Wall / Σ figures are read straight off whatever is currently plotted, so they follow the active mode, basis, and strike window; the Σ figures total only the points in view, not the full board. The flip marker reads the whole board instead and never moves with the strike window.
Reading it in context
- Gamma at hypothetical levels. Over-spot mode shows whether a given price level sits in stabilizing or destabilizing gamma territory before price ever goes there: in the dealer-hedging model, a negative stretch implies hedging that amplifies moves, a positive shelf implies dampening.
- Read the board's lean. Cumulative mode shows at a glance how lopsided the whole board is; the flip marker shows how far spot sits from the flip in every mode.
- Skeptical caveat: hypothetical-spot gamma assumes every contract's IV stays put while price moves, which never exactly happens. Treat the over-spot curve as a map, not a promise.