
Options flow draws traded options volume directly on your price chart: a horizontal column at every strike, sized by how much actually changed hands there over the range you are looking at. It is a visible-range volume profile for options trades instead of spot volume, and it is the flow companion to the GEX profile: open interest tells you what exists, flow tells you what is being done right now.
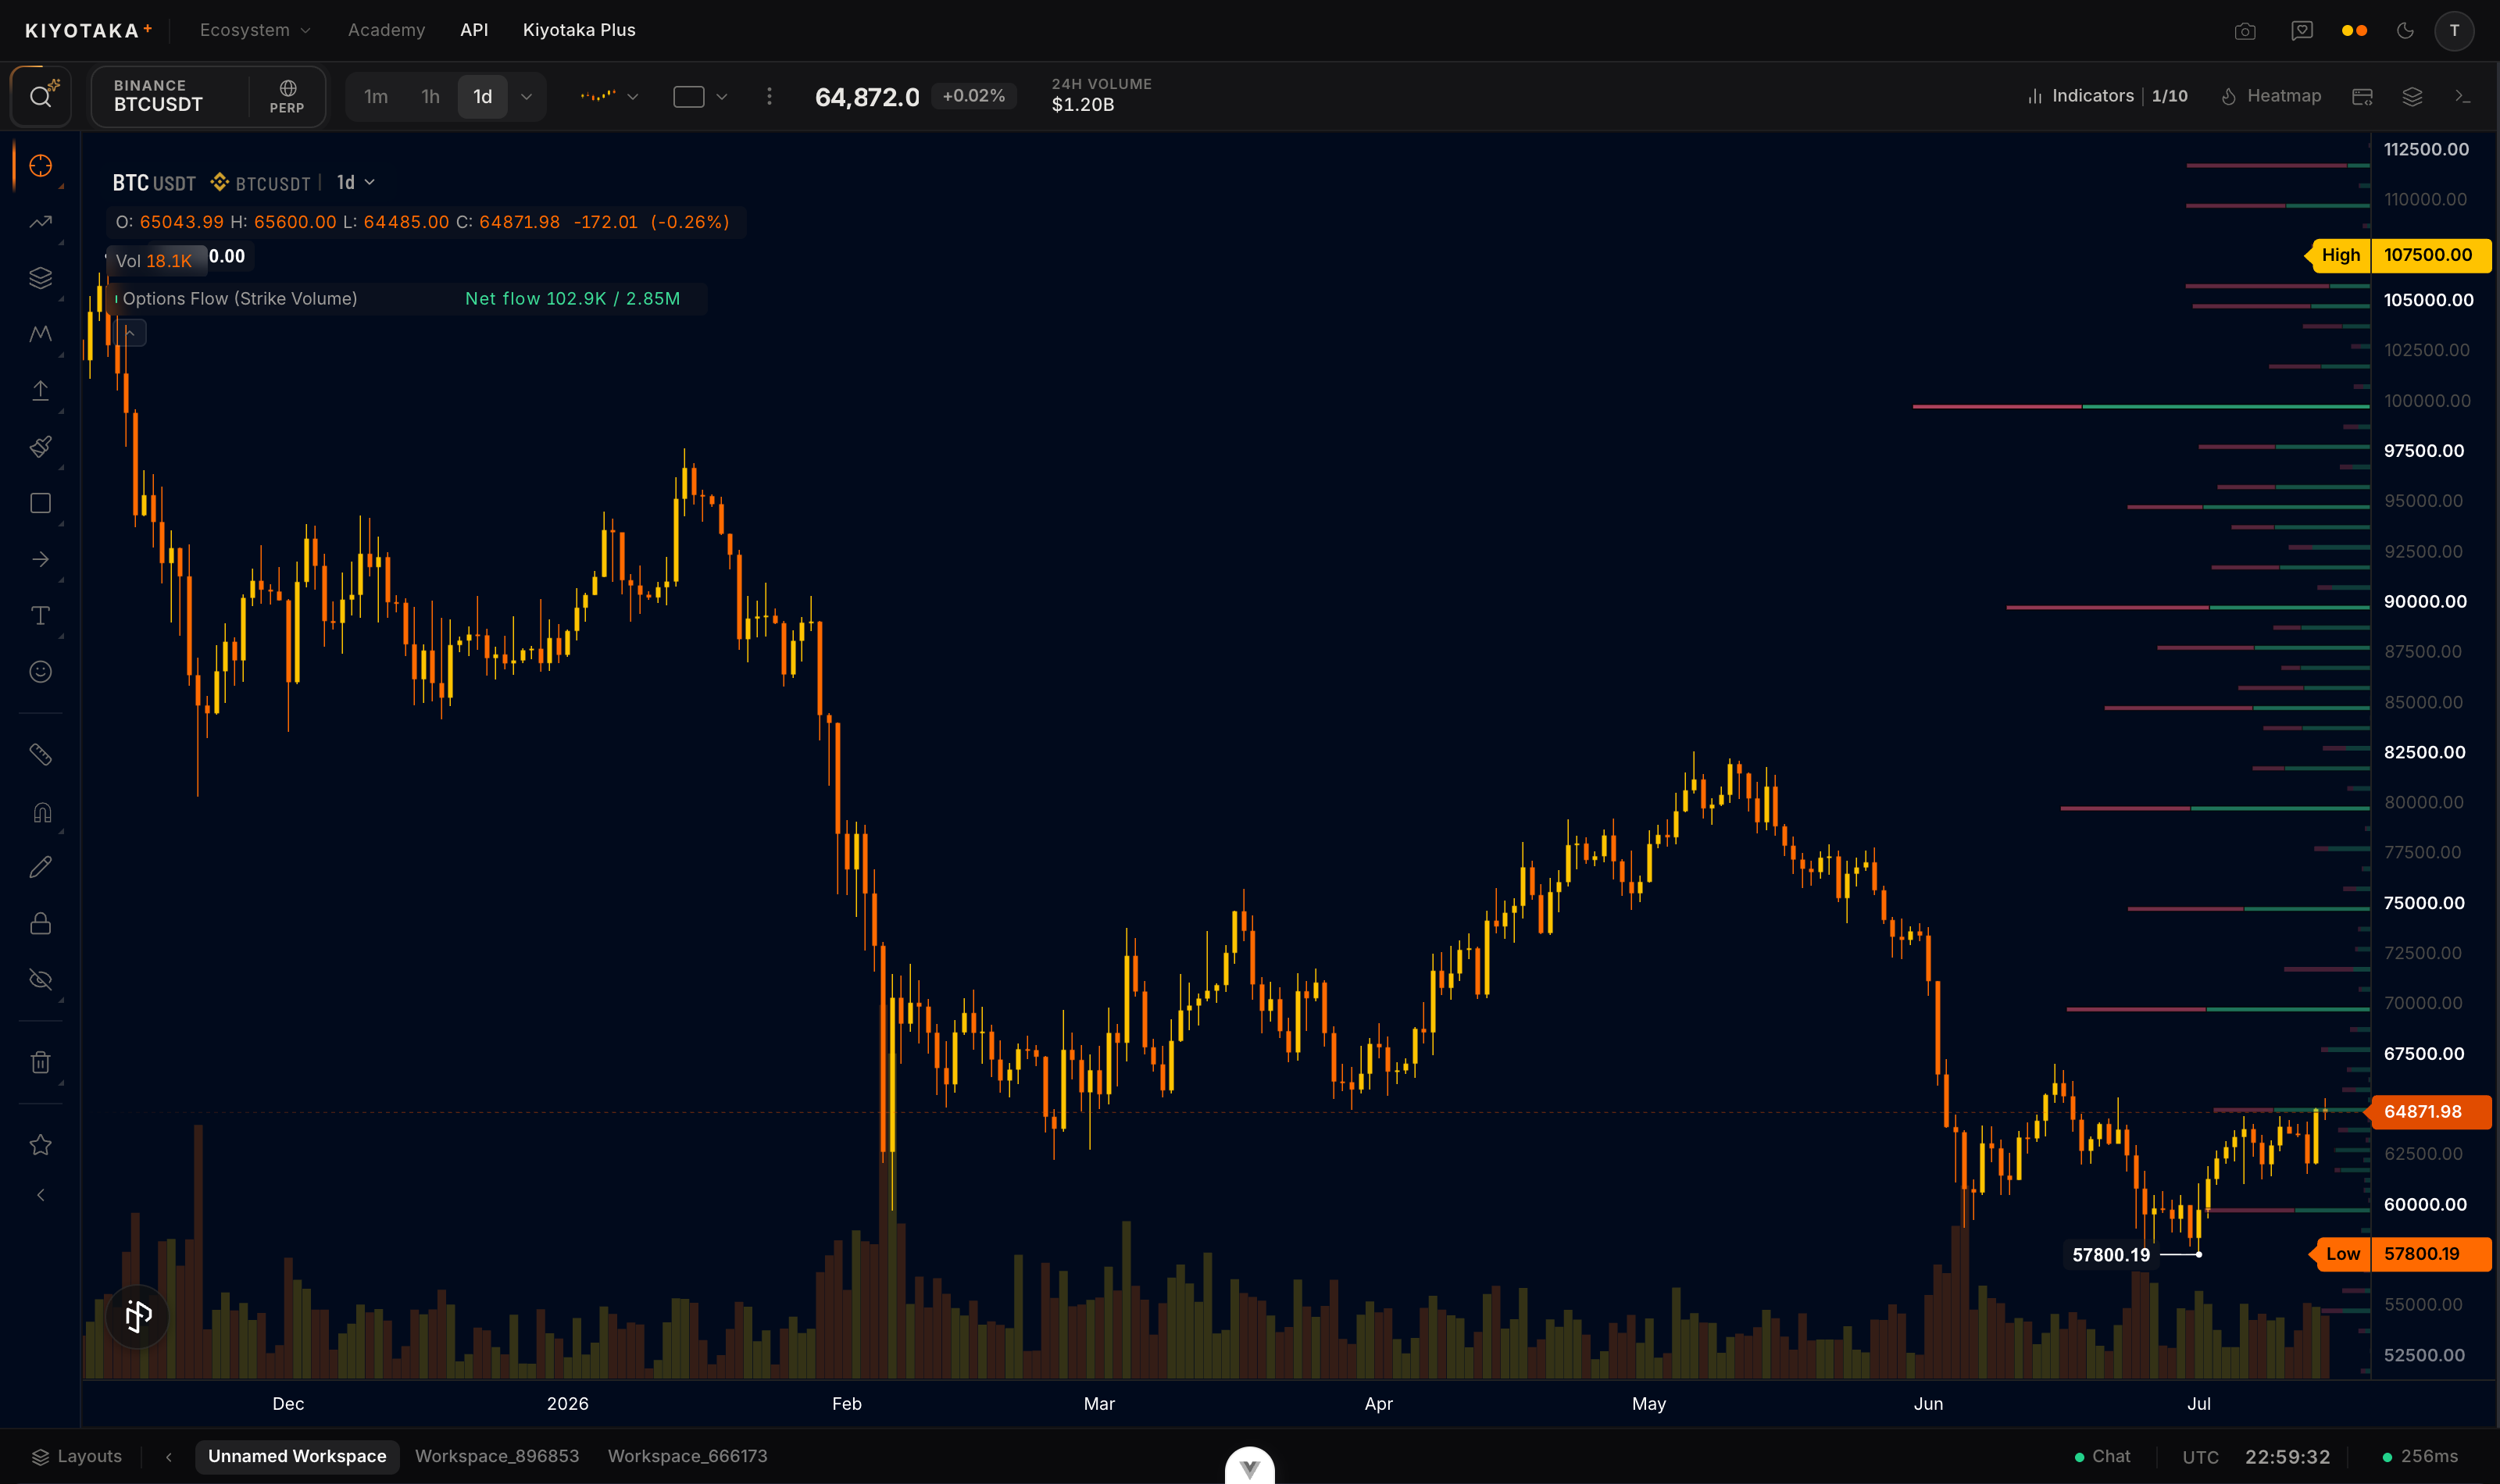
Add it to your chart
- Open Indicators in the top bar.
- Search for Options Flow and click it once. The columns render on your main chart, one at each strike.
Fullscreen
Options flow draws on the main price pane rather than a pane of its own, so there is no separate pane to maximize here; use the chart's own fullscreen controls to expand the whole price chart.
How to read it
The profile is scoped to whatever is on screen: pan or zoom and it re-aggregates over the new visible range. Zoom in to today for session flow, zoom out for the longer campaign (the tape covers more than six months of history).
Two display modes:
- Net flow (default): one column per strike, buys minus sells. Green means the strike is being net bought, red means net sold.
- Buy/Sell: two columns per strike showing the raw split, for when you want the gross two-way business rather than the net.
The legend totals the visible range for you: net flow and total traded volume, both in coin units.
Because Net flow is buys minus sells, a short column can sit on top of heavy balanced trade. When a strike looks quiet but the legend's total volume says otherwise, flip to Buy/Sell to see the size behind the net.
The math
From every Deribit options trade at strike K inside the visible range, both the coin-settled and USDC-settled product lines converted to coin units (conventions):
columnK=∑trades at K±size(+ buy, − sell)
Net flow plots the signed sum; Buy/Sell plots the bought and sold sides separately.
Settings
| Setting | What it does | Default |
|---|---|---|
| Mode | Net flow (signed) or buy/sell split columns | Net flow |
| Colors | Buy / sell column colors | Green / red |
| Bar width | Column thickness as a fraction of the strike gap | 0.2 |
Assumptions
- Volume is recovered to coin units per book: coin-settled (inverse) contracts convert at that bar's close premium, an approximation when premium moved intrabar; USDC-settled (linear) contracts are already coin-denominated.
- The buy or sell tag is the taker side of the trade, a proxy for direction; negotiated blocks and multi-leg combos can carry a taker flag that does not reflect the trader's real intent.
- History runs deep (six-plus months of Deribit options trades); a market with no listed options simply never populates.
Reading it in context
- Whether a wall is being built. A call wall from the GEX profile that shows fresh buying here is being built; steady net selling at that strike suggests the shelf is being unwound.
- Strikes waking up. Sudden concentrated activity at one strike shows here before open-interest updates catch up; flow is often the earlier signal.
- Flow behind a breakout. Many traders look for call buying at strikes above price, not just momentum in the perp, as a sign a move has options participation behind it.
- Skeptical caveat: net flow at a strike does not reveal who initiated or whether the trades open or close positions. A big net print can be a roll, not a new bet. Cross-check open-interest changes on the GEX profile and the freshness windows in Flow pulse before treating it as conviction.