
Flow by expiry puts one bar under your chart for every live expiry, showing net traded options volume over a trailing window. Where Options flow asks which strikes the money targets, this pane asks when: is today's positioning an event bet into the next expiry, or a quarter-long campaign?
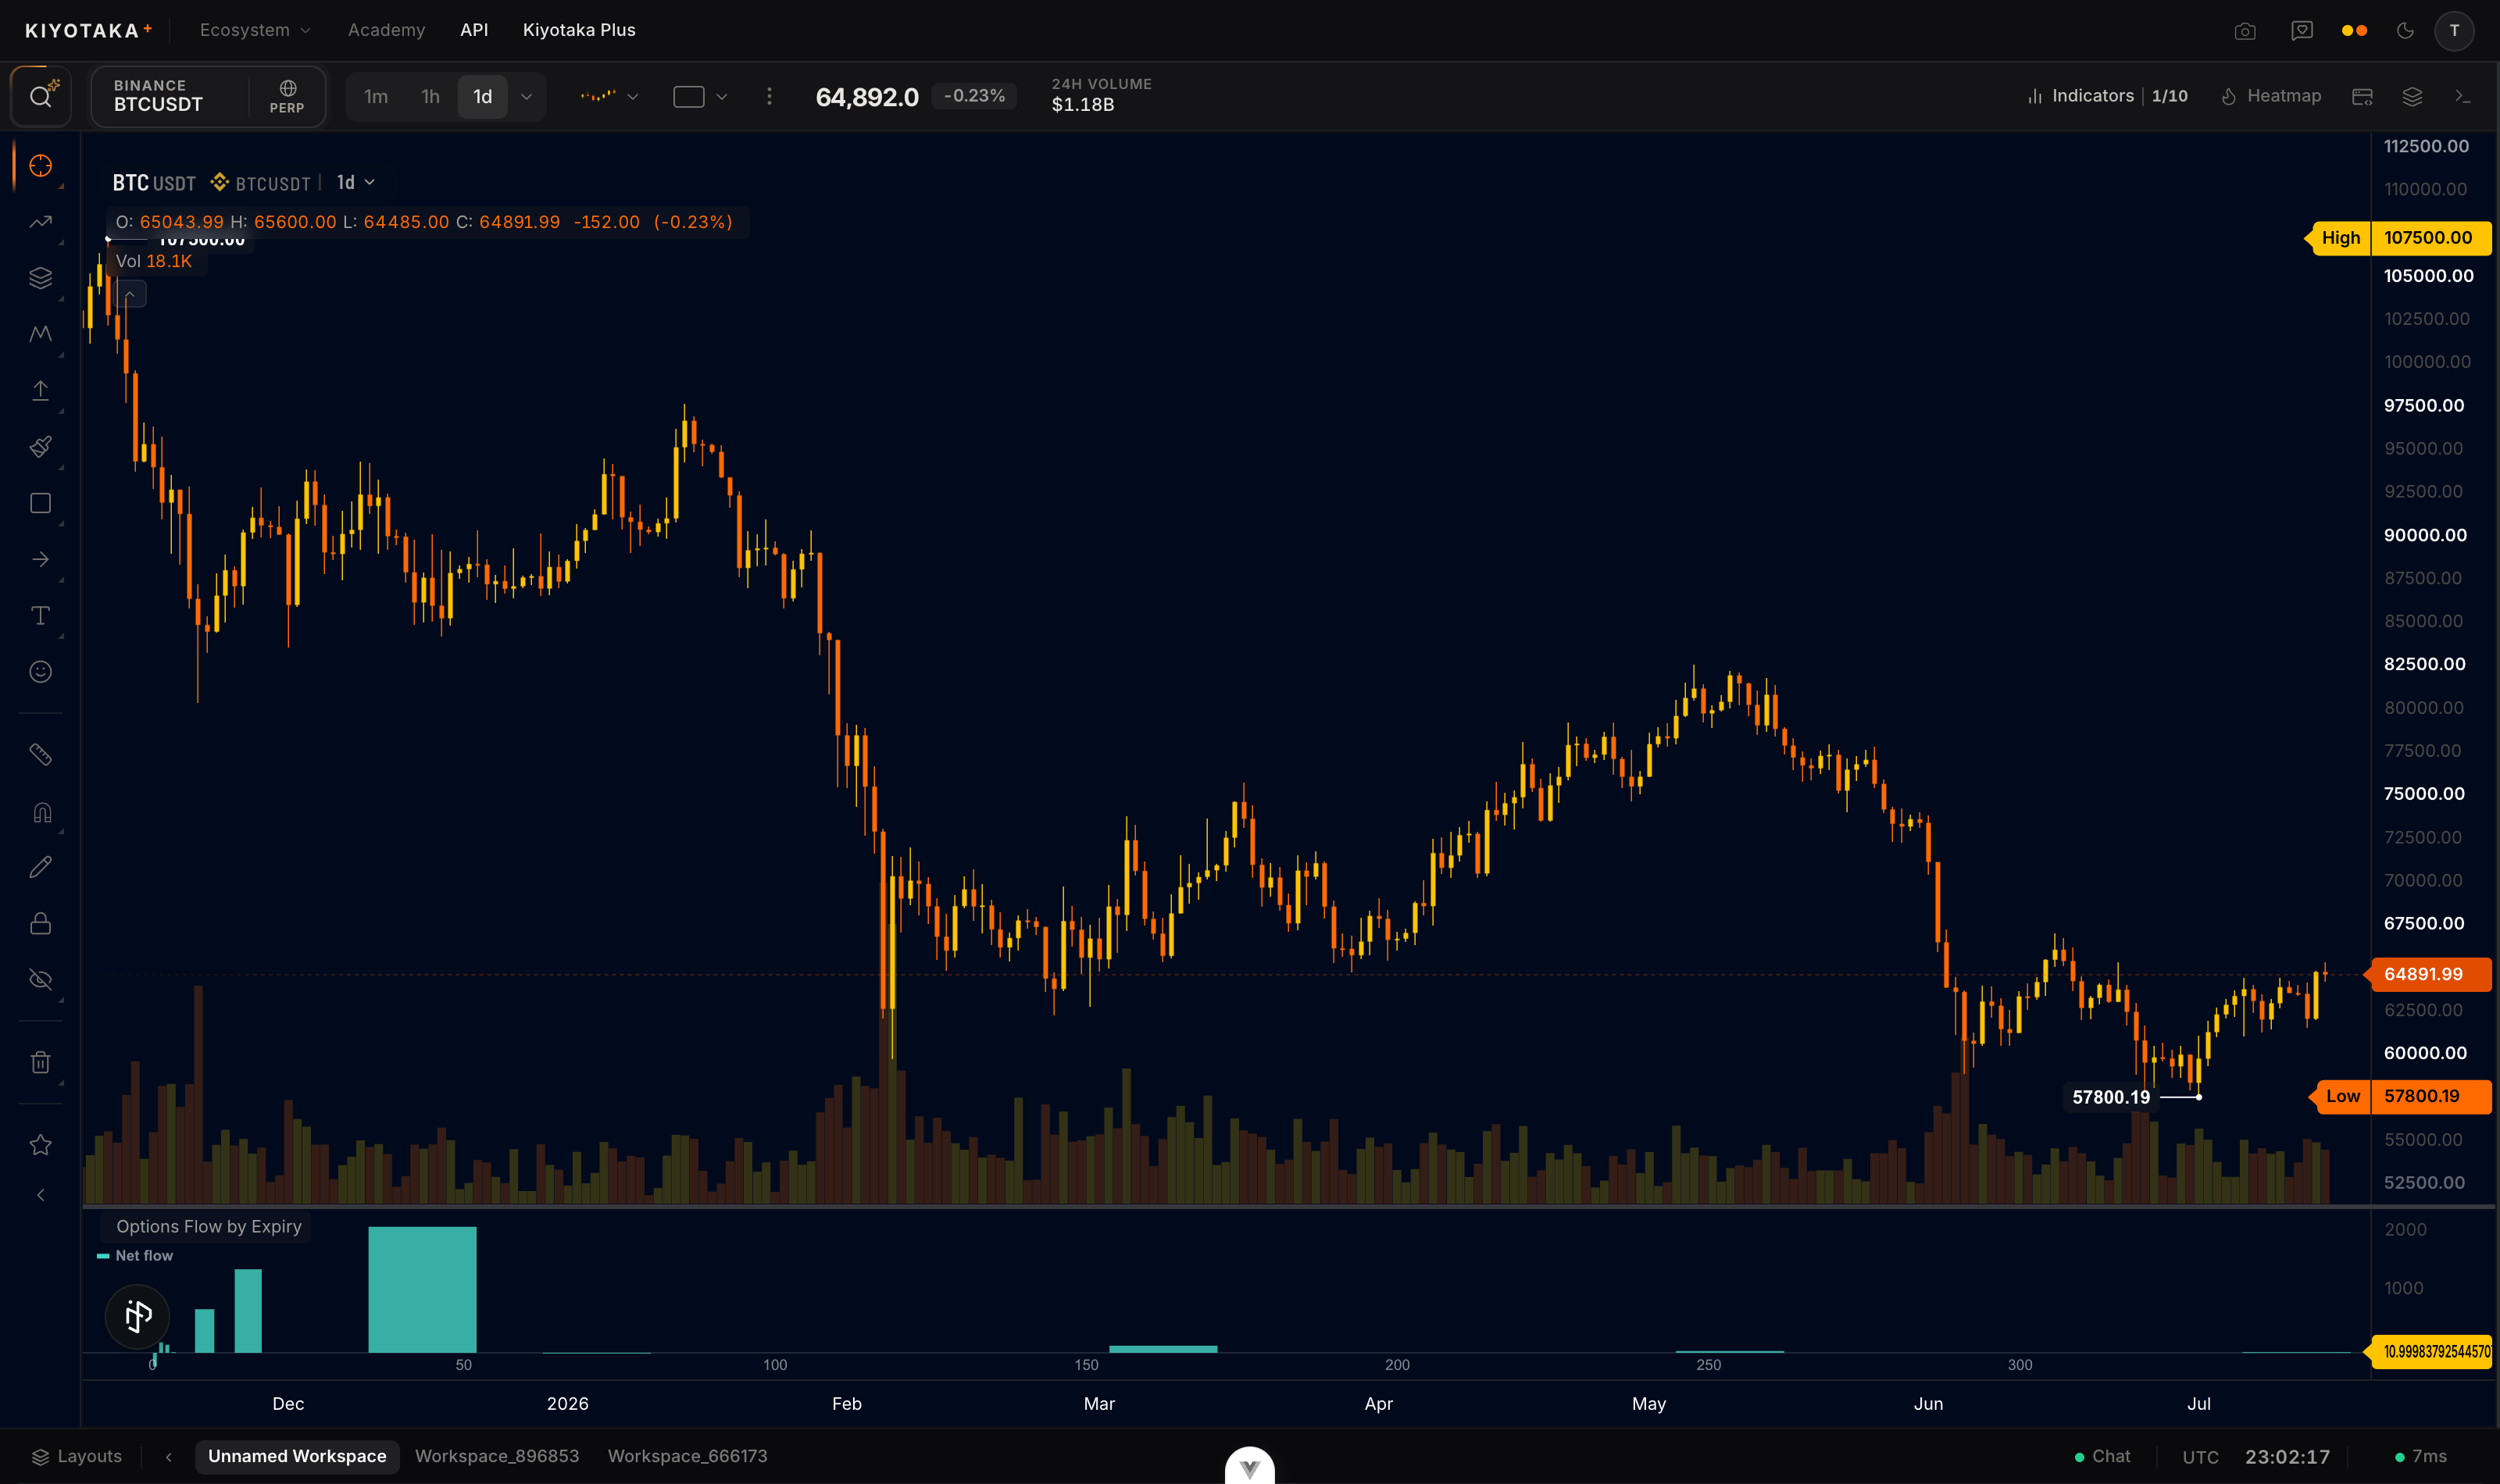
Add it to your chart
- Open Indicators in the top bar.
- Search for Options Flow by Expiry and click it once. The bars render in their own pane under the chart.
Fullscreen
Use the legend's maximize button, or double-click the pane, to fill the chart with it; Esc restores the previous layout. Maximized, the bars get denser ticks and larger text.
How to read it
The X axis is days to expiry: nearest expiries on the left, leaps on the right. Each bar is buys minus sells in coin units over the lookback window (1h, 4h, or 24h), colored by sign in the pane's theme tones (green for net buying, red for net selling under the default Aurora theme):
- Positive bar: that expiry is being net accumulated over the window.
- Negative bar: net sold.
- A bar at zero for a listed expiry means balanced two-way business, which is itself information: the expiry is active, but nobody is winning the tug of war.
- Watch the rotation: front-expiry flow flipping negative while a later expiry turns positive is a common signature of positions being rolled out in time.
The math
From the same Deribit options tape as the other flow panels (conventions), per expiry E:
barE=∑trades in E, window±size(+ buy, − sell)
Data is minute resolution, so the trailing window is honest to the minute.
Settings
| Setting | What it does | Default |
|---|---|---|
| Lookback | Trailing window the bars sum over: 1h, 4h, or 24h | 24h |
| Theme | Color theme for the pane, including the buy/sell bar tones (six choices) | Aurora |
| Refresh | Poll cadence in seconds (30 to 600) | 60 |
Assumptions
- Same taker-side, per-book coin-unit recovery as Options flow; blocks and multi-leg combos can carry a taker flag that doesn't reflect real intent.
- Buckets are minute resolution, so the lookback window is accurate to the minute, not the second.
- Expiry is parsed from the instrument's own listing code (08:00 UTC settlement), independent of your chart's time zone.
Reading it in context
- Heavy front-expiry buying is commonly read as an event or gamma play into the next expiry; consistent buying in the quarterlies as longer-horizon positioning.
- Pair it with top-expiry OI on the Dashboard to see whether flow is adding to the big shelf or unwinding it.
- Skeptical caveat: net volume hides gross size. 500 coins bought against 480 sold prints as +20, the same bar as one small lonely trade. Shorten the lookback to 1h to check the pressure is actually current before acting on a 24h number.