
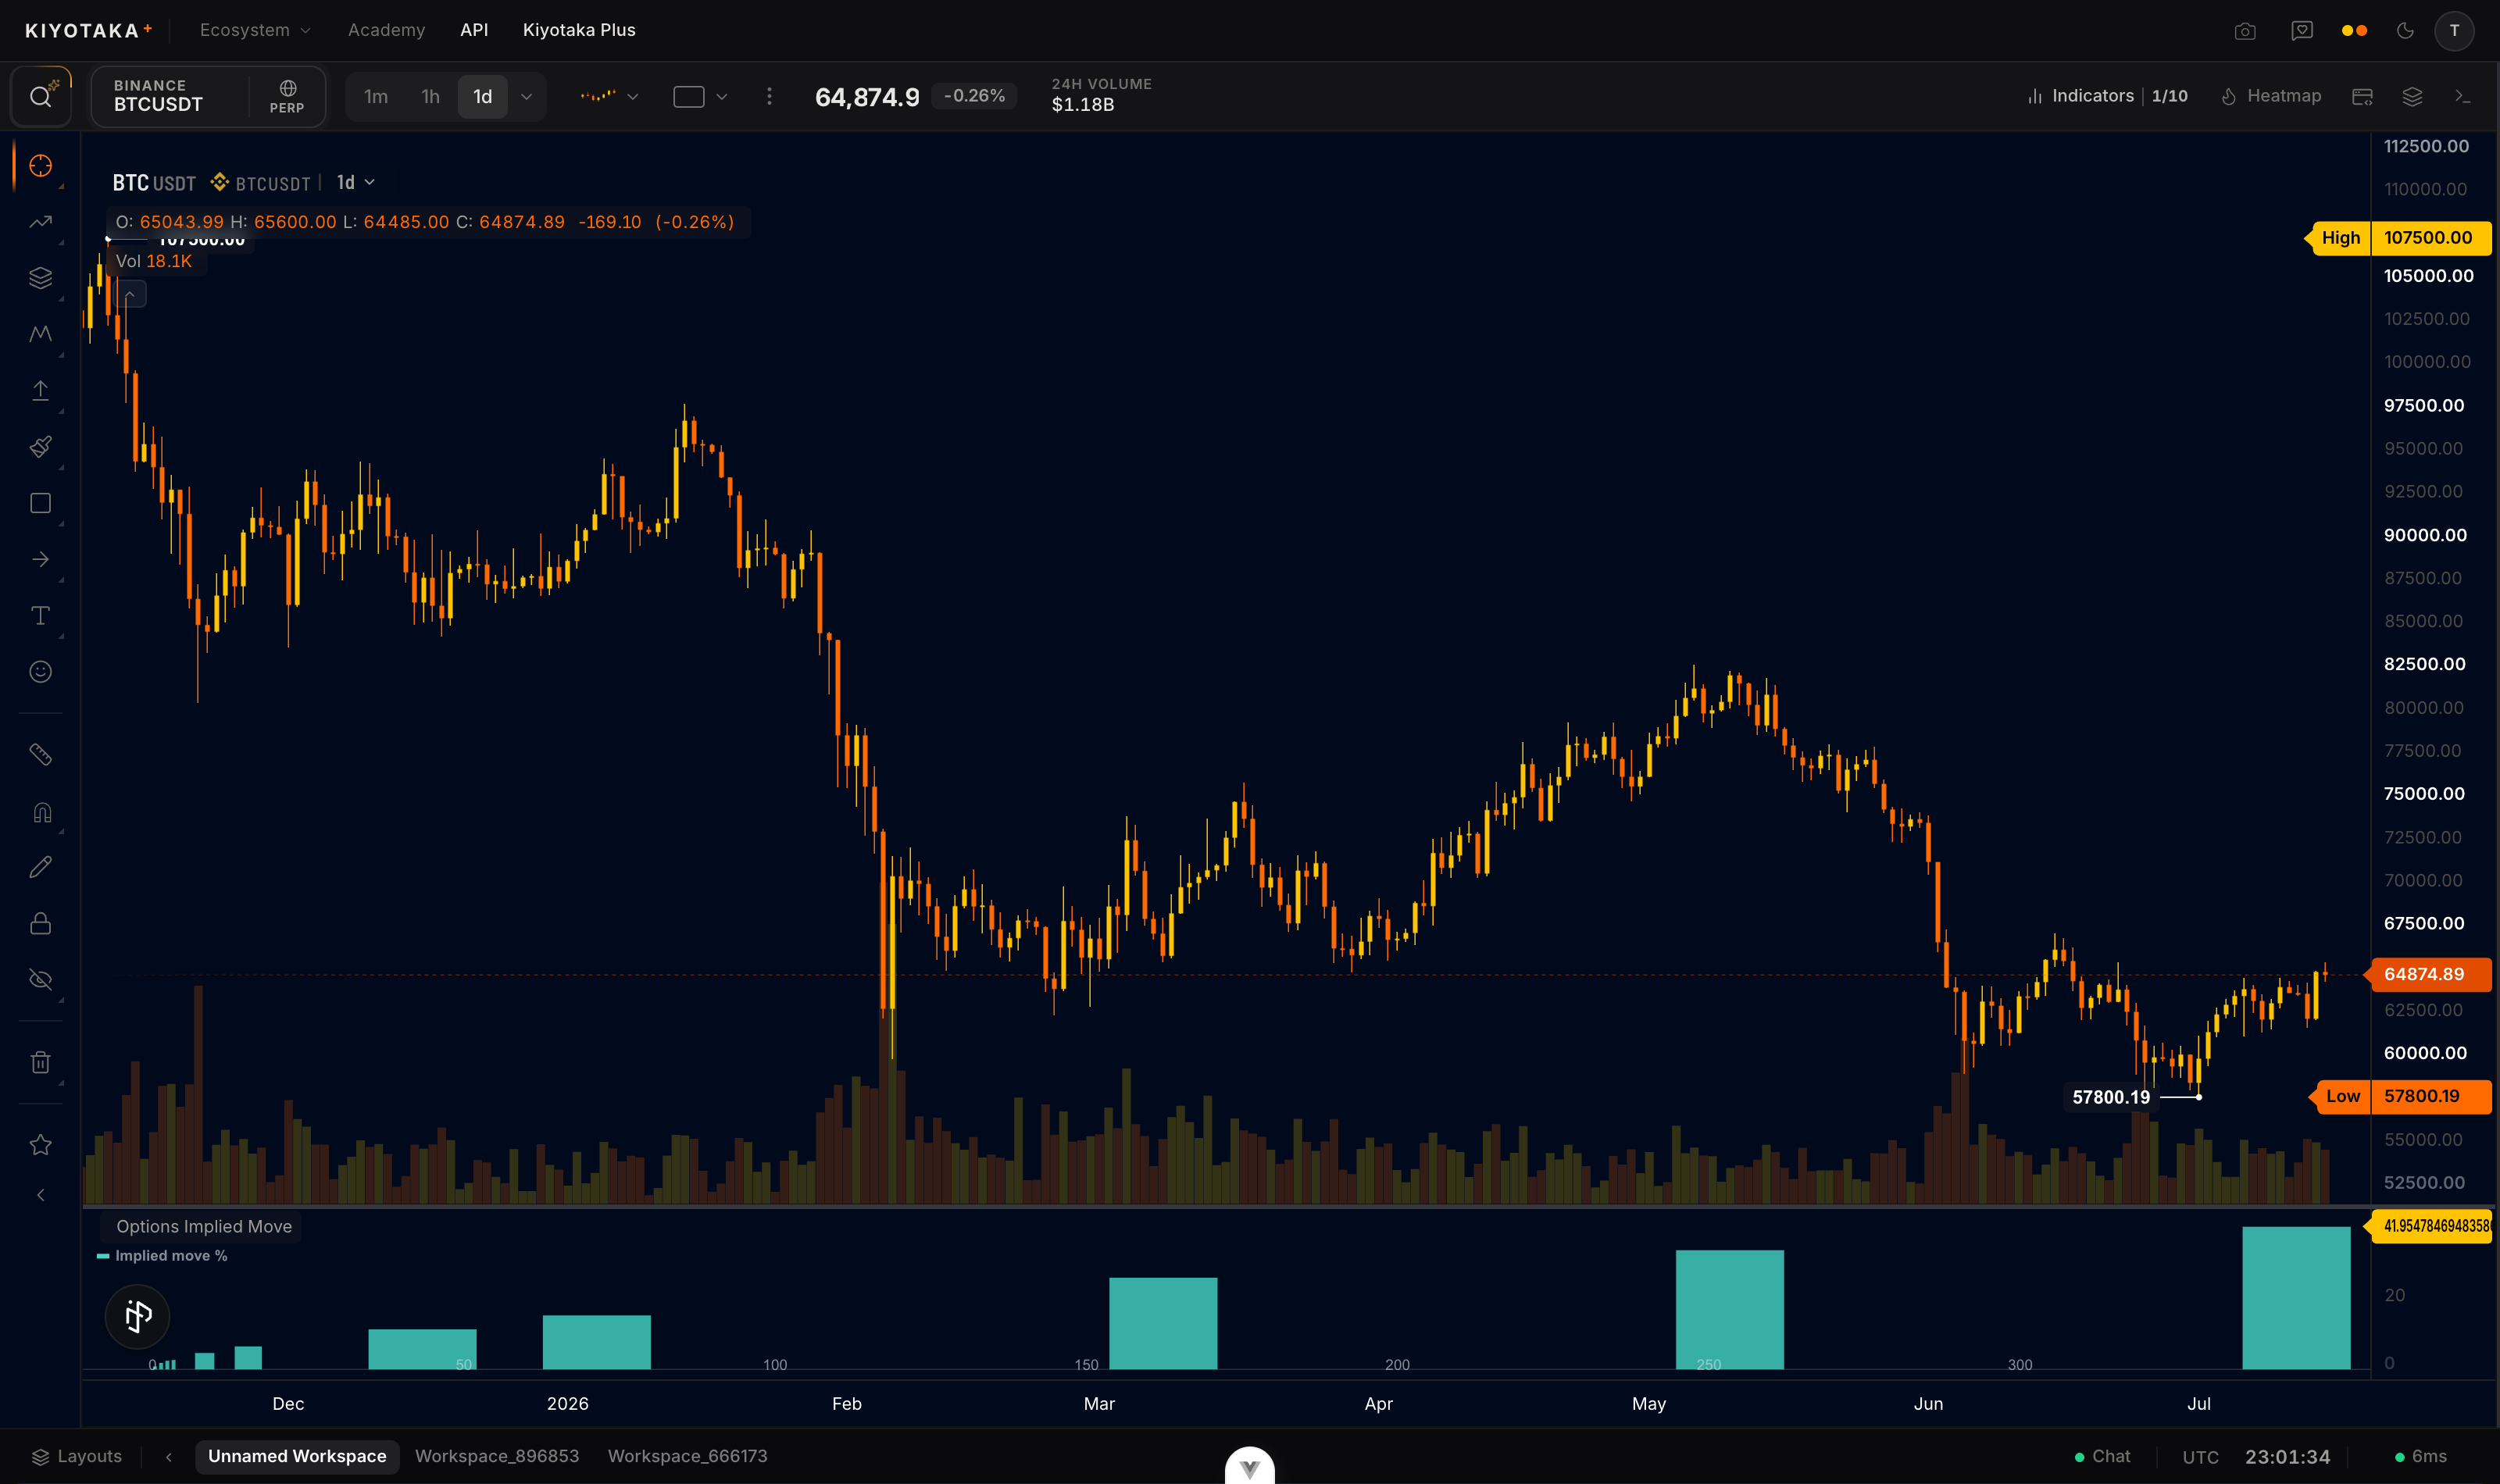
Implied move translates each expiry's implied volatility into the number you actually want: how big a move is the options market pricing in by that date? One bar per expiry, days to expiry along the X axis, each bar the expected move priced in by then: 0.85 times the at-the-money straddle, the figure the Options panel shows for the front expiry.
Add it to your chart
- Open Indicators in the top bar.
- Search for Options Implied Move and click it once. The bars render in their own pane under the chart.
Fullscreen
Use the legend's maximize button, or double-click the pane, to fill the chart with it; Esc restores the previous layout. Maximized, the bars get denser ticks and larger text.
How to read it
Each bar is the expected move by that expiry: 0.85 times the at-the-money straddle, the convention options desks quote. If the priced vol is right, price ends outside it about half the time; the wider 1σ range (68%), at-the-money vol times the square root of time, holds it about two-thirds of the time.
- Read the front bars for event pricing and the far bars for how much uncertainty the market carries further out.
- The Unit toggle switches between percent of each expiry's forward (default) and USD, the move in that forward's price.
The math
Per expiry (conventions), the expected move is 0.85 times the model at-the-money straddle on the expiry's forward:
expected move=0.85×2F×(2N(2σT)−1)
where F is the expiry's forward (the median underlying of its contracts), σ the mean of the call and put mark IV at the strike nearest F, N the standard normal cumulative distribution, and T the time to expiry in years of 365 days on the server's clock. The 1σ range (68%) is F × σ × √T, about 1.5 times the expected move on a short expiry.
Settings
| Setting | What it does | Default |
|---|---|---|
| Unit | Percent of each expiry's forward or USD | Percent |
| Theme | Color theme for the pane: series colors, fills, and accents (six choices) | Aurora |
| Fill style | Reserved for a future filled look; today's bars don't render an area fill | Soft |
| Refresh | Poll cadence in seconds (30 to 600) | 60 |
Assumptions
- The model straddle assumes lognormal returns at the at-the-money volatility; it says nothing about skew or the fat tails options markets actually price.
- Each expiry prices on its own forward, so the USD figure is the move in that forward's price: the number the Options panel and the Expected Move indicator print, whatever your chart's own series quotes.
- Refreshes on the pane's own poll, default 60 seconds, same as the rest of the suite.
Reading it in context
- Event pricing: the move priced into a post-CPI expiry shows what the market charges for the event, a number traders compare against their own view.
- Priced range as context: a level far outside the priced move is one the market prices as unlikely to be reached by that expiry.
- Cost of optionality: the bar is 0.85 times what an at-the-money straddle costs, so it doubles as a cost-of-optionality readout.
- Skeptical caveat: this is a statement of price, not a forecast. Under the model's own assumptions, realized moves exceed the expected one about half the time, and event days are exactly where the distribution is least normal.