
The surface is a strike-by-expiry matrix: rows are strikes with the one nearest spot highlighted, columns are the nearest live expiries with the soonest on the left, and every cell is colored and valued by the metric you choose. The GEX profile pools all expiries into one bar per strike; the surface splits that pool back out. It is the "where exactly" tool: which expiry does that wall actually belong to?
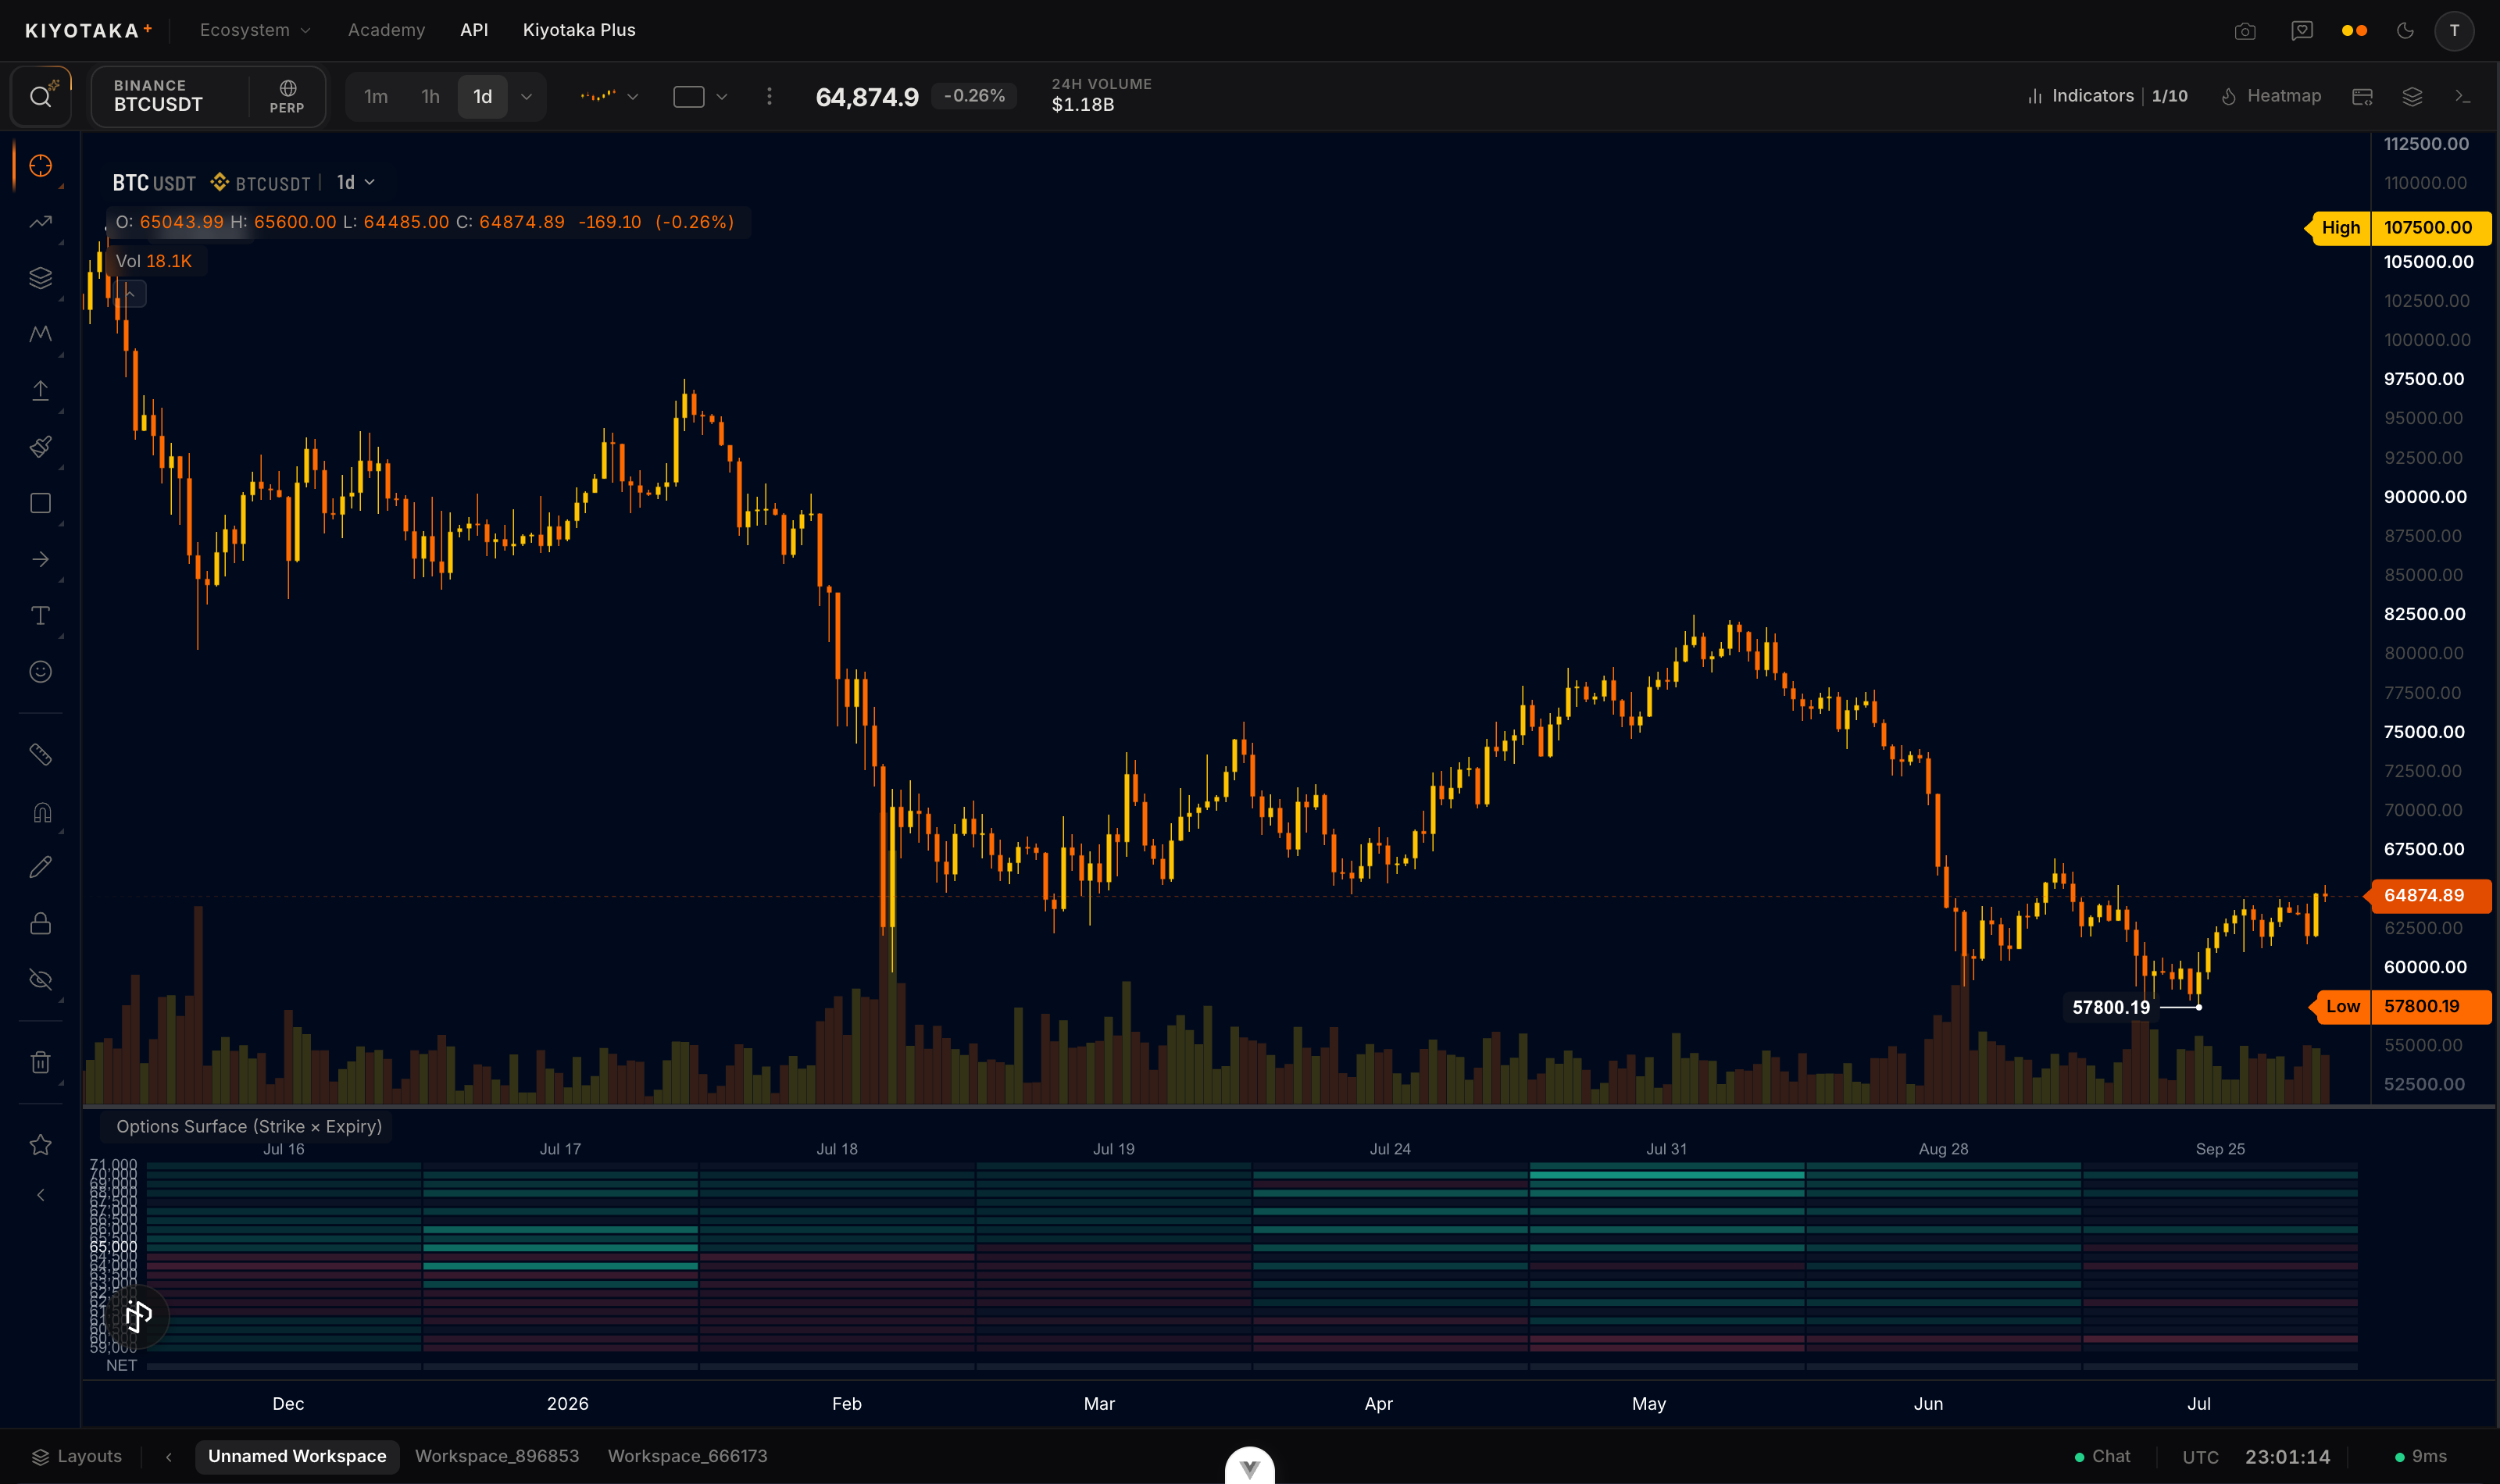
Add it to your chart
- Open Indicators in the top bar.
- Search for Options Surface and click it once. The matrix renders in its own pane.
Fullscreen
Use the legend's maximize button, or double-click the pane, to fill the chart with it; Esc restores the previous layout. Maximized, the matrix gets more room to breathe, with larger, easier-to-read cell text.
How to read it
The strike row nearest spot is highlighted, and one pinned row above the grid carries a full-chain summary value for each expiry column, so scan that summary first and cells second. The strike window setting bounds how far the strike rows extend from spot.
Five metrics can drive the cells:
- Net GEX (default): signed gamma exposure, dealer-naive convention. The hot cells are where dealers must hedge hardest.
- OI: open interest, unsigned. Raw position size with no model on top.
- IV: the OTM mark IV per cell, unsigned.
- DEX: delta exposure with natural delta signs.
- VEX: vega exposure, the cells that reprice most when volatility moves.
Read concentrations, not pixels: a level that shows up as a heavy strike row spanning several expiry columns is structural, while the same total sitting in just the front (nearest-expiry) column disappears when that expiry passes.
The math
Each cell applies the suite's standard per-contract math (conventions) at one strike and one expiry. In net GEX mode:
GEXK,T=∑contracts at (K,T)Γ×OI×S2×0.01
with dealer-naive signs (calls positive, puts negative). The other modes swap the cell value: plain open interest, the OTM mark IV, delta exposure with natural signs, or vega exposure.
Settings
| Setting | What it does | Default |
|---|---|---|
| Metric | net GEX, open interest, IV, DEX, or VEX per cell | Net GEX |
| Strike window | How far from spot the strike rows extend, percent | 20 |
| Theme | Color theme for the pane: series colors, fills, and accents (six choices) | Aurora |
| Refresh | Poll cadence in seconds (30 to 600) | 60 |
Assumptions
- Reads the same live chain snapshot as the rest of the suite, refreshed on the pane's own poll (default 60 seconds), not a tick feed.
- Rows are capped to the nearest 21 strikes to spot and columns to the nearest 8 live expiries, so a very wide strike window still gets trimmed before it renders.
- The pinned summary row is computed from the full chain for that expiry, not just the visible strike rows, so it can disagree with a hand-sum of the cells on screen.
Reading it in context
- Date the wall. When the profile shows a big call wall, find its row here: a weekly wall is gone Friday, a quarterly wall is structural. Its expiry column sets the wall's lifespan.
- Outliers in IV mode. A single cell priced away from its neighbors is either an event strike someone is paying up for, or a stale quote. Worth knowing which before reading into it.
- Pin candidates in OI mode. The biggest near-money cell in the front (nearest-expiry) column is the strike most often watched as a potential pin into expiry.
- Skeptical caveat: a matrix invites over-reading. One bright pixel is not a thesis; read concentrations, not single cells.