
The vol matrix is a compact table, one row per expiry with the front row highlighted, five numbers per row: ATM IV, two risk reversals, a butterfly, and open interest. It is the quant's cheat sheet: the whole vol structure in plain numbers, no interpolation squinting.
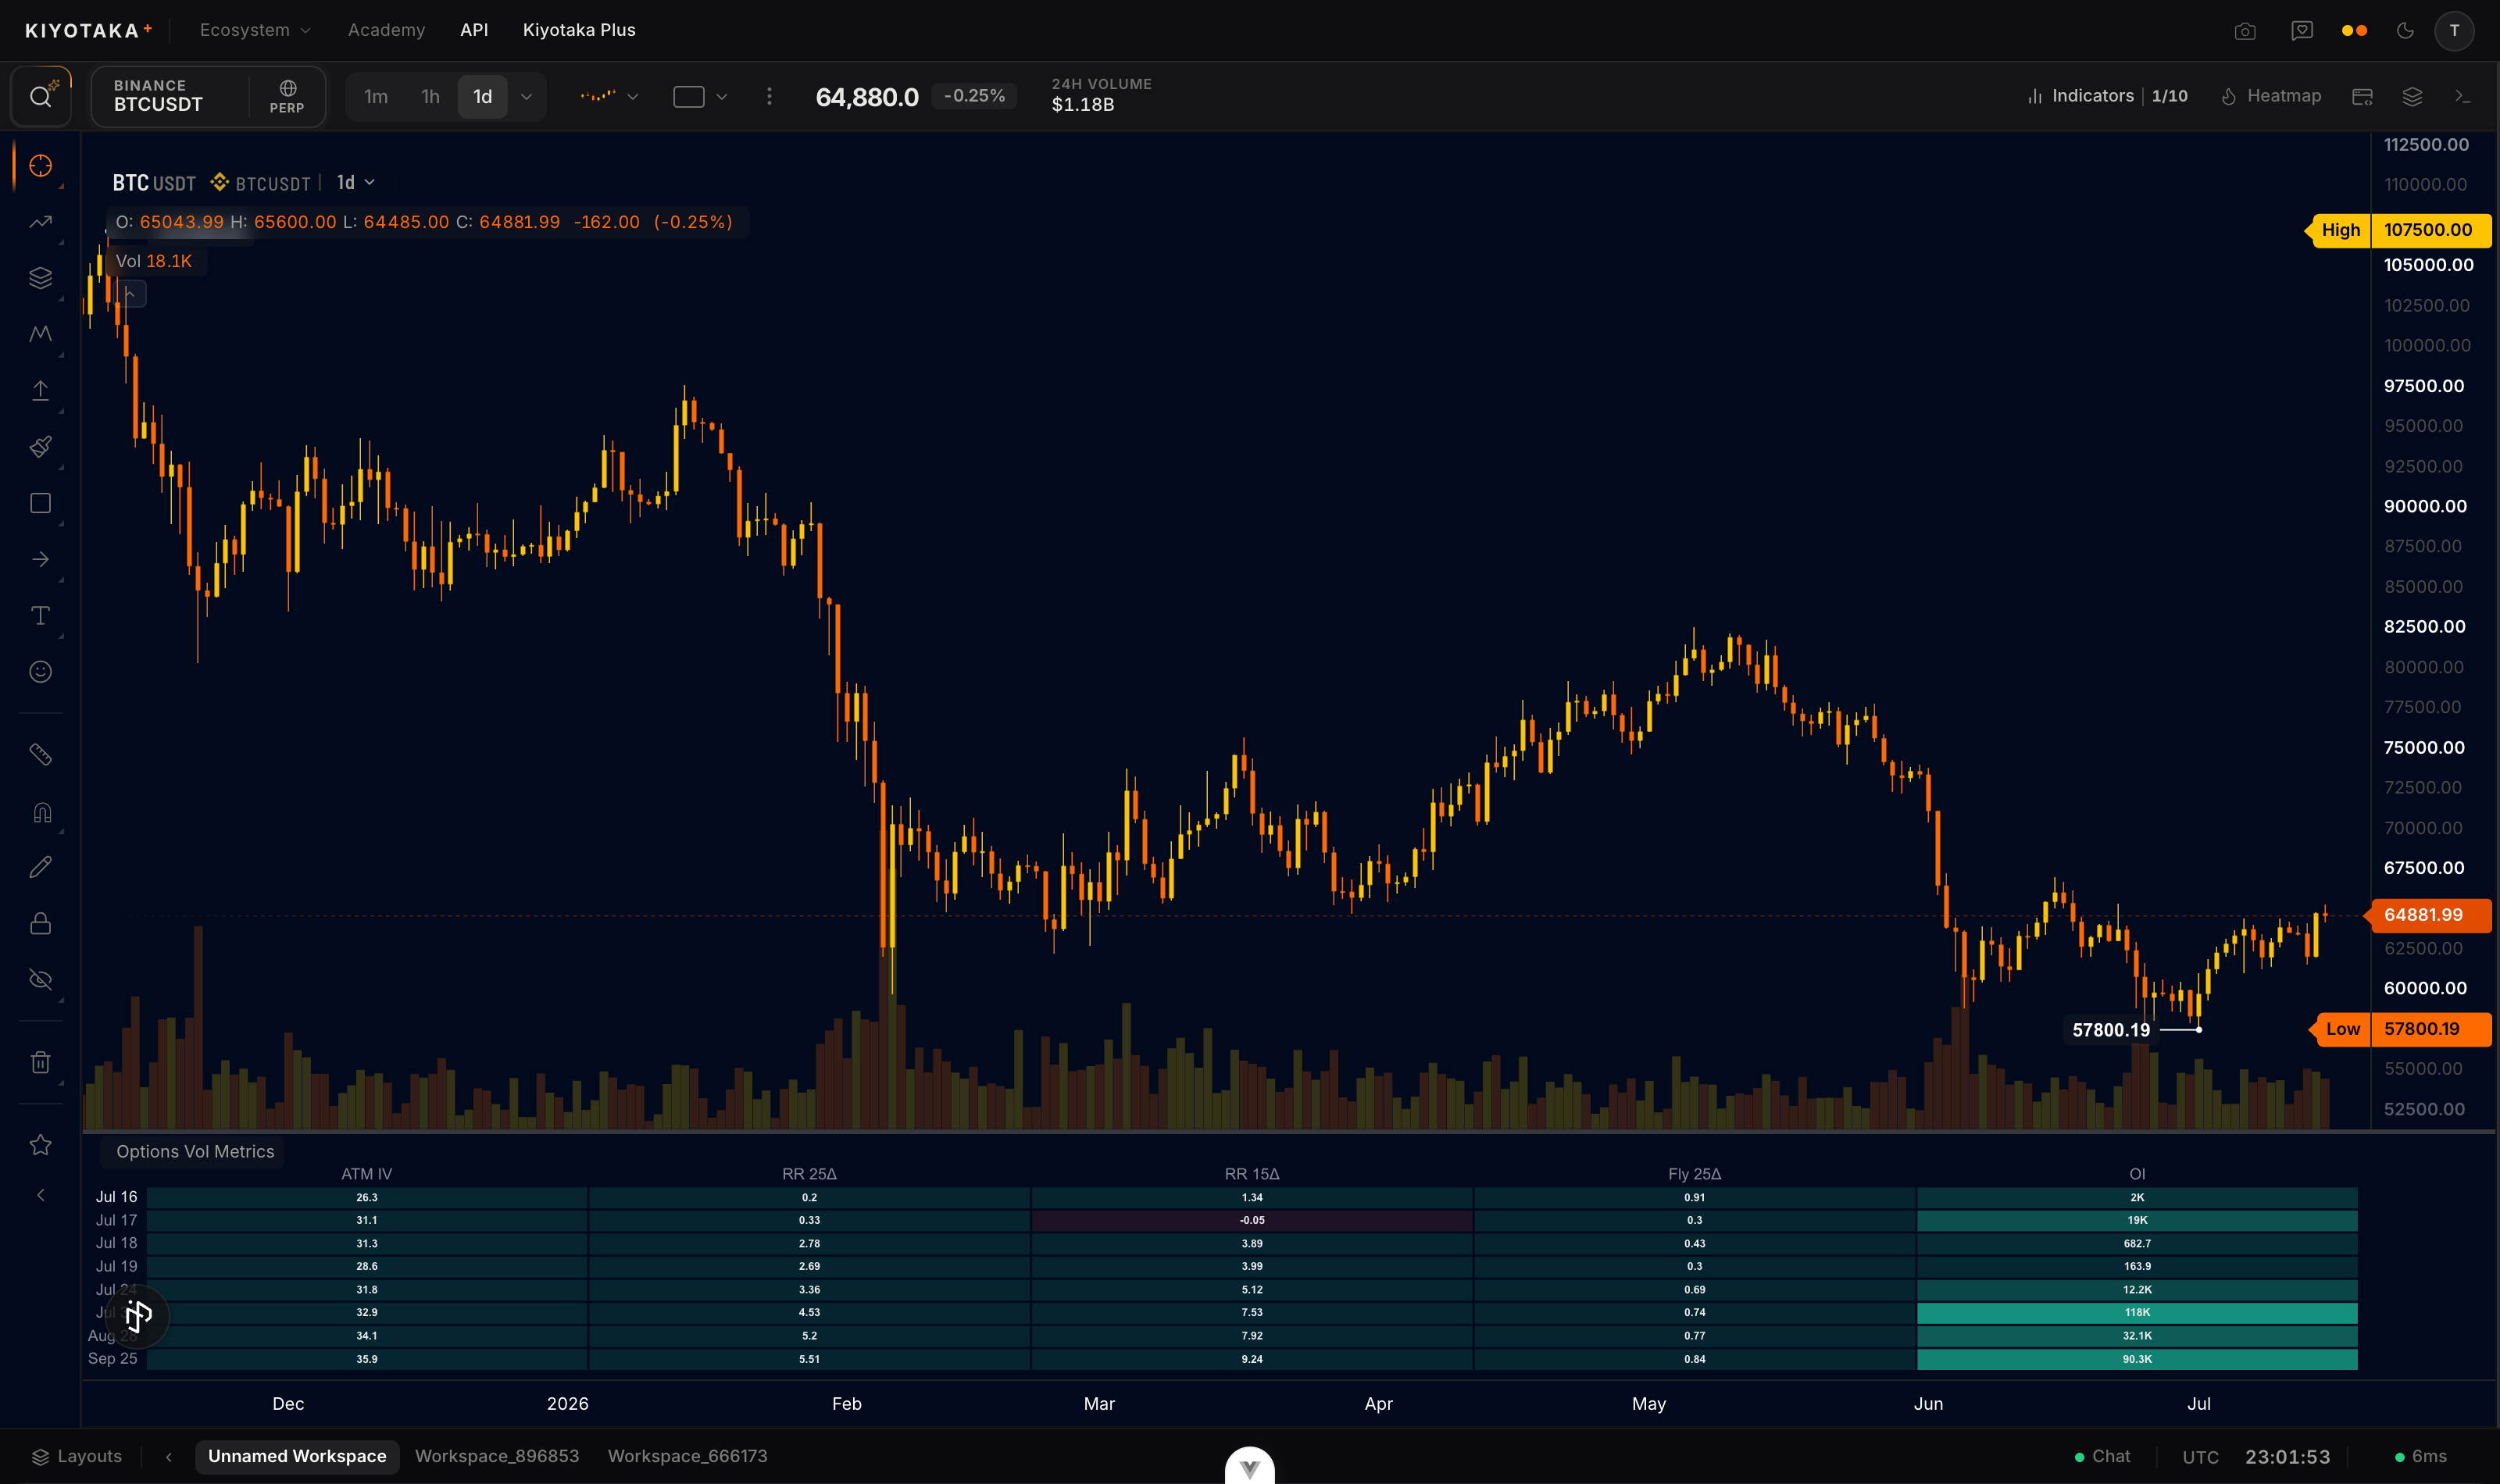
Add it to your chart
- Open Indicators in the top bar.
- Search for Options Vol Matrix and click it once. The table renders in its own pane.
Fullscreen
Use the legend's maximize button, or double-click the pane, to fill the chart with it; Esc restores the previous layout. Maximized, the table gets larger text, easier to scan across all five columns.
How to read it
- ATM: at-the-money IV in vol points, the headline "how much movement is priced" per expiry.
- RR25: the 25-delta risk reversal, put IV minus call IV. Positive means the downside is bid over the upside (puts pricier); negative means calls are chased.
- RR15: the same at 15 delta, the further and more tail-sensitive wing. When RR15 disagrees with RR25, the extreme tails are telling their own story.
- FLY25: the 25-delta butterfly, the average of the two 25-delta wing IVs minus ATM: how expensive tails are versus the middle.
- OI: that expiry's total open interest in coin units, your gauge of how much weight the row deserves.
The math
Every value is read from that expiry's OTM-stitched smile (conventions):
RRΔ=IVΔput−IVΔcall
FLY25=21(IV25Δcall+IV25Δput)−IVATM
Some platforms quote RR with the opposite sign; check the convention before comparing across venues.
Settings
| Setting | What it does | Default |
|---|---|---|
| Theme | Color theme for the pane: series colors, fills, and accents (six choices) | Aurora |
| Refresh | Poll cadence in seconds (30 to 600) | 60 |
Assumptions
- Reads the same live chain snapshot as the rest of the suite, refreshed on the pane's own poll (default 60 seconds).
- Rows are capped to the nearest 8 live expiries by days to expiry.
- A cell with no resolvable quote (for example a wing with no listed instrument at that delta) is left blank rather than shown as zero.
Reading it in context
- Scan the RR25 column top to bottom for the skew term structure at a glance: positive readings say puts are bid (fear priced in) at that horizon, negative say calls are bid (upside chased); watch how the sign migrates from front rows to back rows.
- FLY rising means tails are bid: the market is paying for surprise in either direction, not picking a side.
- Let the OI column filter the table. It tells you which rows deserve attention at all.
- Skeptical caveat: rows with tiny open interest produce noisy wing stats. Read RR and FLY on the liquid rows.