
The term structure plots each expiry's at-the-money IV against its days to expiry: the volatility yield curve. One glance answers whether the market is pricing a near-term event, and whether that premium is still building or already bleeding out.
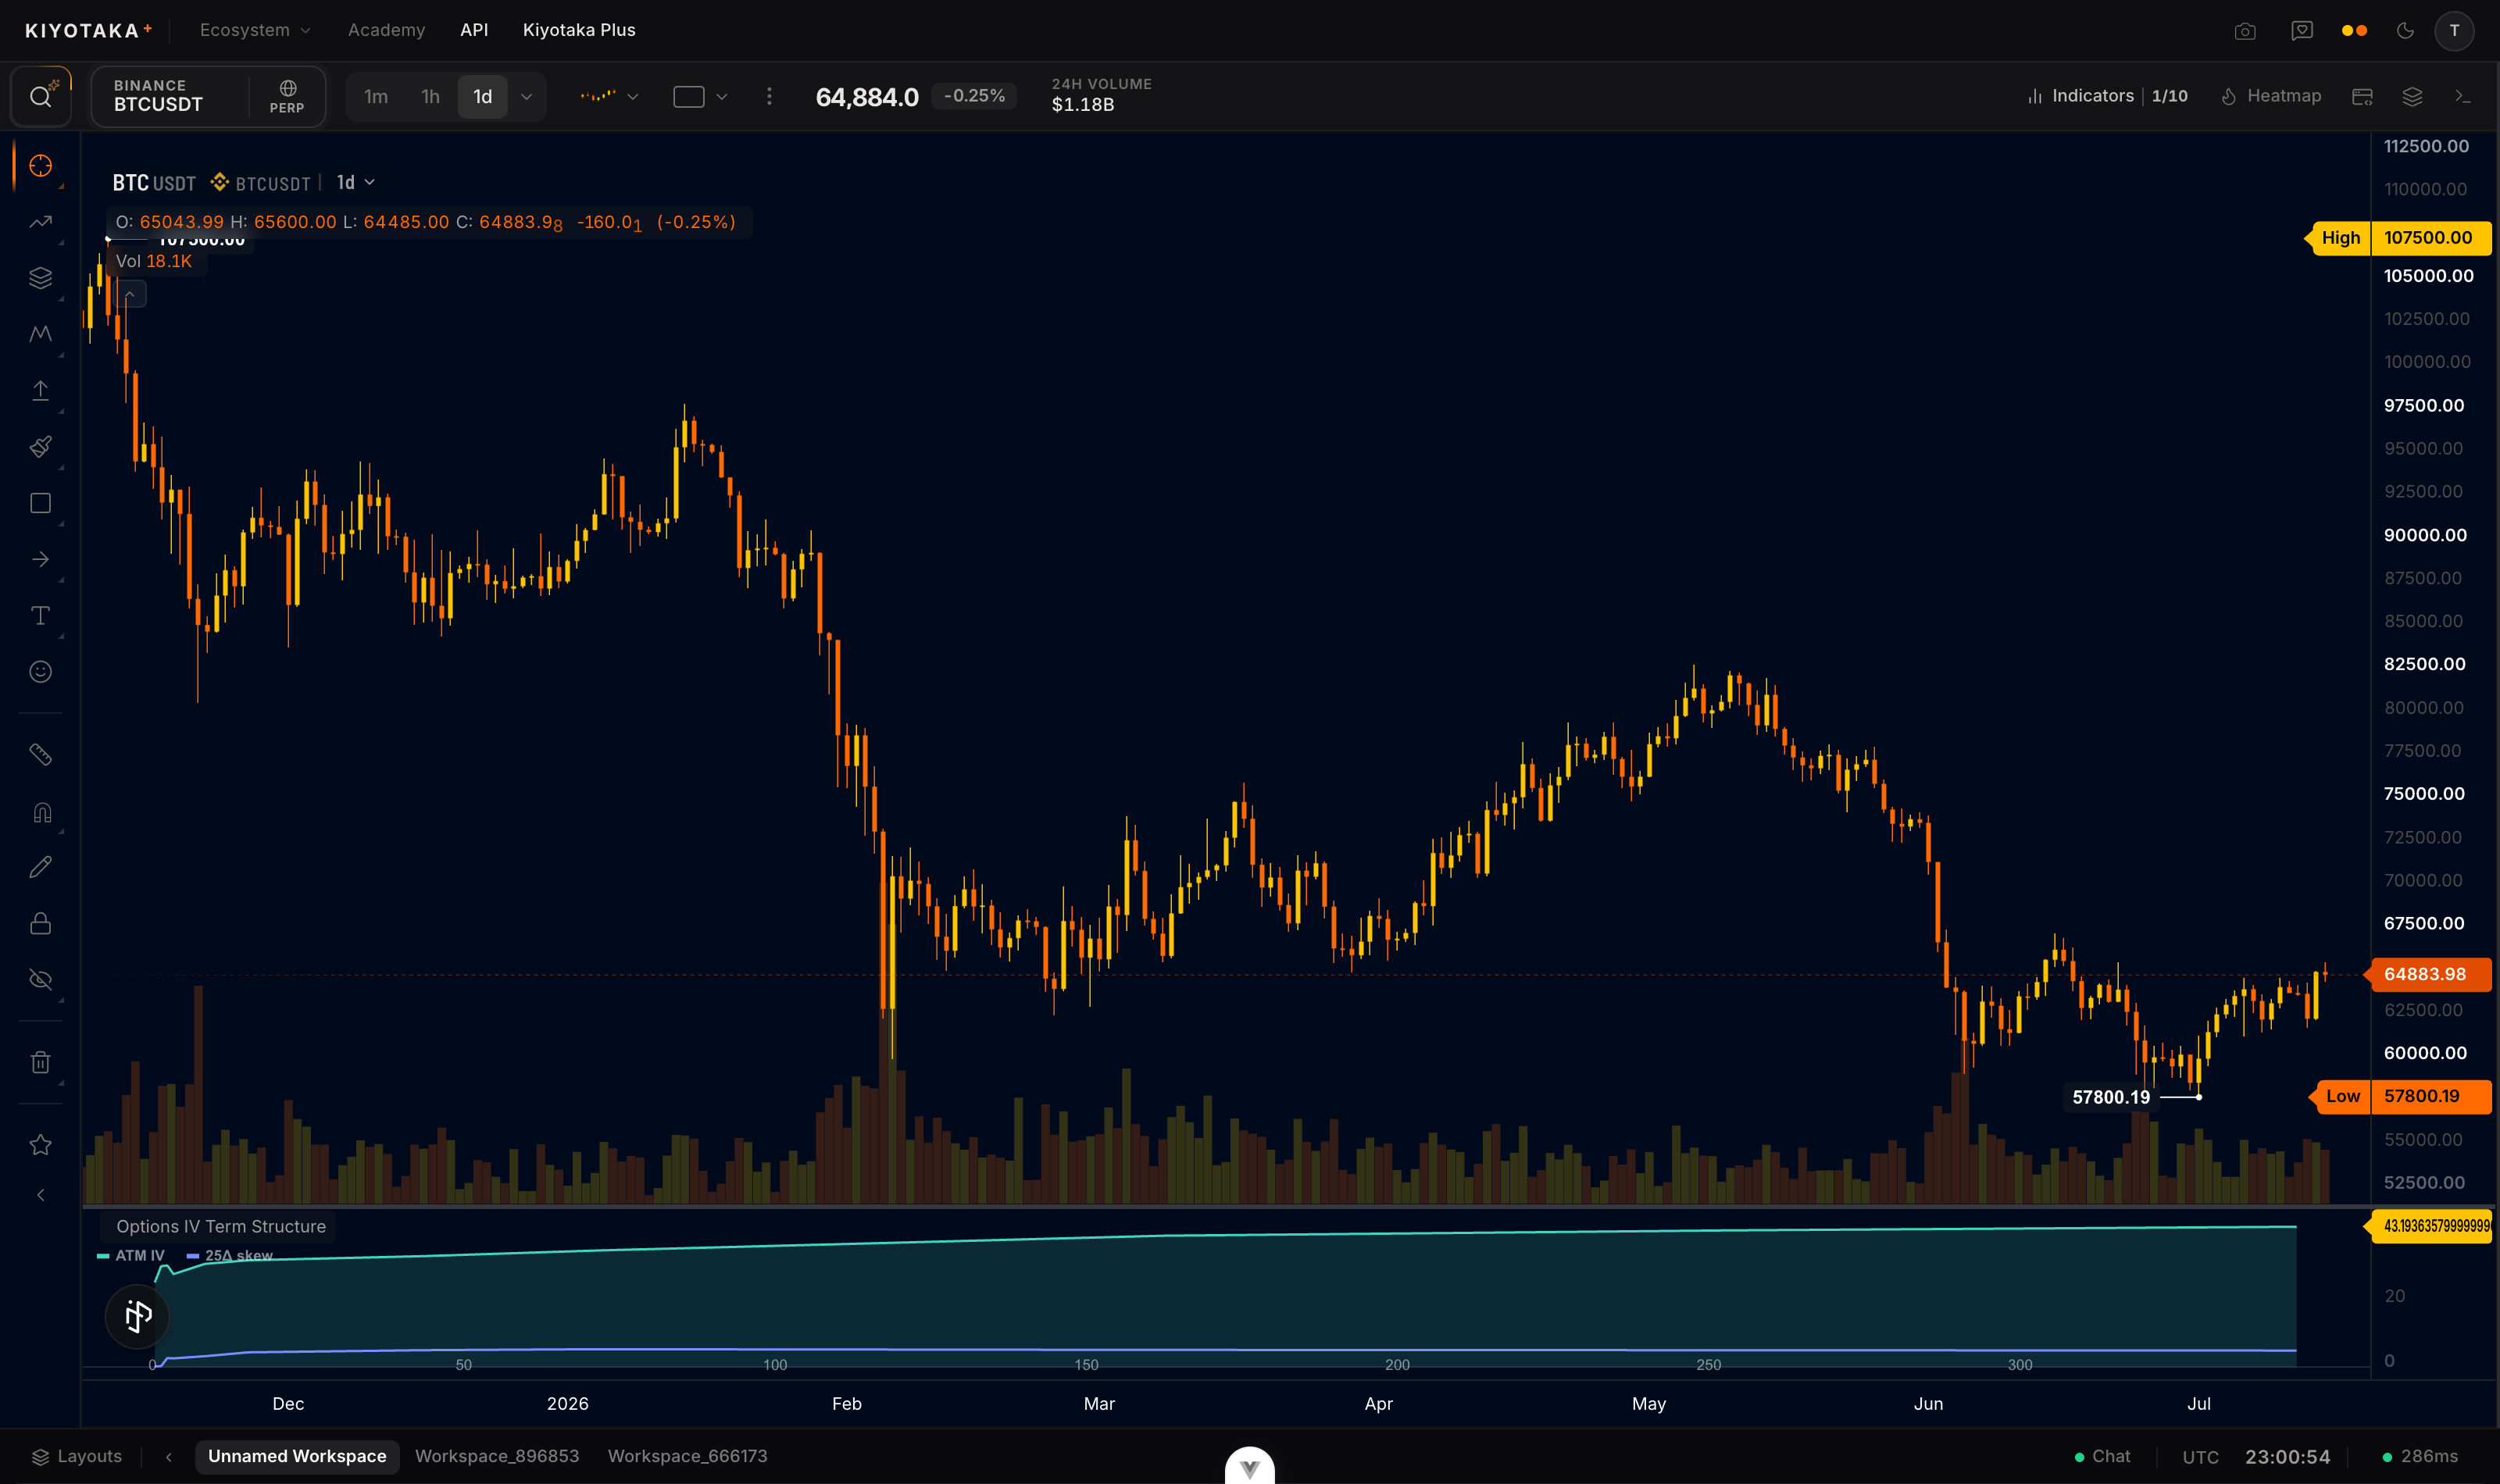
Add it to your chart
- Open Indicators in the top bar.
- Search for Options Term Structure and click it once. The curve renders in its own pane.
Fullscreen
Use the legend's maximize button, or double-click the pane, to fill the chart with it; Esc restores the previous layout. Maximized, the curve gets denser ticks and larger text, so the front-expiry detail is easier to read.
How to read it
- Upward sloping (contango) is normal. More time means more uncertainty, so longer expiries usually carry higher IV.
- An inverted front stands out. When the nearest expiries trade above the back, the market is commonly read as pricing a near-term event or as in stress right now.
- The skew series adds direction. With Show skew on, a second series plots each expiry's 25-delta risk reversal: put IV minus call IV, so positive means the downside is bid. It tells you whether the priced event is feared to the downside or chased to the upside.
The math
ATM IV per expiry is read from that expiry's OTM-stitched smile, interpolated at its own forward; the conventions page covers stitching, forwards, and sign conventions. The optional skew series is the 25-delta risk reversal:
RR25=IV25Δput−IV25Δcall
Positive means the downside is bid (puts pricier than calls); some platforms quote the opposite sign, so check the convention before comparing across venues.
Settings
| Setting | What it does | Default |
|---|---|---|
| Show skew | Adds the per-expiry 25-delta risk reversal series | On |
| Theme | Color theme for the pane: series colors, fills, and accents (six choices) | Aurora |
| Fill style | Area under the curves: none, soft, gradient, or by sign | Soft |
| Refresh | Poll cadence in seconds (30 to 600) | 60 |
Assumptions
- ATM IV per expiry comes from the same OTM-stitched smile the IV smile page draws, read at that expiry's own forward.
- Expiries are capped to the nearest 12 by days to expiry, so far-dated listings don't crush the tradeable front of the curve.
- The contango/backwardation label only flips outside a small deadband around flat (about half a vol point), so it does not chatter on noise between two nearly flat expiries.
Reading it in context
- Inversion appearing is commonly read as event premium loading. The calendar shows what lands inside those front expiries; the curve can price a date before the news does.
- Inversion collapsing after the event is vol crush: front IV falls back toward the back of the curve as the event premium drains.
- Skeptical caveat: the front point is hypersensitive within hours of expiry because its time denominator is tiny. Read the 0-2 day points with that in mind before calling a curve inverted.