
This page is for you if you have never traded an option. It explains, in plain words, the ideas behind the options indicators and every term their settings use. There is no math here. When you want the formulas, read How the options math works.
What an option is
An option is a contract. It gives its buyer the right, but not the duty, to buy or sell something at a set price by a set date. That something is the underlying: a coin such as BTC, a futures contract, or a US stock or ETF.
- The set price is the strike, the price an option is written at.
- The set date is the expiry, the day the option ends.
- The price the buyer pays for the option is the premium. The seller keeps it, whatever happens next.
There are two kinds of option:
- A call is the right to buy at the strike. It gains when price rises above its strike.
- A put is the right to sell at the strike. It gains when price falls below its strike.
An example: a BTC call with a strike of 100,000 that expires on Friday. If BTC trades at 105,000 on Friday, the right to buy at 100,000 is worth about 5,000. If BTC trades at 95,000, nobody wants to buy at 100,000, so the call ends worth nothing. Its buyer loses the premium and no more.
Each market lists many strikes and many expiries at once. That list is the options chain. In every options indicator, the rows under Options chain pick which of those options the indicator reads.
Open interest and volume
Two counts tell you where options traders are busy:
- Open interest (OI) counts the options still open: opened and not yet closed or expired. A strike with high open interest is a price many traders hold a position on.
- Volume counts the options traded in a period. Volume shows activity. Open interest shows what is still standing after it.
The put/call ratio divides puts by calls, by open interest or by volume. Above 1 means more puts than calls.
Implied volatility
A premium depends on how far the market thinks price will move before the expiry. A bigger expected move makes options cost more, because a big move makes them more likely to pay off.
Implied volatility (IV) turns option prices back into that expected move. It is quoted as a yearly percent, the yearly move option prices expect. High IV means expensive options and a nervous market. Low IV means cheap options and a calm one.
IV changes from strike to strike and from expiry to expiry, and the suite draws both:
- ATM (at the money) is the strike nearest the current price. ATM IV is the headline IV of one expiry.
- A smile draws IV across the strikes of one expiry. It usually curves up at both ends, because options far from the price carry extra premium for crashes and squeezes.
- The term structure draws ATM IV across expiry dates. Later expiries usually carry higher IV. When the nearest expiries trade above the later ones, the market is pricing a near event or stress right now.
- The expected move, or implied move, is how far option prices expect the price to travel by a given expiry.
- DVOL is Deribit's volatility index for BTC or ETH: how much its option prices expect the coin to move over the next 30 days, as a yearly percent.
- A tenor is how far out the options end, such as 1W (one week), 1M (one month) or 3M.
Who sells options: the dealers
Most options trade against market makers: firms that quote prices all day and take the other side of trades. The options suite calls them dealers. When you buy a call, a dealer usually sells it to you.
Dealers do not want to bet on direction. So they hedge: they buy or sell the underlying until a move in price no longer hurts them. That hedge goes stale as soon as price moves, so dealers keep trading the underlying all day. On busy strikes, that trading is big enough to push price around:
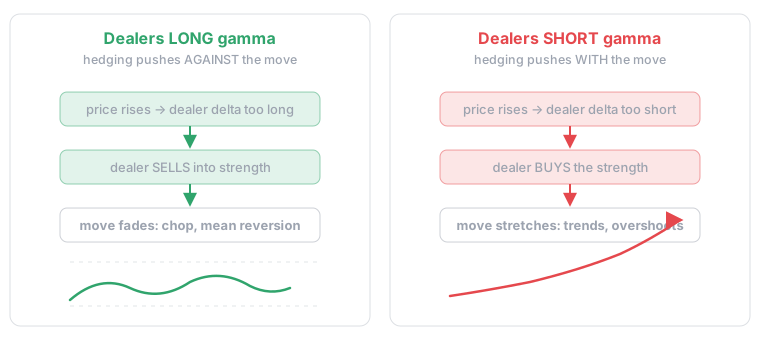
- When dealers hold options, they are long gamma. Their hedging sells into rallies and buys dips, which tends to calm moves.
- When dealers are short options, they are short gamma. Their hedging buys into rallies and sells into dips, which tends to speed moves up.
Nobody publishes what dealers hold, so the suite has to estimate it. The GEX basis setting picks how:
- Dealer flow, the default, reads which side of each option dealers hold from real trades. An option with too few trades uses the Open interest shortcut instead, and Show OI fallback % puts that share in the legend.
- Open interest is the common shortcut. It assumes traders buy puts for protection and sell calls for income, so dealers hold the other side: calls count plus, puts minus. Pick it to compare with sites that use the shortcut.
Dealer flow reads Deribit's trades, so it works when an indicator reads Deribit alone. On other exchanges, CME futures and US stocks, the suite uses the Open interest shortcut and the GEX basis row does not show.
Delta, gamma and vega
Option traders measure how an option reacts with a few numbers called the greeks. The suite uses five of them:
- Delta is how much an option's value moves when the price moves. A call's delta runs from 0 to 1, a put's from 0 to minus 1. Delta also names how far an option sits from the price: a 25 delta option moves about a quarter as much as the price, and sits well away from it, above the price for a call and below it for a put.
- Gamma is how fast delta changes as price moves. It is highest near the strike and close to expiry. Gamma is what keeps dealers trading: every move changes their delta, so their hedge has to change too.
- Vega is how much an option's value changes when IV moves one point.
- Charm is how dealer hedges drift as time passes.
- Vanna is how dealer hedges shift when volatility moves.
GEX, DEX and VEX
The exposure numbers add one greek up across every open option at a strike, or across the whole chain, and turn it into dollars:
- GEX, gamma exposure, is how much hedging dealers must do as price moves, in dollars for each 1% move. Net GEX keeps the sign: above zero, dealer hedging may slow price down. Below zero, it may speed price up. Abs GEX drops the sign: the total GEX at each strike, calls and puts added up.
- DEX, delta exposure, is how long or short the open options are, in dollars. It counts each option's own delta: calls plus, puts minus.
- VEX, vega exposure, is how much dealers gain or lose when volatility moves, in dollars for each volatility point.
- GEX + VEX on the Options Heatmap shows GEX or VEX at each strike, whichever is stronger, in percent of the top.
Add net GEX up across the whole chain and its sign gives the dealer regime: long gamma above zero, where hedging calms moves, and short gamma below zero, where it speeds them up.
The key levels
On a chart, all of this turns into a few prices traders watch:
- The call wall is the strike with the most open calls. Many traders read it as resistance.
- The put wall is the strike with the most open puts. Many traders read it as support.
- The gamma flip is the price nearest the current one where dealer hedging switches between calming moves and speeding them up. On the Dealer flow basis its tag reads Dealer-flow flip. Many traders treat a close through the flip as a change of regime.
- Max pain is the strike where the chosen expiries' options would pay their holders the least if price ended there. It is watched mostly into big expiries.
On the Dealer flow basis, the Options GEX profile picks its walls by dealer hedging instead of open interest: the call wall is the strike with the largest net GEX above zero, and the put wall the largest below zero.
The Options Heatmap can also draw a Cumulative GEX zero line: the strike where net GEX, added up from the lowest strike, crosses zero. It is not the gamma flip, which works GEX out again as if price moved to each level.
Node levels: Top, Gate, Floor and Ceiling
The heatmap's Node levels name the strongest strikes of the latest bar on the price scale:
- Top ★ is the biggest. Price often slows or stalls near it.
- Gate is the biggest between the price and the Top, if it is at least 35% of the Top.
- Floor and Ceiling are the biggest below and above the price.
Three settings tune them. Node % adds each level's size, as a percent of the Top, to its tag. Node change adds how much a level grew or shrank over a time you pick. Low nodes shows, dims or fades the weak strikes, those under 15% of the Top in their bar.
The Options GEX profile draws a Top line too: the strike with the most dealer hedging, the largest net GEX either way.
Skew and the 25 delta risk reversal
Calls and puts equally far from the price rarely cost the same. Skew is the gap in implied volatility between them.
The 25 delta risk reversal (25Δ RR, or RR) measures that gap at 25 delta. It says how many volatility points more traders pay for calls than for puts equally far from the price. Below zero, puts cost more, as traders pay for protection against a drop. Above zero, calls cost more, as traders chase the upside.
Some sites quote the risk reversal with the opposite sign, so check the sign before you compare. The Skew indicator's Delta setting reads the gap at 25 delta (the default) or at 15 delta, further from the price.
Flow: what trades right now
Open interest shows the positions that exist. Flow shows what traders are doing right now:
- Net flow is options bought minus options sold.
- Net premium is the dollars paid for options bought minus sold.
- Delta flow is the net direction traded in a bar, in dollars.
- Gamma flow is the hedging pressure a bar's trades added.
- Trade volume counts the contracts traded, calls and puts.
A buy and a sell of the same size cancel out in net flow. So a short bar can sit on top of heavy two-way trading: check the volume behind it.
Which indicator answers which question
The options suite has the full map of the indicators and how they fit together. As a start:
| You want to know | Reach for |
|---|---|
| Where the walls, max pain and the gamma flip sit on my chart | GEX profile |
| How dealer exposure at each strike changed over time | GEX heatmap |
| What dealer gamma would become if price moved | GEX curve |
| One glance at net GEX, walls, max pain, the put/call ratio and the regime | Dashboard |
| Which strikes options traders are buying or selling now | Options flow |
| Which expiries the money is going into | Flow by expiry |
| Whether calls or puts are being bought, this hour or today | Flow pulse |
| What IV each strike prices in | IV smile |
| Whether near expiries price more movement than later ones | Term structure |
| IV at every strike and expiry in one view | Vol surface |
| ATM IV, skew and wing prices per expiry, as numbers | Vol matrix |
| How big a move the market prices in by each expiry | Implied move |
| A coin's IV over time, by tenor | Implied Volatility, in the Indicators list |
| Deribit's 30-day volatility index over time | DVOL, in the Indicators list |
| Skew over time, by tenor | Skew, in the Indicators list |
| Puts against calls over time | Put/Call Ratio, in the Indicators list |
Glossary
Every term the options settings use, in the words the settings themselves use. Display rows such as Theme, Palette, Fill style or Bar width are explained on each indicator's page.
| Term | Meaning |
|---|---|
| ≤1M, ≤1W | Expiries choices: options that end within 31 days, or within 7 days. |
| Abs GEX | Total GEX at each strike, calls and puts added up. |
| All (Expiries) | Every expiry date still open. |
| ATM | At the money: the strike nearest the current price. ATM IV is one expiry's headline implied volatility. |
| Call | An option that gives the right to buy at the strike. It gains when price rises above its strike. |
| Call wall | The strike with the most open calls. On the Dealer flow basis, the GEX profile uses the strike with the largest net GEX above zero. |
| Call/Put OI | Open interest: calls and puts still open at each strike. |
| Charm | How dealer hedges drift as time passes. |
| Cumulative | A GEX curve X axis choice: net GEX added up from the lowest strike. |
| Cumulative GEX zero line | The strike where net GEX, added up from the lowest strike, crosses zero. It is not the gamma flip. |
| Dealer | A market maker: a firm that usually takes the other side of options trades and hedges what it holds. |
| Dealer flow | A GEX basis choice, the default: reads which side of each option dealers hold from real trades. Works when an indicator reads Deribit alone. |
| Dealer-flow flip | The gamma flip, worked out on the Dealer flow basis. |
| Dealer regime | The sign of the whole chain's net GEX. Long gamma tends to calm moves, short gamma tends to speed them up. |
| Delta | How much an option's value moves when the price moves. Also a way to say how far an option sits from the price, as in a 25 delta put. |
| Delta flow | Net direction traded this bar, in dollars. |
| DEX | Delta: how long or short the open options are, in dollars. |
| DVOL | Deribit's volatility index: how much its option prices expect BTC or ETH to move over the next 30 days, as a yearly percent. |
| Exchange, Exchanges | Which exchanges' options an indicator reads, from those that list options on the coin. Default Deribit where it lists the coin. |
| Expected move | How far option prices expect the price to travel by an expiry date. Also called the implied move. |
| Expiry, Expiries | The day an option ends. The Expiries setting picks which expiry dates an indicator counts. |
| Expiry curves | How many smile curves the IV smile draws, one per expiry date. |
| Floor, Ceiling | The biggest node levels below and above the price. |
| Gamma | How fast delta changes as price moves. It is what keeps dealers hedging. |
| Gamma flip | The price nearest the current one where dealer hedging switches between calming moves and speeding them up. |
| Gamma flow | Hedging pressure added by this bar's trades. |
| Gate | The biggest node level between the price and the Top, if it is at least 35% of the Top. |
| GEX | Gamma exposure: how much hedging dealers must do as price moves, in dollars for each 1% move. |
| GEX + VEX | GEX or VEX, whichever is stronger, in % of the top. |
| GEX basis | How the suite decides which side of each option dealers hold: Dealer flow or Open interest. |
| Implied volatility (IV) | The yearly move option prices expect. |
| Lookback | How far back trades count, ending now, on Flow by Expiry. |
| Low nodes | The weak node levels, those under 15% of the Top in their bar. |
| Max pain | The strike where the chosen expiries' options would pay their holders the least if price ended there. |
| Nearest | Only the next expiry date. |
| Net flow | Options bought minus options sold. |
| Net GEX | GEX with its sign: where dealer hedging may slow price or speed it up. |
| Net premium | Dollars paid for options bought minus sold, all trades. |
| Node % | Each node level's size as a percent of the Top, added to its tag. |
| Node change | How much a node level grew or shrank, in percent, over the time you pick. |
| Node levels | The strongest strikes of the latest bar, named on the price scale: Top, Gate, Floor and Ceiling. |
| OI fallback % | The share of the total that used the Open interest shortcut, because those options had too few trades for Dealer flow. |
| Open interest (OI) | Options still open at each strike. Also the name of the GEX basis shortcut: calls count plus, puts minus. |
| Option | A contract to buy (a call) or sell (a put) at a set price, the strike, by a set date, the expiry. |
| Options chain | Every strike and expiry listed for one market. |
| Over spot | A GEX curve X axis choice: total GEX if price moved, up to 15% either way. Its line crosses zero at the gamma flip. |
| Premium | The price paid for an option. |
| Put | An option that gives the right to sell at the strike. It gains when price falls below its strike. |
| Put wall | The strike with the most open puts. On the Dealer flow basis, the GEX profile uses the strike with the largest net GEX below zero. |
| Put/Call ratio | Puts divided by calls, by open interest or by volume. Above 1 means more puts than calls. |
| Refresh | Options data does not stream live, so each indicator reloads it on a timer, in seconds. Default 60, the shortest 30. |
| Risk reversal (25Δ RR) | How many volatility points more traders pay for calls than for puts equally far from the price. Below zero, puts cost more. |
| Skew | The gap in implied volatility between calls and puts equally far from the price. |
| Smile | Implied volatility drawn across the strikes of one expiry. |
| Spot | The current price of the underlying. |
| Strike | The price an option is written at. |
| Strike window | Which strikes an indicator draws: those within this percent of the current price. |
| Tenor | How far out the options end: 1W, 1M or 3M. |
| Term structure | ATM implied volatility drawn across expiry dates. |
| Top ★ | The strongest strike. On the GEX profile, the strike with the most dealer hedging, the largest net GEX either way. On the heatmap, the biggest node level of the metric shown. Price often slows or stalls near it. |
| Trade volume | Contracts traded, calls and puts. |
| Underlying | What an option is written on: a coin, a futures contract, or a US stock or ETF. |
| Vanna | How dealer hedges shift when volatility moves. |
| Vega | How much an option's value changes when implied volatility moves one point. |
| VEX | Vega exposure: how much dealers gain or lose when volatility moves. |
| Volume | Options traded in a period. |