Absorption
Bars where heavy one-sided volume failed to move price. The bar's delta (aggressive buy volume minus aggressive sell volume) sits in its own pane in muted amber and orange.
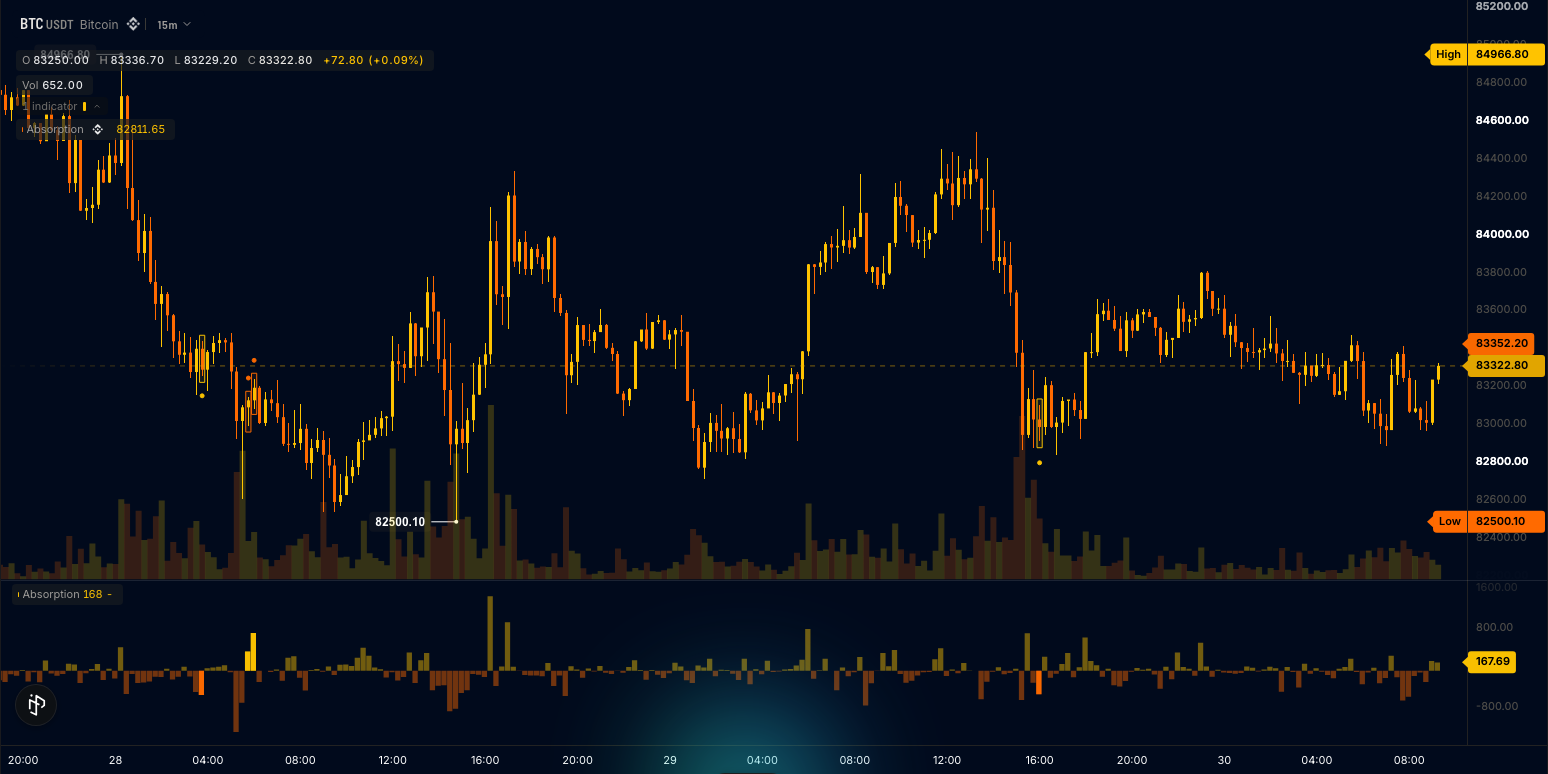
A bar whose absolute delta spikes past the rolling norm while its range stays inside the ATR is lit bright in the pane, boxed on the chart with a thin border, and dotted: an orange dot above the candle when buying was absorbed (buyers hit the tape and price did not rise), an amber dot below it when selling was absorbed. Flagged bars are rare by design, a few per day on a 15m chart.
The parts are side-split trades.volume inputs (Data sources), two histogram outputs sharing one pane (the muted delta on every bar, the bright one on flagged bars only) with a sign palette (Styling), the Atr and Sma helpers (TA library), a box handle around each flagged candle and two shape outputs for the dots (Drawing objects). This is also the absorption template: the Absorption card under Order flow in the editor's starter list, and it compiles as written.
The wrun indicator
// Absorption: bars where heavy one-sided volume failed to move price. The bar's delta (buy volume minus sell volume)
// sits in its own pane, muted amber and orange; a bar whose delta spikes past the rolling norm while its range stays
// inside the ATR is lit bright in the pane, boxed on the chart, and dotted: above the candle when buying was absorbed
// (orange), below it when selling was absorbed (amber).

section("Delta"); // the dialog's first section: what makes a bar heavy
param.number("delta_spike", 2.0, { min: 1.0, max: 6.0, step: 0.1, label: "Delta spike multiple", description: "A bar is heavy when its absolute delta is this many times the rolling mean of absolute delta" });
param.int("delta_window", 48, { min: 10, max: 400, label: "Delta window in bars", description: "Bars the mean of absolute delta is taken over" });
section("Range"); // the second section: what counts as going nowhere
param.number("max_range", 0.8, { min: 0.2, max: 2.0, step: 0.1, label: "Max range in ATRs", description: "A bar failed to move when its range is under this many ATRs" });
param.int("atr_length", 14, { min: 2, max: 100, label: "ATR length in bars", description: "The ATR's Wilder length in bars" });
input("close", ohlcv.close); // the primary input: the chart's own candles define the grid every other input lines up on
input("open", ohlcv.open); // the candle, for the box around a flagged bar
input("buy", trades.volume, { side: "BUY", missing: "zero" }); // aggressive buy volume; a bar with no prints reads 0
input("sell", trades.volume, { side: "SELL", missing: "zero" }); // aggressive sell volume, the other half of the tape
output("delta", histogram, lower, { colors: ["#f8c00073", "#f8680073"] }); // buy minus sell volume, muted: amber above zero, orange below
output("absorbed", histogram, lower, { colors: ["#f8c000", "#f86800"] }); // the same bar, bright, on the bars the test flags; NaN elsewhere
output("absorbed_buying", shape, overlay, { color: "#f86800" }); // a dot above a candle where heavy buying went nowhere
output("absorbed_selling", shape, overlay, { color: "#f8c000" }); // a dot below a candle where heavy selling went nowhere
string("text", { max_bytes: 40 }); // the one line of words when the market has no sided trades
handles.box({ opacity: 0.08, borderWidth: 1 }); // a thin box around each flagged candle (chart time and price)
handles.label({ anchor: "top_right", align: "right", color: "#94a3b8", size: 11 }); // the notice, in pane pixels from the top-right corner

const MAX_BOXES = 60; // boxes ride a ring: the oldest is recycled
const boxes: BoxHandle[] = []; // handle objects allocate once
for (let i = 0; i < MAX_BOXES; i += 1) boxes.push(draw.box(i));
const notice = draw.label(100); // ids are one space across kinds
const ORANGE = rgba(248, 104, 0, 255);
const AMBER = rgba(248, 192, 0, 255);

let deltaSpike = 2.0; // settings, read in onStart()
let maxRange = 0.8;
let meanAbsDelta = new Sma(48); // rebuilt in onStart()
let atr = new Atr(14);
let sidedVolume = 0.0; // every sided print seen: 0 means the market has no sided trades
let prevTime = NaN; // the previous bar's open time, for the bar's width in seconds
let barSeconds = NaN;
let flagged = 0; // how many bars have been boxed: the ring position

function onStart(): void {
  deltaSpike = p_delta_spike();
  maxRange = p_max_range();
  meanAbsDelta = new Sma(i32(p_delta_window()));
  atr = new Atr(i32(p_atr_length()));
}

// onBar() runs once per bar: the delta, the two norms, and the test: heavy delta inside a small range; then the outputs on
// every bar, a box around a flagged candle, and the notice on the live bar only.
function onBar(): void {
  const close = bar.close();
  const high = bar.high();
  const low = bar.low();
  const barTime = bar.time();
  const buy = in_buy();
  const sell = in_sell();
  const delta = buy - sell;
  sidedVolume += buy + sell;
  const norm = meanAbsDelta.update(Math.abs(delta)); // NaN until the window is full
  const range = atr.update(high, low, close); // NaN until seeded
  if (!isNaN(prevTime)) {
    const step = barTime - prevTime;
    if (step > 0.0 && (isNaN(barSeconds) || step < barSeconds)) barSeconds = step; // the smallest positive step is one bar
  }
  prevTime = barTime;
  let tone = delta >= 0.0 ? 0 : 1; // 0 buying, 1 selling, 2 absorbed buying, 3 absorbed selling
  let dotAbove = NaN;
  let dotBelow = NaN;
  let boxLeft = NaN; // the box around a flagged candle; NaN on every other bar
  let boxRight = NaN;
  let boxTop = NaN;
  let boxBottom = NaN;
  const heavy = !isNaN(norm) && norm > 0.0 && Math.abs(delta) >= deltaSpike * norm;
  const stuck = !isNaN(range) && range > 0.0 && high - low <= maxRange * range;
  if (heavy && stuck && !isNaN(barSeconds)) {
    tone = delta >= 0.0 ? 2 : 3;
    const pad = range * 0.12; // a little air between the box and the wicks
    if (delta >= 0.0) dotAbove = high + range * 0.4; // buyers hit the tape and price did not rise: buying absorbed
    else dotBelow = low - range * 0.4; // sellers hit the tape and price did not fall: selling absorbed
    boxLeft = barTime - barSeconds * 0.45;
    boxRight = barTime + barSeconds * 0.45;
    boxTop = high + pad;
    boxBottom = low - pad;
  }
  out_delta(delta);
  out_absorbed(tone >= 2 ? delta : NaN);
  out_absorbed_buying(dotAbove);
  out_absorbed_selling(dotBelow);
  if (!isNaN(boxLeft)) {
    const k = flagged % MAX_BOXES; // the ring position: the oldest box is reused
    flagged += 1;
    const ink = tone == 2 ? ORANGE : AMBER;
    boxes[k].set(boxLeft, boxTop, boxRight, boxBottom).color(ink).fill(ink);
  }
  if (bar.isLast() && sidedVolume <= 0.0) { // the market served no sided prints at all: say so once, top right
    sb_clear();
    sb_text("No sided trades on this market");
    notice.set(16, 14).text(str_text_sb);
  }
}How it works
Heavy is a ratio. delta is buy volume minus sell volume; its absolute value against the rolling mean of absolute delta over delta_window (48) bars is the test, and a bar is heavy when the ratio passes delta_spike (2.0). Volume is in the market's own units, so the thresholds are ratios and the pane's scale follows the market.
Failed to move is a range test. The bar's high-to-low range against the ATR over atr_length (14) bars must stay under max_range (0.8) ATRs. Heavy and narrow together flag the bar: absorbed carries the same delta, bright, on flagged bars and NaN elsewhere, so the two histogram outputs share the pane and the muted one never hides a flagged bar. Both use colors: [amber, orange], a sign palette: entry 0 above zero, entry 1 below.
The side names the dot. Heavy buying that went nowhere puts absorbed_buying at the bar's high (an orange dot above the candle); heavy selling that went nowhere puts absorbed_selling at the bar's low (an amber dot below it). A thin box handle frames the flagged candle from its open to its close in price and from the bar's open time to the next bar.
Where it runs
Markets with sided trades: crypto perps and spot, prediction markets.
When data is missing
On a market with no sided trades (FX, stocks) the delta stays at zero and one slate line of words sits at the top right of the chart: "No sided trades on this market".
Customize it
- More flags. Lower
delta_spikeor raisemax_range; both are settings. - A different norm. Raise
delta_windowto measure the spike against a longer stretch of bars. - No boxes. Delete the
handles.boxline and the box calls inonBar()to keep the pane and the dots alone.
Run it
- In the editor's Explorer, press the Templates icon ("Browse starter templates") and pick Absorption under Order flow.
- Press Run on a crypto perp or spot market, a 15m chart for example: the delta pane fills, and the flagged bars light up with their boxes and dots.
- At the editor's Console prompt, type
last 60 absorbedto read the flagged bars' delta over the last 60 bars (NaN where a bar is not flagged).
Concepts used
- Data sources for the
tradessource, its sides and themissingpolicy - Styling for sign palettes on histogram outputs
- Drawing objects for box handles in chart time and price