Odds vs price
On a Polymarket chart, the market's YES odds set against a pinned asset, Binance Futures BTCUSDT by default.
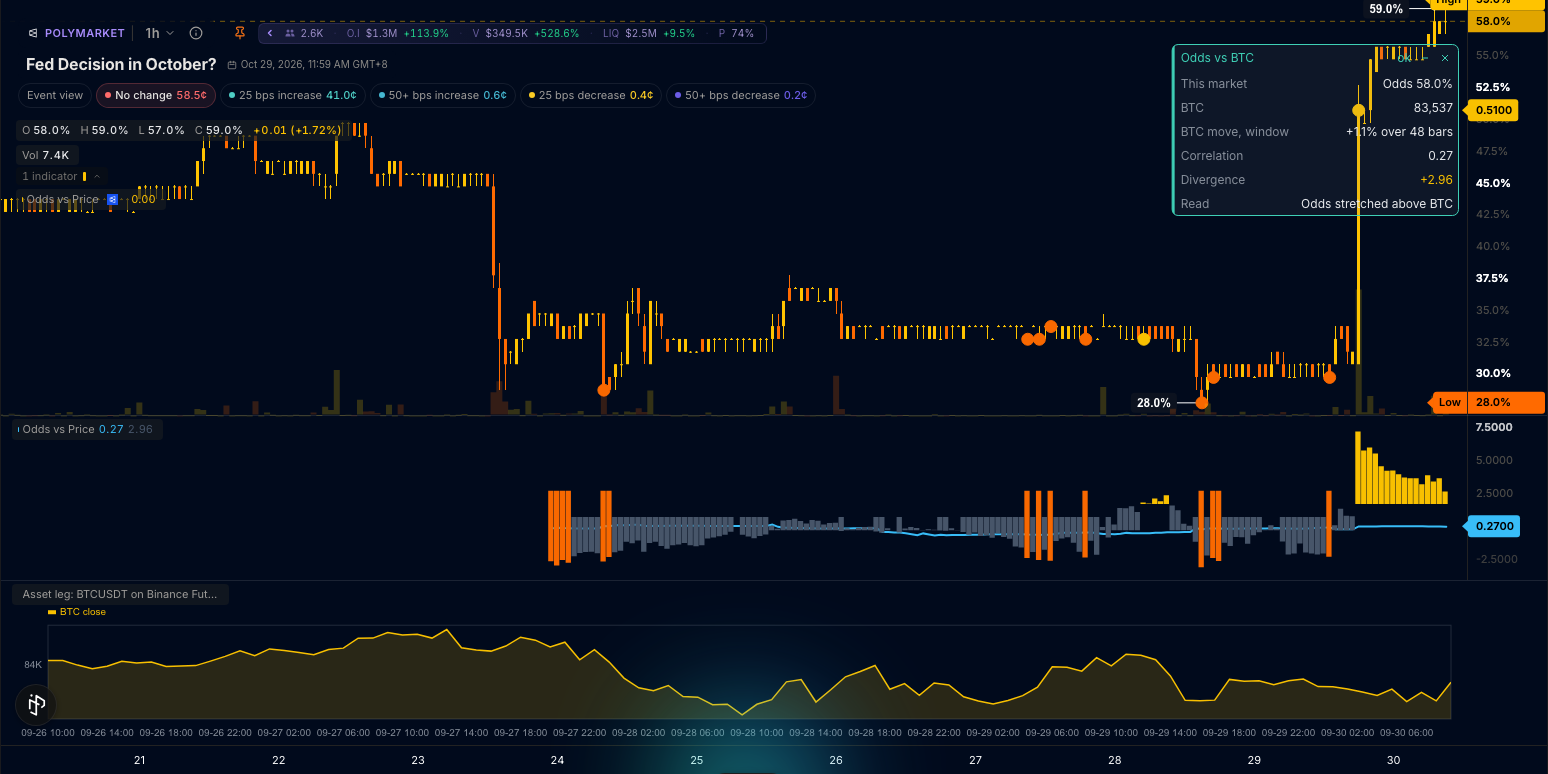
A pane below price holds the rolling correlation of odds changes and BTC returns (sky line, -1 to 1) and a divergence histogram: the odds' z-score minus BTC's over the z-score window, slate while inside the threshold and lit amber (odds stretched above BTC's move) or orange (below) once past it. On the odds candles, a dot marks the bar where the divergence first crossed the threshold. A window below the chart shows BTC's own close over the last two correlation windows, so the move the odds are measured against is on screen. A card at the top right reads the market's odds, BTC's price and its move over the window, the correlation, the divergence and a plain-words verdict.
The parts are one candle leg pinned to another market (Multi-source), the Correlation and Zscore helpers (TA library), a histogram with a four-colour ladder (Styling), a frame feeding a panel.line on a time axis and a draw.card with text slots (Cards, frames and panels). This is also the odds-vs-price template: the Odds vs Price card under Prediction markets in the editor's starter list, and it compiles as written.
The wrun indicator
// Odds vs Price: on a Polymarket chart, the market's YES odds against a pinned asset (Binance Futures BTCUSDT).
// A pane with the rolling correlation of odds changes and asset returns, a divergence histogram (the odds' z-score
// minus the asset's, lit past the threshold), the asset's own close in a window below the chart, and a card with the
// live reading. The trader sees whether the odds are moving with the asset or have stretched away from it.

param.int("window", 48, { min: 10, max: 500, label: "Correlation window in bars", description: "Bars in the rolling correlation" });
param.int("zscore_window", 96, { min: 10, max: 500, label: "Z-score window in bars", description: "Bars the divergence z-scores are measured over" });
param.number("threshold", 2, { min: 0.5, max: 5, step: 0.1, label: "Stretch threshold", description: "Divergence z-score that counts as stretched" });
input("close", ohlcv.close, { description: "This chart's close: the YES odds on a Polymarket market" }); // the primary input: the chart's own candles
input("asset_close", ohlcv.close, { exchange: "BINANCE_FUTURES", symbol: "BTCUSDT", missing: "carry", description: "The asset leg: BTCUSDT on Binance Futures" }); // pinned: change the pair here
const correlationLine = output("correlation", line, lower, { color: "#38bdf8", width: 2, label: "Correlation", format: "0.00", description: "Rolling correlation of odds changes and asset returns, -1 to 1" }); // the handle names it for the hover card
output("divergence", histogram, lower, { color_by: "div_tone", colors: ["#475569", "#475569", "#f8c000", "#f86800"], label: "Divergence", format: "0.00", description: "Odds z-score minus asset z-score" }); // slate inside the threshold, amber or orange once stretched; two decimals in the legend
hover(correlationLine, [block.value("Correlation", "correlation", { format: "0.00" }), block.rows([["Divergence", "divergence", "0.00"]])]); // the card the correlation line opens under the cursor
output("div_tone", none, lower, { description: "0 mild up, 1 mild down, 2 stretched up, 3 stretched down" }); // data-only: the histogram's ladder
output("stretch_up", shape, overlay, { color: "#f8c000", width: 6, description: "The close of the bar where the divergence first crossed above the threshold" }); // an event dot on the odds candle
output("stretch_down", shape, overlay, { color: "#f86800", width: 6, description: "The close of the bar where the divergence first crossed below minus the threshold" });
string("market_line", { max_bytes: 24 }); // "Odds 62.0%" or "Price 0.1423"
string("asset_line", { max_bytes: 24 }); // "84,210"
string("move_text", { max_bytes: 24 }); // "+0.4%" over the correlation window
string("corr_text", { max_bytes: 16 }); // "0.29"
string("div_text", { max_bytes: 16 }); // "+3.97"
string("reading", { max_bytes: 24 }); // the plain-words verdict, at most 24 characters (the card clips longer values)
const asset_rows = frame("asset_rows", { max_bytes: 16384 }); // the asset window: [bar open, asset close] for the last 2 x window bars
panel.line({ name: "asset_window", title: "Asset leg: BTCUSDT on Binance Futures", x: "time", place: "below", frame: asset_rows, legend_style: "none", series: [{ name: "BTC close", color: "#f8c000" }] }); // no series chip beside the title: the one series is named once, by its value row
draw.card("odds_vs_asset", {
  title: "Odds vs BTC",
  anchor: "top_right",
  offset: [0, 40], // below the chart's own High tag, which always sits in the pane's top-right corner
  background_opacity: 1, // an opaque surface: the candles under the card never show through its rows
  rows: [
    { label: "This market", value: { text: "market_line" } },
    { label: "BTC", value: { text: "asset_line" } },
    { label: "BTC move, window", value: { text: "move_text" } },
    { label: "Correlation", value: { text: "corr_text" } },
    { label: "Divergence", value: { text: "div_text" }, color: { color_by: "div_tone", colors: ["#e2e8f0", "#e2e8f0", "#f8c000", "#f86800"] } },
    { label: "Read", value: { text: "reading" } },
  ],
});

const RING = 1024; // the asset window ring
const ringT = new StaticArray<f64>(RING); const ringAsset = new StaticArray<f64>(RING); let head = -1; let count = 0;
const jsonBytes = new StaticArray<u8>(16384); let jsonUsed = 0; // the asset window JSON, appended as UTF-8 bytes (the sandbox forbids memory growth after onStart())
let window = 48; let zWindow = 96; let threshold = 2.0; // the params
let corr = new Correlation(48); let zOdds = new Zscore(96); let zAsset = new Zscore(96); // rebuilt in onStart()
let close: f64 = NaN; let prevClose: f64 = NaN; let asset: f64 = NaN; let prevAsset: f64 = NaN; // the two legs on this bar and the previous one
let prevTone: f64 = NaN; // the divergence's tone on the previous bar: the crossing detector
let unitScale = true; let centScale = true; let sameMarket = true; let bars = 0; // what this chart looks like: odds 0..1 on a 0.001 grid, odds 0..100 on a 0.1 grid, or the asset itself

function round2(v: f64): f64 { return Math.round(v * 100.0) / 100.0; }
function offGrid(v: f64, step: f64): bool { const k = v / step; return Math.abs(k - Math.round(k)) > 1e-6; }
// ── JSON bytes: append text and numbers without allocating; one string is made per frame write ──
function jbByte(b: u32): void { if (jsonUsed < jsonBytes.length) { jsonBytes[jsonUsed] = <u8>b; jsonUsed += 1; } }
function jbText(text: String): void {
  const n = String.UTF8.byteLength(text);
  if (jsonUsed + n <= jsonBytes.length) jsonUsed += i32(String.UTF8.encodeUnsafe(changetype<usize>(text), text.length, changetype<usize>(jsonBytes) + jsonUsed));
}
function jbUint(v: u64): void { if (v >= 10) jbUint(v / 10); jbByte(0x30 + <u32>(v % 10)); }
function jbNum(v: f64, decimals: i32): void { // a fixed-point number, or null when not finite
  if (!isFinite(v)) { jbText("null"); return; }
  let x = v; if (x < 0.0) { jbByte(0x2d); x = -x; }
  let scale = 1.0; for (let i = 0; i < decimals; i += 1) scale *= 10.0;
  const scaled = Math.round(x * scale); const whole = Math.floor(scaled / scale); const frac = scaled - whole * scale;
  jbUint(<u64>whole);
  if (decimals > 0) { jbByte(0x2e); const f = <u64>frac; let digits = 1; let probe = f; while (probe >= 10) { probe /= 10; digits += 1; } for (let i = digits; i < decimals; i += 1) jbByte(0x30); jbUint(f); }
}
function jbFlush(slot: i32): void { writeFrame(slot, String.UTF8.decodeUnsafe(changetype<usize>(jsonBytes), jsonUsed)); jsonUsed = 0; }
function sbGrouped(n: i64): void { if (n >= 1000) { sbGrouped(n / 1000); sb_text(","); const r = n % 1000; if (r < 100) sb_text("0"); if (r < 10) sb_text("0"); sb_int(r); } else sb_int(n); }
function sbPrice(v: f64): void { if (v >= 1000.0) sbGrouped(i64(Math.round(v))); else if (v >= 100.0) sb_f64(v, 2); else if (v >= 1.0) sb_f64(v, 3); else sb_f64(v, 4); }

function onStart(): void {
  window = i32(p_window()); zWindow = i32(p_zscore_window()); threshold = p_threshold();
  corr = new Correlation(window); zOdds = new Zscore(zWindow); zAsset = new Zscore(zWindow);
  memory.grow(2); // headroom for the one frame string per write: the sandbox forbids growth after onStart()
}
// onBar() runs once per bar: the bar's odds change against the asset's log return into the correlation, both levels into their
// z-scores; then the pane's two series and the card's words on every ready bar, the asset window on the live bar only.
function onBar(): void {
  prevClose = close; prevAsset = asset; close = bar.close(); asset = in_asset_close(); const t = bar.time();
  if (isNaN(close) || isNaN(asset)) return;
  bars += 1;
  if (close < 0.0 || close > 1.0 || offGrid(close, 0.001)) unitScale = false; // odds as 0..1 tick in thousandths
  if (close < 0.0 || close > 100.0 || offGrid(close, 0.1)) centScale = false; // odds as 0..100 tick in tenths of a cent
  if (Math.abs(asset - close) > 1e-9 * Math.max(1.0, Math.abs(close))) sameMarket = false;
  head = (head + 1) % RING; if (count < RING) count += 1; ringT[head] = t; ringAsset[head] = asset;
  const oddsChange = isNaN(prevClose) ? NaN : close - prevClose;
  const assetReturn = isNaN(prevAsset) || prevAsset <= 0.0 ? NaN : Math.log(asset / prevAsset);
  const correlation = isNaN(oddsChange) || isNaN(assetReturn) ? NaN : corr.update(oddsChange, assetReturn);
  const zo = zOdds.update(close); const za = zAsset.update(Math.log(asset));
  const divergence = isNaN(zo) || isNaN(za) ? NaN : zo - za;
  const tone = isNaN(divergence) ? 0.0 : Math.abs(divergence) >= threshold ? (divergence > 0.0 ? 2.0 : 3.0) : divergence > 0.0 ? 0.0 : 1.0;
  const stretchUp = tone == 2.0 && prevTone != 2.0 && !isNaN(prevTone) ? close : NaN; // the event dots: the close on the bar the divergence crossed the threshold, NaN elsewhere
  const stretchDown = tone == 3.0 && prevTone != 3.0 && !isNaN(prevTone) ? close : NaN;
  prevTone = isNaN(divergence) ? NaN : tone;
  if (isNaN(correlation) || isNaN(divergence)) return; // still warming up: nothing is written on this bar
  out_correlation(round2(correlation)); out_divergence(Math.abs(divergence) < 0.005 ? NaN : round2(divergence)); out_div_tone(tone); out_stretch_up(stretchUp); out_stretch_down(stretchDown); // a zero-height bar is skipped
  sb_clear(); if (unitScale) { sb_text("Odds "); sb_f64(close * 100.0, 1); sb_text("%"); } else if (centScale) { sb_text("Odds "); sb_f64(close, 1); sb_text("%"); } else { sb_text("Price "); sbPrice(close); } str_market_line_sb();
  const back = window < count ? window : count - 1; const agoAsset = ringAsset[(head + RING - back) % RING];
  sb_clear(); sbPrice(asset); str_asset_line_sb();
  sb_clear(); if (agoAsset > 0.0) { const move = ((asset - agoAsset) / agoAsset) * 100.0; if (move >= 0.0) sb_text("+"); sb_f64(move, 1); sb_text("% over "); sb_int(back); sb_text(" bars"); } else sb_text("n/a"); str_move_text_sb();
  sb_clear(); sb_f64(correlation, 2); str_corr_text_sb();
  sb_clear(); if (divergence > 0.0) sb_text("+"); sb_f64(divergence, 2); str_div_text_sb();
  sb_clear();
  const odds = unitScale || centScale; // the words follow the chart: odds on a prediction market, the market itself elsewhere
  if (sameMarket && bars > 4) sb_text("Chart is the asset leg");
  else if (divergence >= threshold) sb_text(odds ? "Odds stretched above BTC" : "Stretched above BTC");
  else if (divergence <= -threshold) sb_text(odds ? "Odds stretched below BTC" : "Stretched below BTC");
  else if (correlation > 0.3) sb_text(odds ? "Odds moving with BTC" : "Moving with BTC");
  else if (correlation < -0.3) sb_text(odds ? "Odds moving against BTC" : "Moving against BTC");
  else sb_text(odds ? "Odds detached from BTC" : "Detached from BTC");
  str_reading_sb();
  if (bar.isLast()) { // the asset window: [bar open in seconds, asset close], oldest first
    const shown = count < 2 * window ? count : 2 * window; const decimals = asset >= 100.0 ? 2 : 6;
    jbText("{\"rows\":[");
    for (let k = shown - 1; k >= 0; k -= 1) { const i = (head + RING - k) % RING; if (k != shown - 1) jbText(","); jbText("["); jbNum(ringT[i], 0); jbText(","); jbNum(ringAsset[i], decimals); jbText("]"); }
    jbText("]}"); jbFlush(FRAME_ASSET_ROWS);
  }
}
How it works
One pinned leg. input("asset_close", ohlcv.close, { exchange: "BINANCE_FUTURES", symbol: "BTCUSDT", missing: "carry" }) reads the asset's close on the chart's own grid; to compare against another asset, change the exchange and symbol in that one line. The chart's close is the primary input: the YES odds on a Polymarket market.
Correlation and divergence. correlation is the rolling correlation of odds changes and asset returns over window (48) bars. divergence is the odds' z-score minus the asset's over zscore_window (96) bars; div_tone reads 0 mild up, 1 mild down, 2 stretched up, 3 stretched down from it against threshold (2), and the histogram's color_by: "div_tone" ladder paints slate, slate, amber, orange; format: "0.00" prints it in the legend with two decimals ("-0.43"), never a rounded "-0". stretch_up and stretch_down carry the close on the bar the divergence first crossed the threshold, the dots on the odds candles.
The asset is on screen. frame("asset_rows") carries [bar open, asset close] for the last two correlation windows and feeds panel.line on a time axis below the chart; legend_style: "none" leaves the one series out of the chips beside the panel's title, so its name reads once, on its value row. The card's cells (odds, the asset's price and move, the correlation, the divergence, a verdict of at most 24 characters) are text slots written on the live bar, on an opaque surface (background_opacity: 1) so the candles under the card never show through its rows.
Where it runs
Polymarket markets on charts of one minute and coarser (the card reads odds on the 0..1 and the 0..100 scale). The chart serves the pinned leg as another market's candles at the chart's interval, joined bar by bar and live from that market's candle feed. On any other crypto chart it still runs: the first leg is then the chart's own price, so the pane reads as relative strength against BTC, the card labels the row "Price" and the verdict drops the word odds; on the BTCUSDT perp itself the two legs are one series and the card says "Chart is the asset leg". An alert on this indicator reads the pinned BTC leg as well, since alerts serve another market's candles on a secondary ohlcv input (Alerts); the file reads the odds as the chart's own ohlcv candles, never the odds source alerts cannot evaluate. The BTC pin is another market at the chart's interval, not a coarser timeframe, so the alert keeps 500 bars, the largest maximum among its settings, which holds the default 48 and 96-bar windows.
When data is missing
The pane needs zscore_window bars of both legs before it draws; a bar without an asset observation carries the last one; a divergence under 0.005 draws no bar.
Customize it
- Another asset. Change the
exchangeandsymbolwords on the pinned input (declaration literals, not settings) and the panel's title. - A stricter stretch. Raise
threshold; the dots and the lit bars thin out. - A longer memory.
windowandzscore_windowgo up to 500 bars each.
Run it
- In the editor's Explorer, press the Templates icon ("Browse starter templates") and pick Odds vs Price under Prediction markets.
- Press Run on a Polymarket market's chart: the pane, the asset window below the chart and the card draw once both legs have
zscore_windowbars. - At the editor's Console prompt, type
last 20 divergenceto read the divergence of the last 20 bars.
Concepts used
- Multi-source for pinned symbol and exchange legs
- TA library for
CorrelationandZscore - Cards, frames and panels for frames,
panel.line,draw.cardand text slots