Session map
Asia, London and New York each drawn as a box around the session's high and low, with a small tag inside the box's left edge (Asia violet, London sky, New York amber).
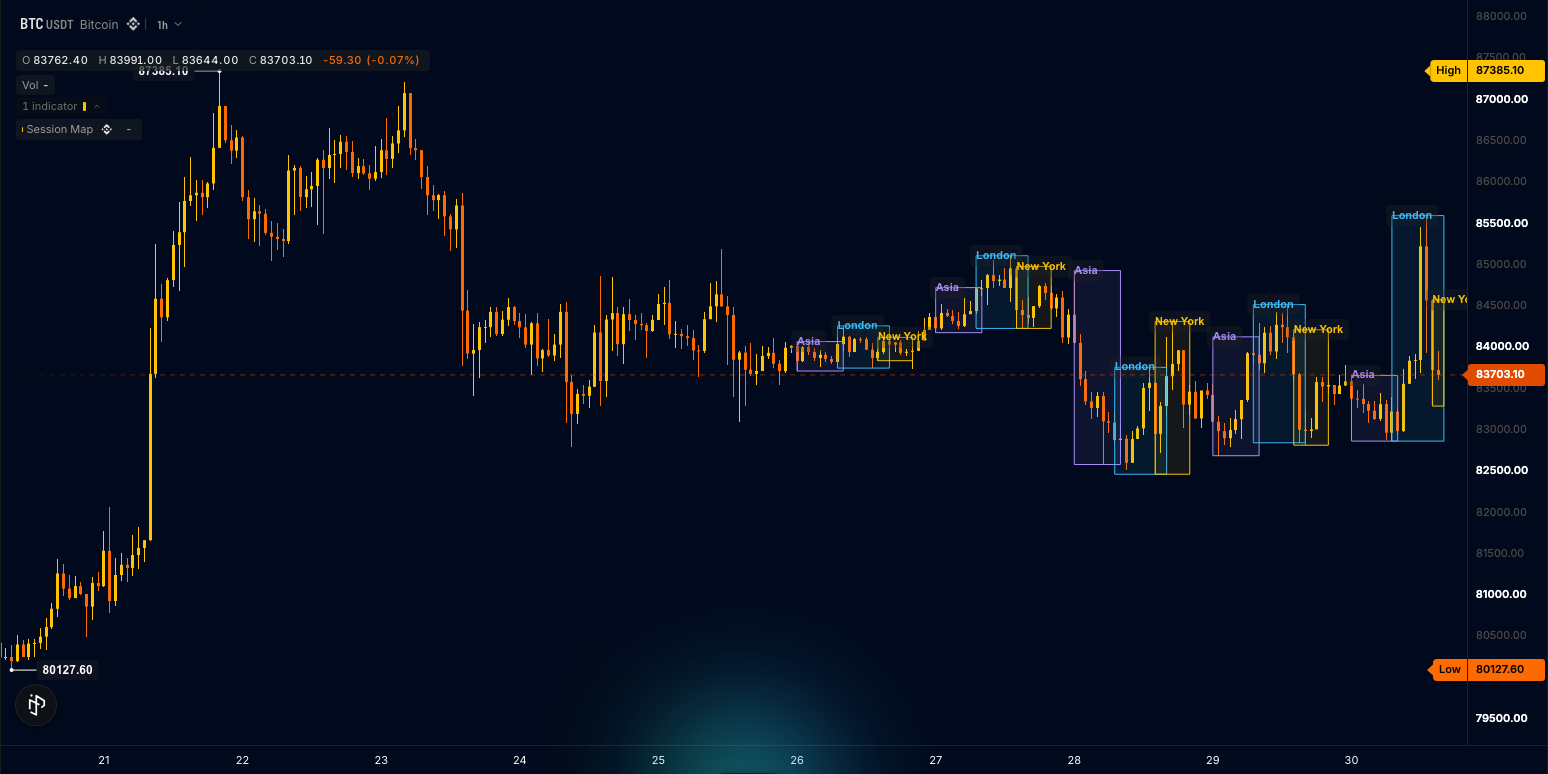
The live session's box grows with every bar. Where two sessions overlap (London into New York, Asia into London) the boxes overlap too. The last five days stay on the chart; older boxes are reused.
The parts are box and label handles in chart time and price (Drawing objects), one bounded text slot every tag is written through, and the bar's open time, bar.time(), placed in each window's own zone by a session setting (Time and sessions, Sessions and units). Nothing is drawn per bar beyond moving the open session's box, so a closed day costs nothing. This is also the session-map template: the Session Map card under On price in the editor's starter list, and it compiles as written.
The wrun indicator
// Session Map: Asia, London and New York boxed around each session's high and low, a small tag on each box, the live session growing bar by bar.
// The trader sees which session set the range, where the overlaps traded, and how far the live session has run. Each session is a window in its own zone.

section("Sessions"); // the dialog's first section: a window and its zone per session; daylight saving follows the zone, bar by bar
param.session("asia", "00:00-08:00", { tz: "UTC", label: "Asia" });
param.session("london", "07:00-16:00", { tz: "UTC", label: "London" });
param.session("new_york", "13:30-20:00", { tz: "UTC", label: "New York" });
section("Boxes");
param.int("days_kept", 5, { min: 1, max: 10, label: "Days kept", description: "Days of sessions kept on the chart; the oldest box is reused" });
param.bool("show_tags", true, { label: "Show tags", description: "Tag each box with its session name" });
input("high", ohlcv.high); // the bar's high and low grow the open session's box
output("sessions_open", none, overlay, { description: "Sessions open on this bar: 0, 1, or 2 where two sessions overlap" }); // data-only, so the Console can read it
string("tag", { max_bytes: 48 }); // one bounded slot every tag is written through
handles.box({ opacity: 0.08, borderWidth: 1 }); // boxes in chart time and price: one per session per day
handles.label({ size: 11, align: "left" }); // the tags, and the one line of words on a coarse chart

const SESSIONS = 3; // Asia, London, New York
const MAX_DAYS = 10; // the ring's ceiling: 30 boxes and 30 tags at most, ids in one space
const NAMES = ["Asia", "London", "New York"];
const inks: i32[] = [rgba(167, 139, 250, 255), rgba(56, 189, 248, 255), rgba(248, 192, 0, 255)]; // violet, sky, amber
const SLATE: i32 = rgba(148, 163, 184, 255);
const starts = new StaticArray<f64>(SESSIONS); // each window's start and end in minutes from midnight, and its zone, read from the settings in onStart()
const ends = new StaticArray<f64>(SESSIONS);
const zones = new StaticArray<i32>(SESSIONS);
const dayKey = new StaticArray<f64>(SESSIONS); // the day the open instance's window opened, in its zone (NaN = none yet): a new day opens a new box whatever bars the feed has
let clocks: Clock[] = []; // one bar clock per session, built in onStart() for the zone each window is set in
const slot = new StaticArray<i32>(SESSIONS); // the ring slot that instance sits in
const instances = new StaticArray<i32>(SESSIONS); // instances seen so far, per session
const startT = new StaticArray<f64>(SESSIONS); // the open instance's first bar open
const endT = new StaticArray<f64>(SESSIONS); // the open instance's right edge (the newest bar's close)
const hiP = new StaticArray<f64>(SESSIONS); // the open instance's high and low so far
const loP = new StaticArray<f64>(SESSIONS);
const touched = new StaticArray<i32>(SESSIONS); // 1 when this bar sits inside the session
const fresh = new StaticArray<i32>(SESSIONS); // 1 on the bar that opens a new instance
const grew = new StaticArray<i32>(SESSIONS); // 1 when this bar lifted the instance's high (a top tag moves up)
const sank = new StaticArray<i32>(SESSIONS); // 1 when this bar pushed the instance's low down (a bottom tag moves down)

function makeBoxes(first: i32, count: i32): BoxHandle[] { const out: BoxHandle[] = []; for (let i = 0; i < count; i += 1) out.push(draw.box(first + i)); return out; }
function makeLabels(first: i32, count: i32): LabelHandle[] { const out: LabelHandle[] = []; for (let i = 0; i < count; i += 1) out.push(draw.label(first + i)); return out; }
const boxes = makeBoxes(0, SESSIONS * MAX_DAYS); // handle objects allocate once, at module load
const tags = makeLabels(SESSIONS * MAX_DAYS, SESSIONS * MAX_DAYS);
const words = draw.label(90); // the one line of words when the chart is too coarse

let daysKept = 5; let showTags = true;
let t: f64 = NaN; let prevT: f64 = NaN; let width: f64 = NaN; // width = the smallest gap between bar opens seen, so a weekend gap never widens a box
let wordsShown = false;

// onStart() runs once before the first bar: read the settings, three readers per session, and build a clock per zone.
function onStart(): void {
  starts[0] = p_asia_start(); ends[0] = p_asia_end(); zones[0] = i32(p_asia_tz());
  starts[1] = p_london_start(); ends[1] = p_london_end(); zones[1] = i32(p_london_tz());
  starts[2] = p_new_york_start(); ends[2] = p_new_york_end(); zones[2] = i32(p_new_york_tz());
  daysKept = i32(p_days_kept()); if (daysKept < 1) daysKept = 1; if (daysKept > MAX_DAYS) daysKept = MAX_DAYS;
  showTags = pb_show_tags();
  clocks = [new Clock(SESSION_TZ_IDS[zones[0]]), new Clock(SESSION_TZ_IDS[zones[1]]), new Clock(SESSION_TZ_IDS[zones[2]])];
  for (let s = 0; s < SESSIONS; s += 1) dayKey[s] = NaN;
}
// onBar() runs once per bar: place the bar in its sessions, open a new instance on a new day, grow the open ones;
// then write the output, move the boxes this bar touched, and place a tag when a box opens or grows past its tag's edge.
function onBar(): void {
  prevT = t; t = bar.time(); const high = bar.high(); const low = bar.low();
  if (!isNaN(prevT) && t > prevT && (isNaN(width) || t - prevT < width)) width = t - prevT;
  for (let s = 0; s < SESSIONS; s += 1) { touched[s] = 0; fresh[s] = 0; grew[s] = 0; sank[s] = 0; }
  if (isNaN(width)) return; // the first bar has no width yet: nothing to draw
  const coarse = width >= 14400.0; // 4h and coarser: a session is one or two bars, the boxes would say nothing
  if (coarse) {
    out_sessions_open(0.0);
    if (!wordsShown) { // once: the handle stays
      sb_clear(); sb_text("Session Map needs a chart finer than 4h");
      words.set(56, 14).text(str_tag_sb).anchor(ANCHOR_TOP_RIGHT).align(ALIGN_RIGHT).color(SLATE);
      wordsShown = true;
    }
    return;
  }
  let openCount = 0;
  for (let s = 0; s < SESSIONS; s += 1) {
    clocks[s].update(t); // the bar in the window's zone, daylight saving included
    // A bar counts when its span reaches into the window: its open inside it, or the window opening before its close (New
    // York's 13:30 open inside the 13:00 bar of a 1h chart); lead = minutes from the bar's open to the window's start.
    const early = !inSession(t, unchecked(starts[s]), unchecked(ends[s]), unchecked(zones[s]));
    const lead = (unchecked(starts[s]) - f64(clocks[s].hour() * 60 + clocks[s].minute()) + 1440.0) % 1440.0;
    if (early && !(lead > 0.0 && lead * 60.0 < width)) continue;
    openCount += 1; touched[s] = 1;
    const key = Math.floor((t + (early ? lead * 60.0 : 0.0) + f64(clocks[s].offsetSec()) - unchecked(starts[s]) * 60.0) / 86400.0); // the local day the window opened, read at its open (a wrapped window keeps its opening day)
    if (key != unchecked(dayKey[s])) { // a new session day: the next ring slot (the oldest box moves here)
      dayKey[s] = key; slot[s] = unchecked(instances[s]) % daysKept; instances[s] = unchecked(instances[s]) + 1;
      startT[s] = t; hiP[s] = high; loP[s] = low; fresh[s] = 1;
    } else {
      if (high > unchecked(hiP[s])) { hiP[s] = high; grew[s] = 1; }
      if (low < unchecked(loP[s])) { loP[s] = low; sank[s] = 1; }
    }
    endT[s] = t + width; // the box ends at this bar's close
  }
  out_sessions_open(f64(openCount));
  for (let s = 0; s < SESSIONS; s += 1) {
    if (unchecked(touched[s]) == 0) continue;
    const id = s * MAX_DAYS + unchecked(slot[s]);
    const box = boxes[id];
    box.set(unchecked(startT[s]), unchecked(hiP[s]), unchecked(endT[s]), unchecked(loP[s]));
    if (unchecked(fresh[s]) == 1) box.color(inks[s]).fill(inks[s]).opacity(0.08).border(1.0); // the session's colour, set when the box is (re)opened
    const bottom = s == 1; // the tag sits inside its box's left edge, clear of the chart's High and Low labels: London's on the bottom, Asia's and New York's under the top, so overlapping sessions never share an edge
    if (showTags && (unchecked(fresh[s]) == 1 || (bottom ? unchecked(sank[s]) : unchecked(grew[s])) == 1)) {
      sb_clear(); sb_text(NAMES[s]);
      const tag = tags[id];
      tag.set(unchecked(startT[s]), bottom ? unchecked(loP[s]) : unchecked(hiP[s])).text(str_tag_sb);
      if (unchecked(fresh[s]) == 1) tag.color(inks[s]).size(11).align(ALIGN_LEFT).valign(bottom ? VALIGN_BOTTOM : VALIGN_TOP);
    }
  }
}How it works
Sessions are cut from the clock. bar.time() gives each bar's open in epoch seconds, UTC. Each session is a param.session (Asia 00:00 to 08:00, London 07:00 to 16:00, New York 13:30 to 20:00, all in UTC by default), read in onStart() as a start, an end and a zone; per bar, a bar belongs to a session when its span reaches into the window in that zone, daylight saving included: inSession(...) says whether the bar's open falls inside the window, and a Clock in that zone says whether the window opens before the bar closes, so on a 1h chart New York's 13:30 open puts the 13:00 bar in its box. The same clock keys each day's instance, read at the window's open. The bar's high and low grow the open session's box; a box is created on the session's first bar and moved with set() on every bar after that, so the live session's box grows as the bars arrive.
A ring of boxes, reused. days_kept (5, up to 10) times three sessions is the number of box handles in play; each day's session takes the slot of the same session days_kept days earlier, so the oldest box is reused rather than a new one made. The handle objects are made once, at module start.
Tags sit inside their box. Each tag hangs inside its box's left edge, so the chart's own High and Low labels, drawn outside the candles' extremes, never sit on one: Asia's and New York's under the top edge (valign(VALIGN_TOP)), London's on the bottom edge (valign(VALIGN_BOTTOM)), so the two sessions that overlap London never put their tags on the same edge. A tag moves when its edge does: up with a new session high, down with a new session low.
One slot, many tags. string("tag", { max_bytes: 48 }) is the one bounded slot; each tag is built with the allocation-free builder (sb_clear, sb_text, str_tag_sb) and sent to its label handle in turn, so the three session names never allocate a string on the live bar. show_tags off leaves the boxes bare.
The count is data. sessions_open is a data-only output: 0, 1, or 2 where two sessions overlap. It draws nothing; the editor's Console prompt reads it after a Run.
Where it runs
Every market with candles, on charts finer than 4h. Sessions are cut in the zone each one is set to, UTC by default.
When data is missing
On a 4h or coarser chart a session is one or two bars, so the example draws one slate line of words at the top-right ("Session Map needs a chart finer than 4h") and nothing else. At 1h a session is eight or nine bars wide, and a box starts on the bar its session opens in (New York's at 13:00 for the 13:30 open).
Customize it
- Other sessions. The three windows are settings, each with its own zone; a window that crosses midnight (
22:00-04:00) wraps on its own. - More days.
days_keptgoes up to 10; past that, raise the ring's ceiling where the handles are made (each day is three box and three label ids). - Quieter boxes.
handles.box({ opacity: 0.08, borderWidth: 1 })sets the fill and the border for every box; the per-session colours are set where each box is created.
Run it
- In the editor's Explorer, press the Templates icon ("Browse starter templates") and pick Session Map under On price.
- Press Run on a chart finer than 4h, such as 15m: the boxes draw on the chart and the live session's box grows as bars arrive.
- At the editor's Console prompt, type
last 60 sessions_opento read how many sessions were open on each of the last 60 bars.
Concepts used
- Drawing objects for box and label handles, chart coordinates and ids reused by slot
- Time and sessions for
bar.time()and UTC day math - Execution model for module-level state and where
onStart()andonBar()run