TPO Letters
The chart's own candles folded into a Market Profile: one letter per 30 minutes of the day, printed on every price the market traded during that half hour, the day's letters stacked into a profile with the point of control and the value area lit and the initial balance (the first hour) marked.
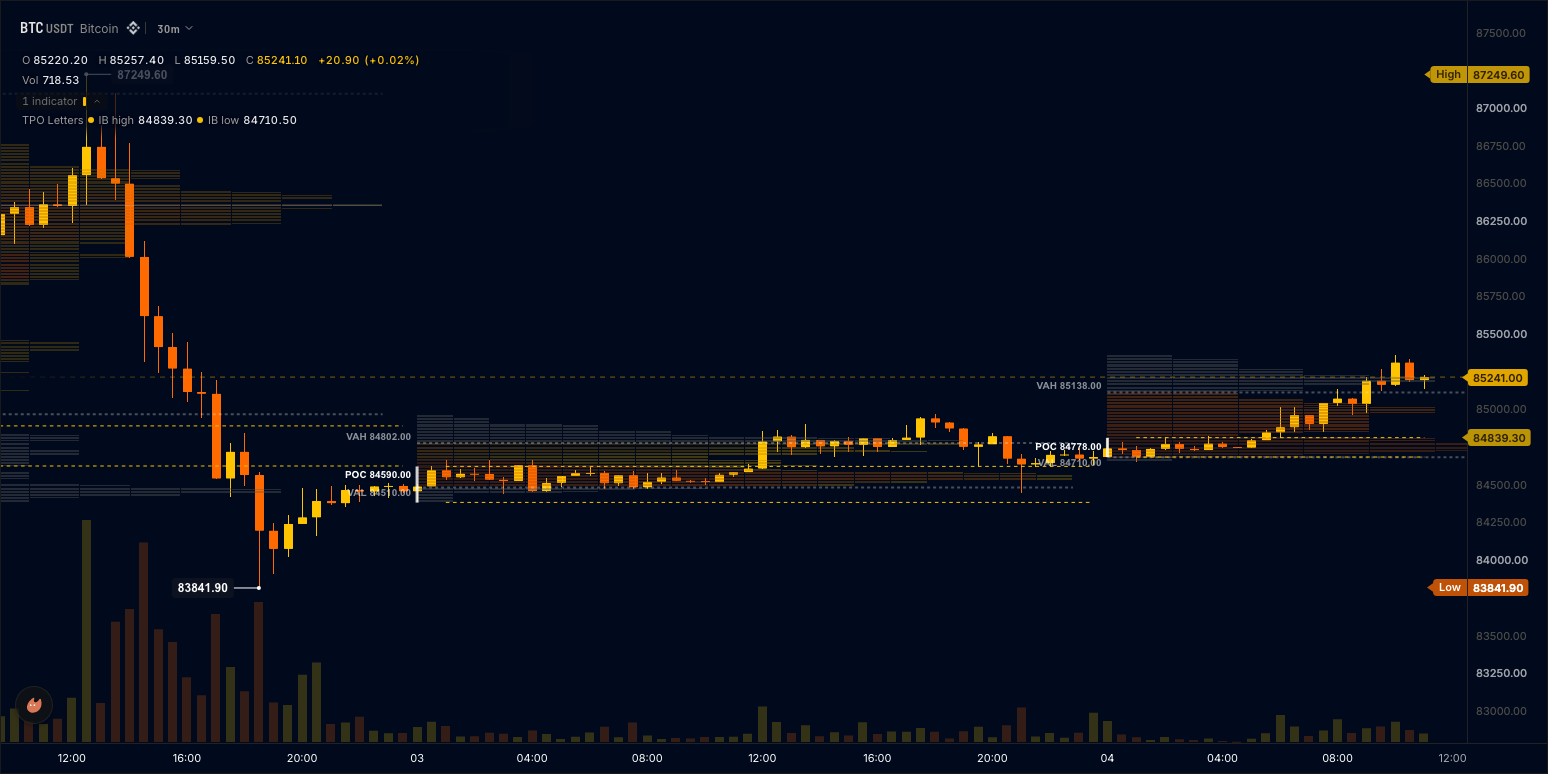
The module adds the initial balance's high and low as dashed lines on price once the balance is set, so the trader sees the day's opening range beside the letters that built it and where the later letters broke out of it.
The parts are a plot.tpo declaration with no cells, which builds the letters from the chart's own candles (Price canvases), and two line outputs computed in onBar() from the day's first letters (Plotting). This is also the tpo-letters template: the TPO Letters card under Order flow in the editor's starter list, and it compiles as written.
The wrun indicator
// TPO Letters: the chart's own candles folded into a Market Profile, one letter per 30 minutes of the day printed on
// every price the market traded during that half hour, the point of control and the value area lit, the initial
// balance marked. The module adds the initial balance's high and low as lines on price once the balance is set, so
// the trader sees the day's opening range beside the letters that built it.

param.int("ib_letters", 2, { min: 1, max: 8, label: "Initial balance letters", description: "Letters in the initial balance: 2 is the first hour of 30-minute letters" });
input("close", ohlcv.close); // the primary input: the chart's own candles define the grid and feed the letters
output("ib_high", line, overlay, { color: "#f8c000", width: 1, line_style: "dashed", format: "price", label: "IB high", description: "The initial balance high: the day's first letters' high; NaN until the balance is set" });
output("ib_low", line, overlay, { color: "#f8c000", width: 1, line_style: "dashed", format: "price", label: "IB low", description: "The initial balance low" });
plot.tpo({ name: "tpo", period: "day", letter_minutes: 30, display: "both", initial_balance: true, ib_color: "theme.text", poc: true, vah: true, val: true, value_area: 0.7, poc_color: "theme.text", vah_color: "theme.muted", val_color: "theme.muted", outside_va_opacity: 0.3 }); // no cells: the host builds the letters from the chart's own candles (30 minutes or finer)

const LETTER_SECONDS = 1800.0; // 30-minute letters, the declaration's letter_minutes
let ibLetters = 2; // the setting, read in onStart()
let day: f64 = NaN; // the UTC day being built
let ibHigh: f64 = NaN; // the balance so far
let ibLow: f64 = NaN;

function onStart(): void {
  ibLetters = i32(p_ib_letters());
}

// onBar() runs once per bar: a new UTC day starts a new balance; the bars inside the first letters grow it; the two
// lines print once the balance's last letter has closed and hold until the next day.
function onBar(): void {
  const t = bar.time();
  const today = Math.floor(t / 86400.0);
  if (today != day) {
    day = today;
    ibHigh = NaN;
    ibLow = NaN;
  }
  const letter = i32(Math.floor((t - today * 86400.0) / LETTER_SECONDS)); // this bar's letter in its day
  if (letter < ibLetters) { // inside the balance: grow it, print nothing yet
    const high = bar.high();
    const low = bar.low();
    if (!isNaN(high) && (isNaN(ibHigh) || high > ibHigh)) ibHigh = high;
    if (!isNaN(low) && (isNaN(ibLow) || low < ibLow)) ibLow = low;
    out_ib_high(NaN);
    out_ib_low(NaN);
    return;
  }
  out_ib_high(ibHigh);
  out_ib_low(ibLow);
}How it works
Letters from the candles. plot.tpo({ name: "tpo", period: "day", letter_minutes: 30 }) tells the host to build one letter per 30 minutes of each UTC day from the chart's own bars: a price row prints a letter for every letter interval in which it lay inside a bar's high-low range. The letter must be a whole multiple of the chart's bars, so the profile needs a chart of 30 minutes or finer; to run it on a coarser chart, declare an intrabar input (5-minute bars inside each chart bar) and name it in cells, or a volume_profile input, whose buckets also give each letter its volume. display: "both" prints blocks and letters ("letters" or "blocks" alone are the others).
The profile's marks. poc, vah and val light the point of control and the value area edges (value_area: 0.7), the rows outside the value area faded to outside_va_opacity; initial_balance: true marks the first hour in ib_color. single_prints, poor_extremes and counts are off by default and switch on by name; color_mode colours the blocks by period (the default), by TPO count, or by volume or delta on volume_profile cells.
The lines beside it. ib_letters (2) is the number of letters in the initial balance. Each UTC day starts a new balance; the bars inside its first letters grow its high and low; once the last of those letters has closed, ib_high and ib_low print as dashed amber lines and hold until the next day. Before the balance is set they read NaN and draw nothing.
Where it runs
Any chart of 30 minutes or finer: crypto, stocks, forex and CME futures alike, since the letters are built from the chart's own candles. On a coarser chart the legend chip and the Console say so by name and point to an intrabar input.
When data is missing
A bar with a NaN high or low grows no balance and prints no letter. A day with fewer bars than the initial balance never sets its lines. The profile holds only the days the chart has loaded.
Customize it
- Weekly profiles.
period: "week"stacks a whole week's letters into one profile ("month"a month's); with 30-minute letters the alphabet wraps. - A wider balance. Raise
ib_lettersto 4 for a two-hour initial balance. - Letters only.
display: "letters"drops the blocks for a classic text profile;font_family: "mono"lines the letters up. - Row height. Left out, the row is the chart's own (75 dollars on BTC at 15m, about 25 to 90 rows a day), and a
row_heightso fine that a day holds more than 512 rows is coarsened, withtpo 'tpo': row_height 1 coarsened to 8 (512 rows per day is the chart's limit)in the Console and on the legend chip (Row height). - With volume. Declare
input("profile", volume_profile.cells, { max_cells: 8192 }), addcells: "profile", and switchcolor_modeto"volume"or setvolume_profile: truefor a volume profile beside the letters.
Run it
- In the editor's Explorer, press the Templates icon ("Browse starter templates") and pick TPO Letters under Order flow.
- Press Run on a 5m or 15m chart: the letters print day by day, the point of control and the value area lit, and the initial balance lines appear an hour into each day.
- Hover a row for its letters and count; at the editor's Console prompt, type
ib_highto read the live day's balance high.
Concepts used
- Price canvases for
plot.tpo, the letter rule,period,displayand the profile marks - Plotting for line outputs with a dashed style
- Data sources for the
intrabarandvolume_profilecelled classes a TPO can read instead of the candles