Moving-average cross
A strategy: long when the fast average crosses above the slow one, flat when it crosses back under.
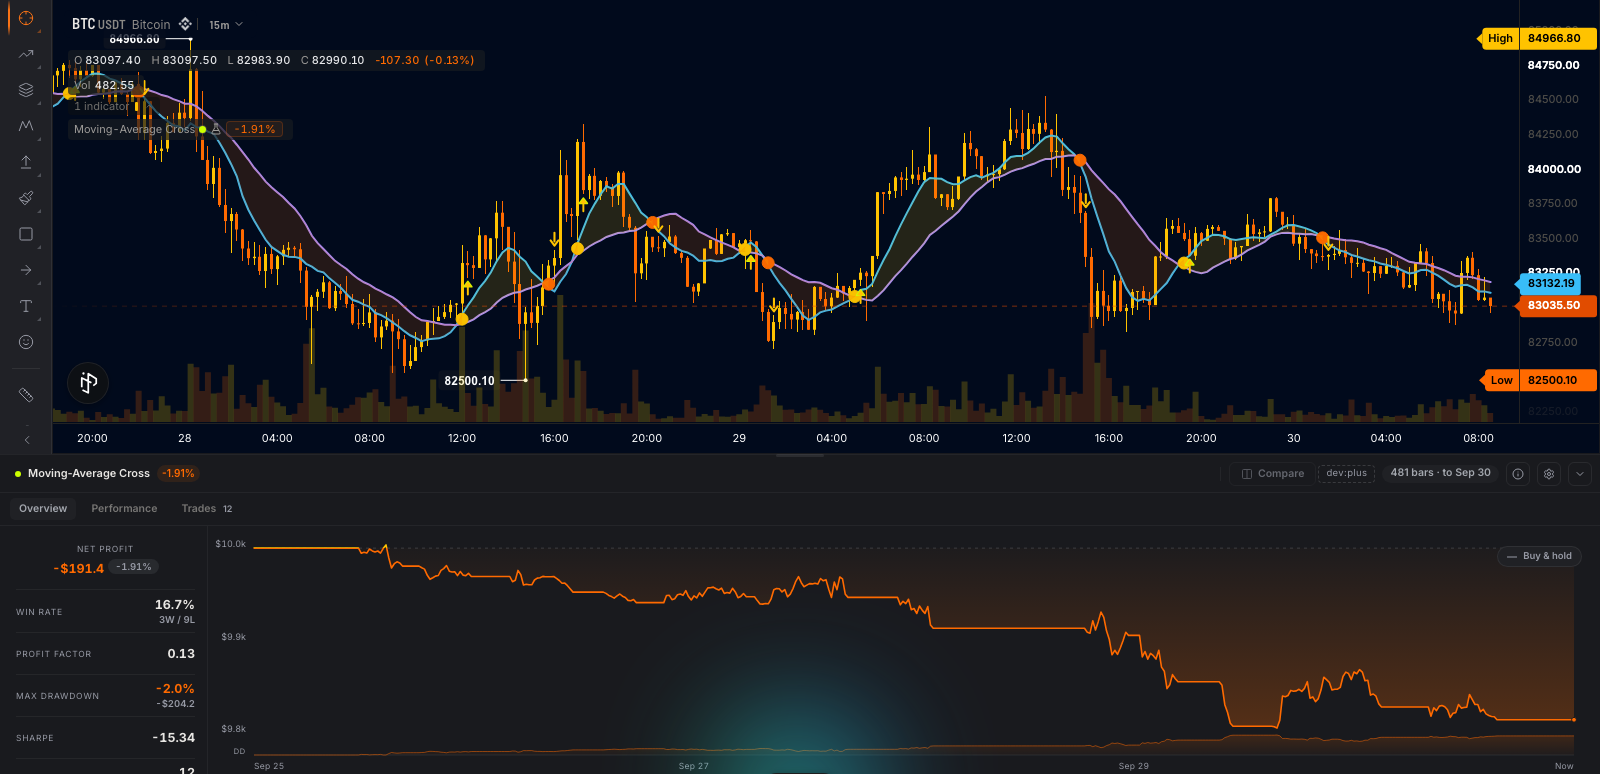
The fast average (sky) and the slow average (violet) on price, a ribbon between them, amber while the fast average leads and orange while it trails, and a mark on the bar of each cross at the price where the lines met: amber for a cross up (the entry fills at the next open), orange for a cross down (the position closes at the next open). The Strategy Tester under the chart holds the fills on the candles, equity against buy and hold, net profit, win rate, profit factor, drawdown, Sharpe and the trade list.
The parts are strategy(...) declared in the source with the order calls in onBar() (Strategies overview), a range between the two averages tinted by a data-only output (Styling), and two shape outputs for the cross marks. This is also the strategy-ma-cross template: the Moving-Average Cross card under Strategies in the editor's starter list, and it compiles as written.
The wrun indicator
// Moving-Average Cross: long when the fast average crosses above the slow one, flat when it crosses back under.
// The trader sees both averages on price, a ribbon between them tinted by which one leads (amber while the fast
// average is on top, orange while it trails), a mark on the bar of each cross at the price where the lines met,
// and the Strategy Tester under the chart with the fills, the equity curve and the numbers.

// strategy({...}) makes the package a strategy: equity, sizing (50% of equity per entry), commission and slippage live here.
strategy({ initialCapital: 10000, qtyType: "percentOfEquity", qtyValue: 50, commissionPercent: 0.05, slippageBps: 2 });
param.int("fast_len", 9, { min: 1, max: 200, label: "Fast length in bars", row: "lengths", description: "Fast average length in bars" }); // two whole numbers on one dialog line: rows naming the same row word sit side by side
param.int("slow_len", 21, { min: 2, max: 400, label: "Slow length in bars", row: "lengths", description: "Slow average length in bars" });
const fastLine = output("fast_ma", line, overlay, { color: "#38bdf8", width: 2, label: "Fast", format: "price", description: "Simple moving average of the close over fast_len bars" }); // the handle names it for the hover card
output("slow_ma", line, overlay, { color: "#a78bfa", width: 2, label: "Slow", format: "price", description: "Simple moving average of the close over slow_len bars" });
output("trend", none, overlay, { description: "1 while the fast average is above the slow one, else 0" });
hover(fastLine, [block.value("Fast", "fast_ma", { format: "price" }), block.rows([["Slow", "slow_ma", "price"], ["Trend", "trend", "int"]])]); // the card the fast average opens under the cursor
output("entry_cross", shape, overlay, { color: "#f8c000", width: 6, description: "The price where the fast average crossed above the slow one; the long entry fills at the next open" });
output("exit_cross", shape, overlay, { color: "#f86800", width: 6, description: "The price where the fast average crossed below the slow one; the position closes at the next open" });
range("fast_ma", "slow_ma", { color_by: "trend", colors: ["rgba(248, 104, 0, 0.14)", "rgba(248, 192, 0, 0.14)"] }); // the ribbon, tinted by the trend

let fastSma = new Sma(9); // onStart() rebuilds both at the chosen lengths
let slowSma = new Sma(21);
const cross = new Cross(); // +1 on the bar the fast average crosses above the slow one, -1 below, 0 otherwise

// onStart() runs once before the first bar: read each setting (i32() = whole bars).
function onStart(): void {
  fastSma = new Sma(i32(p_fast_len()));
  slowSma = new Sma(i32(p_slow_len()));
}

// onBar() runs once per bar: fold the close into both windows and leave while either is still warming up (nothing
// written, no orders); then place the orders (an order fills at the next bar's open, never earlier) and write the
// outputs. The cross marks are NaN on every bar without a cross, so nothing is drawn there.
function onBar(): void {
  const close = bar.close();
  const fast = fastSma.update(close);
  const slow = slowSma.update(close);
  if (isNaN(fast) || isNaN(slow)) return;
  const crossed = cross.update(fast, slow);
  const trend = fast > slow ? 1.0 : 0.0;
  if (crossed == 1) strategy.long("L").send(); // a market entry under the id L, sized by the settings above
  if (crossed == -1) strategy.closeAll(); // every open entry closes at the next open
  const crossPrice = (fast + slow) * 0.5; // where the two averages met on this bar
  out_fast_ma(fast);
  out_slow_ma(slow);
  out_trend(trend);
  out_entry_cross(crossed == 1 ? crossPrice : NaN);
  out_exit_cross(crossed == -1 ? crossPrice : NaN);
}How it works
The file is the strategy. strategy({ initialCapital: 10000, qtyType: "percentOfEquity", qtyValue: 50, commissionPercent: 0.05, slippageBps: 2 }) makes the package a strategy: 10,000 starting equity, 50% of equity per entry, 0.05% commission, 2 bps slippage. The primary input is the chart's own close (bar.close(), no input line needed), the candles the broker fills against.
Orders fill at the next open. onBar() folds the close into two Sma windows (fast_len 9, slow_len 21) and returns early while either is warming up (nothing written, no orders); Cross.update(fast, slow) is +1 on the bar the fast average crosses above the slow one and -1 on the way back. On a cross, strategy.long("L").send() places a market entry under the id L and strategy.closeAll() closes every open entry; both fill at the next bar's open, never earlier.
The look is three outputs. trend (1 while the fast average is above the slow one) is data-only and drives range("fast_ma", "slow_ma", { color_by: "trend", colors: [orange, amber] }), the ribbon; entry_cross and exit_cross carry the price where the two averages met on a cross bar (NaN elsewhere), the two marks.
Where it runs
Every market with candles: perps, spot, prediction markets, FX. The Strategy Tester replays it in your browser over the chart's loaded window and recomputes as you pan; orders fill against the chart's own candles. The Strategies group of the starter list shows where the chart has the Strategy Tester.
When data is missing
The first slow_len bars are warm-up: nothing written, no orders, nothing drawn. A market whose candles stop (a resolved prediction market) leaves the last position where the tester closed it.
Customize it
- Other lengths.
fast_lenandslow_lenare settings; the tester replays any pair. - Both directions. Add
strategy.short("S").send()on a cross down in place of the flat exit (Writing strategies). - Costs and sizing. The five numbers in
strategy({ ... })are the file's: change them and Run again. The tester's Strategy settings opens the overlay's settings, where a param changes a strategy field only when the file links it, the way the risk setting is linked intoqtyValuein Your first strategy; Risk-sized reversion sizes each entry from its stop instead. - Alert on the trades. Once the indicator is published and on a chart, the alert dialog adds the strategy's own choices: "Strategy order placed", "Strategy trade opened or closed", "Strategy position" and "Strategy equity" (Alerts).
Run it
- In the editor's Explorer, press the Templates icon ("Browse starter templates") and pick Moving-Average Cross under Strategies.
- Press Run: the two averages, the ribbon and the cross marks draw on price, and the Strategy Tester under the chart shows the fills, the equity against buy and hold, and the trade list.
Concepts used
- Strategies overview for
strategy(...), the order builders and where they fill - Reading the tester for the numbers under the chart
- Styling for
rangebands and colour ladders