Book Heat
The chart market's resting order book painted behind the candles, bar by bar: every price level the book held when the bar closed is a cell, and the deeper its shade the more size rested there, bids below the price and asks above it on one square-root scale, so a wall reads as a bright band the price has to trade through and a thin book as a faint wash. The heatmap sits under the candles, so the bars stay readable on top of it. Below the chart, the bid-ask imbalance inside a depth window around the mid price, sky while the bids outweigh the asks and orange while they do not.
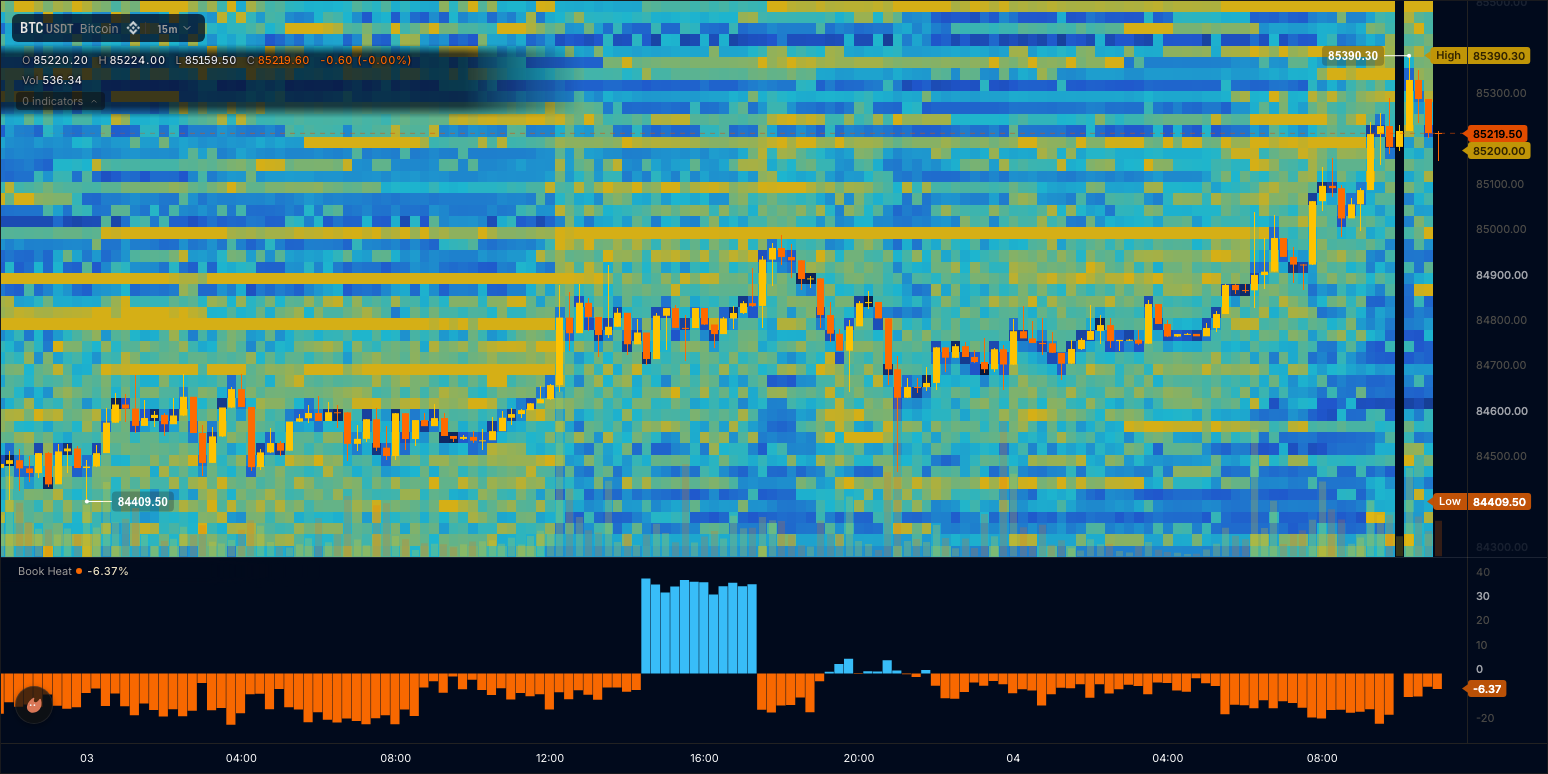
The parts are a celled book.cells input (Order book functions), a plot.heatmap declaration that paints that input's block without any output carrying it (Price canvases), one histogram output read off the same block (Plotting), and a label handle for the one sentence shown on a market without a book (Drawing objects). This is also the book-heat template: the Book Heat card under Order flow in the editor's starter list, and it compiles as written.
The wrun indicator
// Book Heat: the chart market's resting order book painted behind the candles as a heatmap of resting size by price,
// bar by bar: the deeper the shade, the more size rested at that price when the bar closed, bids below the price and
// asks above it on one scale, so a wall reads as a bright band the price has to trade through. Below the chart, the
// bid-ask imbalance inside a depth window around the mid: sky while the bids outweigh the asks, orange while they do not.

param.number("depth_pct", 1.0, { min: 0.1, max: 10, step: 0.1, label: "Depth window in percent", description: "Depth window for the imbalance: percent around the mid price, each side" });
input("close", ohlcv.close); // the primary input: the chart's own candles define the grid
input("book", book.cells, { max_cells: 1000, block_size: 10, description: "The resting book at the bar's close, one [price, size, side] level per tuple" }); // side +1 bid, -1 ask; the chart serves its own market's book, up to 500 levels a side
output("imbalance", histogram, lower, { colors: ["#38bdf8", "#f86800"], format: "%", label: "Book imbalance", description: "Bid size minus ask size inside the depth window, as a percent of both" }); // sky above zero, orange below
plot.heatmap({ name: "book_heat", cells: "book", value: "size", behind_candles: true, palette: ["theme.bg", "#2563eb", "#22d3ee", "#facc15"], scale: "sqrt", auto_quantile: 0.98, opacity: 0.85, label: "Resting size", tooltip: "{{value:si}} resting at {{price}}" }); // the host paints the block the input already delivers; no output carries it
string("note", { max_bytes: 40 }); // the one sentence shown when the market serves no order book
handles.label({ anchor: "top_right", align: "right", color: "#94a3b8", size: 12, style: "plain", safe_area: true }); // that sentence: plain slate words at the pane's top right, clear of the chart's buttons

const TUPLE = 3; // f64s per level: price, size, side
const note = draw.label(0); // the one slate sentence; a handle allocates once at module load
let depth = 0.01; // the setting, read in onStart()
let bookSeen = false; // the market served a book on some bar

function onStart(): void {
  depth = p_depth_pct() / 100.0;
}

// onBar() runs once per bar: the host paints the block itself; the module reads the same block for the imbalance.
function onBar(): void {
  const n = in_book_cells();
  if (n > 0) bookSeen = true;
  if (bar.isLast() && !bookSeen) { // no book on any bar (FX, stocks): one sentence in place of an empty map and pane
    sb_clear();
    sb_text("No order book on this market");
    note.set(16.0, 12.0).text(str_note_sb);
  }
  if (n < TUPLE * 2) { // an empty block (no book served for this bar) or one level alone: no reading
    out_imbalance(NaN);
    return;
  }
  const cells = in_book_view(); // this bar's levels in place: the first n values of the build's own buffer
  let bestBid = -Infinity;
  let bestAsk = Infinity;
  for (let i = 0; i + TUPLE - 1 < n; i += TUPLE) {
    if (cells[i + 2] > 0.0) {
      if (cells[i] > bestBid) bestBid = cells[i];
    } else if (cells[i] < bestAsk) bestAsk = cells[i];
  }
  if (!isFinite(bestBid) || !isFinite(bestAsk)) { // one side only: no mid to measure around
    out_imbalance(NaN);
    return;
  }
  const mid = (bestBid + bestAsk) * 0.5;
  let bids = 0.0;
  let asks = 0.0;
  for (let i = 0; i + TUPLE - 1 < n; i += TUPLE) {
    if (Math.abs(cells[i] - mid) > mid * depth) continue; // outside the window
    if (cells[i + 2] > 0.0) bids += cells[i + 1];
    else asks += cells[i + 1];
  }
  const total = bids + asks;
  out_imbalance(total > 0.0 ? (100.0 * (bids - asks)) / total : NaN);
}How it works
The block is the canvas. input("book", book.cells, { max_cells: 1000, block_size: 10 }) delivers the resting book at each bar's close as [price, size, side] tuples, side +1 for a bid level and -1 for an ask level, up to 500 levels a side. plot.heatmap({ name: "book_heat", cells: "book", value: "size" }) tells the host to paint that block: one cell per level, one column per bar, the cell's height the book's own price grouping (row_height overrides it), its colour the level's size on the palette. The module never copies or forwards the block; the host reads the same rows the input already delivered.
The scale. palette runs from the chart's background (theme.bg) through blue and cyan to yellow, low to high; scale: "sqrt" keeps the many small levels visible beside the walls; auto_quantile: 0.98 sets the top of the scale at the 98th percentile of every cell in the run, so a single outsized order does not flatten the rest. value picks what a cell reads: "size" (both sides), "bid", "ask", or "signed" (bids positive, asks negative, which centres the palette on zero). behind_candles: true is the default; false paints over the candles instead. opacity: 0.85 leaves the grid visible through the cells.
The reading beside it. The histogram sums bid and ask size inside depth_pct (1%) of the mid, the mid being the best bid and the best ask averaged, and prints their difference as a percent of both: sky above zero, orange below (the two colors of a histogram are its sign colours). A bar whose block is empty reads NaN and draws nothing, in the pane and on the canvas alike.
The hover. tooltip: "{{value:si}} resting at {{price}}" puts a readout under the cursor over any cell, label its title; drop tooltip for a heatmap with no hover.
Where it runs
Any market the chart serves an order book for: crypto spot and perpetual venues, Polymarket markets. The chart serves the book snapshots its own order book lane fetches for the chart's market; block_size is required by the declaration but the chart reads neither it nor max_depth. The heatmap paints as far back as the book history the chart holds; older bars carry an empty block.
When data is missing
A market with no book lane is refused by name before any fetch, naming the input and the way out. A market whose bars all arrive without a book (FX and stocks, where the lane answers empty) runs: the map stays empty, the histogram reads NaN, and one line of words shows at the top right of the chart, No order book on this market, in plain slate: the note label handle, written on the live bar while no bar has brought a book, pinned to the pane's top right corner, right-aligned and safe_area: true, so it clears the chart's own buttons. A bar with no snapshot carries an empty block: the column is blank and the histogram reads NaN. A book that lists one side only (a halted market, a one-sided prediction market) has no mid, so the histogram reads NaN while the heatmap still paints the side it has.
Customize it
- Read one side. Change
value: "size"to"bid"or"ask"to paint one side of the book, or to"signed"for a diverging map (bids warm, asks cold) with the palette["theme.down", "theme.bg", "theme.up"]. - Fix the scale. Set
minandmaxin size units to compare days on one scale;auto_quantilethen goes away. - Coarser rows.
row_height: 50groups the book into 50-unit price rows on a market whose levels are finer than the chart can show. - Over the candles.
behind_candles: falsepaints the cells over the bars, withopacity: 0.5to keep them visible.
Run it
- In the editor's Explorer, press the Templates icon ("Browse starter templates") and pick Book Heat under Order flow.
- Press Run on a liquid crypto chart (Binance Futures BTCUSDT, for example): the book paints behind the candles as the snapshots arrive and the imbalance pane fills below.
- Hover a cell for its resting size; at the editor's Console prompt, type
imbalanceto read the live bar's reading. - Open the indicator's settings: on the Style page, the heatmap's Sensitivity slider recolours it live, toward Vivid to light up thinner levels, toward Subtle to keep the brightest colours for the walls (The Style page).
Concepts used
- Order book functions for the
bookcelled class, its tuple and the depth-window scans - Price canvases for
plot.heatmap, thevaluewords, the colour scale and the hover readout - Plotting for histogram outputs and their sign colours