Depth curve
The market's resting order book as the classic depth curve under the chart: a pane with price across and dollars up, the bids in teal stepping up to the left of the mid, the asks in orange stepping up to the right, both as staircases (a book is steps, never a smooth curve) filled to the axis.
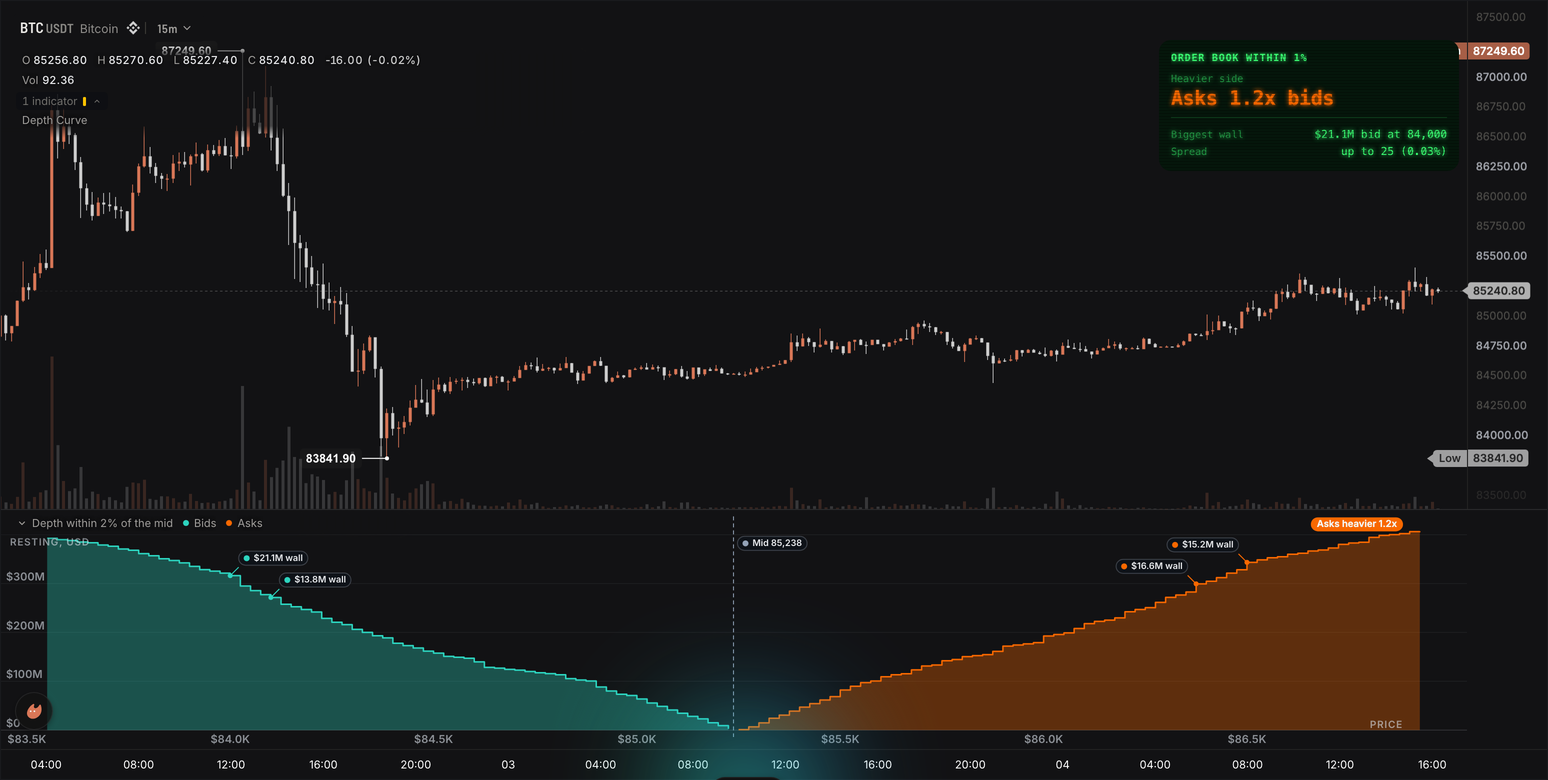
The steeper side is the heavier side. A dashed slate marker stands at the mid with its price ("Mid 85,115"), and a callout pins on each of the two biggest single levels per side ("$26.1M wall"), where the staircase jumps. A chip on the pane's title row gives the verdict within near_pct of the mid: "Bids heavier 1.4x", "Asks heavier 1.3x", "Balanced book", or "Thin near the mid" when nothing rests in the band. At the top left of the price pane, under the legend and clear of the newest candles, a card in the phosphor look (green monospace type with a glow on a near-black green card, scanlines over it, the same paper on a light chart) titled "Order book within 1%" leads with one big line, "Bids 1.4x asks" (teal when the bids are heavier, orange when the asks are, slate when balanced), then two rows: "Biggest wall" ("$26.1M bid at 85,100") and "Spread" ("up to 25 (0.03%)" when the touch sits inside one step of the book's grouping, else the percent of the mid and the price gap, as in "0.07% (0.0001)"). Everything is read from the live snapshot the chart serves, about once a second on the live bar; history bars only feed the data outputs and draw nothing.
The parts are a book.cells input, one [price, size, side] tuple per level (Order flow), a frame feeding a panel.line on a number axis with two step series filled to the axis, a dashed mid marker, wall callouts pinned at an exact y, a badge and a caption (Cards, frames and panels), and a render.hud card in the phosphor look whose headline carries the one sentence when the market has no book (HUD cards, Looks). This is also the depth-curve template: the Depth Curve card under Beyond the time axis in the editor's starter list, and it compiles as written.
The wrun indicator
// Depth Curve: the market's resting order book as the classic depth curve under the chart. Cumulative bid dollars step
// up to the left of the mid in teal, cumulative ask dollars step up to the right in orange, each side filled to the
// axis, a dashed marker at the mid, and a callout pinned on the two biggest single walls of each side ("$26.1M wall").
// The chip on the panel's title row names the heavier side within near_pct of the mid ("Bids heavier 1.4x"). A card at
// the top left of the price pane, under the legend and clear of the newest candles (phosphor by default, glass as the
// other look), leads with the same ratio as its one big number and reads the biggest wall and the spread under it. The trader sees which side of the book is heavier, how steep each
// side is, and where the walls sit, all from the live snapshot the chart serves about once a second.
// A market without an order book (gold, prediction markets) says so on the card, "No order book", and draws nothing else.

section("Reach");
param.number("range_pct", 2.0, { min: 0.5, max: 10.0, step: 0.5, label: "Curve reach, percent", description: "How far from the mid the curve reaches, percent each side" });
param.number("near_pct", 1.0, { min: 0.1, max: 5.0, step: 0.1, label: "Ratio band, percent", description: "The band the ratio and the chip read, percent each side of the mid" });

// Inputs: the chart's own candles set the grid, then the book: one [price, size, side] row per level, side +1 a bid
// and -1 an ask, sizes in coins. The chart serves its own market's book at its own grouping, up to 500 levels a side,
// so 1000 rows hold any bar; block_size is required by the declaration and the chart does not read it.
input("close", ohlcv.close);
input("book", book.cells, { max_cells: 1000, block_size: 10 });

// Outputs: data-only, one value per bar, so a watch or an alert can read the book too.
output("side", none, overlay, { description: "0 asks heavier, 1 balanced or no book, 2 bids heavier, within near_pct of the mid" });
output("ratio", none, overlay, { format: "0.00", description: "Bid dollars over ask dollars within near_pct of the mid" });
output("bids_near", none, overlay, { color: "#2dd4bf", format: "usd", description: "Dollars bid within near_pct of the mid" });
output("asks_near", none, overlay, { color: "#f86800", format: "usd", description: "Dollars offered within near_pct of the mid" });
output("spread_pct", none, overlay, { format: "%", description: "Best ask minus best bid, as a percent of the mid" });
output("bid_wall", none, overlay, { color: "#2dd4bf", format: "price", description: "The price of the biggest bid within range_pct of the mid" });
output("bid_wall_usd", none, overlay, { format: "usd", description: "Dollars resting at the bid wall" });
output("ask_wall", none, overlay, { color: "#f86800", format: "price", description: "The price of the biggest ask within range_pct of the mid" });
output("ask_wall_usd", none, overlay, { format: "usd", description: "Dollars resting at the ask wall" });
string("near_text", { max_bytes: 8 }); // "1%": the card title's band, written on the live bar
string("ratio_text", { max_bytes: 40 }); // "Bids 1.4x asks", or "No order book" when the market has none
string("wall_text", { max_bytes: 40 }); // "$26.1M bid at 85,100"
string("spread_text", { max_bytes: 32 }); // "0.0001% (0.10)"
const depth = frame("depth", { max_bytes: 65536 }); // the curve: one row per level, [price, bid dollars | null, ask dollars | null]

// The depth curve: price across, dollars up, both sides stepped (a book is a staircase, never a smooth curve) and
// filled to the axis in their own ink; the mid marker, the four wall callouts and the chip are written per run.
panel.line({
  name: "depth_curve",
  title: "Order book depth",
  x: "number",
  place: "below",
  frame: depth,
  series: [
    { name: "Bids", color: "#2dd4bf", width: 1.5, style: "step", fill: true, fill_color: "#2dd4bf55" },
    { name: "Asks", color: "#f86800", width: 1.5, style: "step", fill: true, fill_color: "#f8680055" },
  ],
  chrome: "grid",
  legend_style: "title",
  hover_card: true,
  x_format: "usd",
  x_title: "Price",
  y_title: "Resting, USD",
  format: "usd",
  decimals: 0,
  y_zero: true,
  height_frac: 0.32,
});

// The card: the heavier side as the one big number, then the biggest wall and the spread as two rows; at the top left
// under the legend, so it covers the oldest candles on screen, never the newest.
render.hud("depth_card", {
  position: "top_left",
  safe_area: true,
  look: "phosphor", // the other look of this example is glass: every HUD gets a Look row on the Style page
  title: "Order book within {{near_text}}",
  columns: 1,
  width: 300,
  tiles: [
    tile.pill("Heavier side", "ratio_text", { headline: true, font_size: 20, color_by: "side", colors: ["#f86800", "#94a3b8", "#2dd4bf"] }),
    tile.rows([["Biggest wall", "wall_text"], ["Spread", "spread_text"]]),
  ],
});

const LEVELS = 500; // the chart's book carries at most 500 levels a side
const ASKS_HEAVIER = 0.0; // the side ladder, in the colours' order
const BALANCED = 1.0;
const BIDS_HEAVIER = 2.0;
const LEAN = 1.05; // the ratio either side of 1 before a side is named

const bidPx = new StaticArray<f64>(LEVELS); // the last snapshot with both sides, copied per bar, sorted on the live bar
const bidSz = new StaticArray<f64>(LEVELS);
const askPx = new StaticArray<f64>(LEVELS);
const askSz = new StaticArray<f64>(LEVELS);
const bidCum = new StaticArray<f64>(LEVELS); // cumulative dollars from the touch outward, per sorted level
const askCum = new StaticArray<f64>(LEVELS);

let rangePct = 2.0; // settings, read in onStart()
let nearPct = 1.0;
let bids: i32 = 0; // levels in the stored snapshot
let asks: i32 = 0;
let bookBar: i32 = -1; // the bar index the stored snapshot came from, -1 while no bar carried both sides
let barIndex: i32 = -1;
let mid: f64 = NaN; // this bar's readings, NaN without a usable snapshot
let bestBid: f64 = NaN;
let bestAsk: f64 = NaN;
let bidsNear: f64 = NaN;
let asksNear: f64 = NaN;
let bidWall: f64 = NaN;
let bidWallUsd: f64 = NaN;
let askWall: f64 = NaN;
let askWallUsd: f64 = NaN;
let bidWall2: f64 = NaN; // the second biggest wall per side, for the callouts
let bidWall2Usd: f64 = NaN;
let askWall2: f64 = NaN;
let askWall2Usd: f64 = NaN;
let decimals: i32 = 2; // the market's price decimals, read off the book's tick
let tick: f64 = NaN; // the book's own price step (the smallest gap between neighbouring levels)

// readBook() copies this bar's snapshot into the side arrays. The chart hands the bids best first and the asks from
// the highest price down, but every read goes by price and side, never by position. False when the bar has no usable
// snapshot (none delivered, a side missing, or a crossed book); the arrays then keep the newest usable one.
function readBook(): bool {
  const n = in_book_cells(); // numbers delivered this bar: 0 for an empty block, -1 when the bar carries none
  if (n < 6) return false;
  const cells = in_book_view();
  let hiBid = -Infinity;
  let loAsk = Infinity;
  let nb: i32 = 0;
  let na: i32 = 0;
  for (let i = 0; i + 2 < n; i += 3) { // first pass: is the snapshot usable? (nothing is stored yet)
    const price = cells[i];
    if (!(price > 0.0) || !(cells[i + 1] > 0.0)) continue; // an empty level is served but rests nothing
    if (cells[i + 2] > 0.0) { nb += 1; if (price > hiBid) hiBid = price; }
    else if (cells[i + 2] < 0.0) { na += 1; if (price < loAsk) loAsk = price; }
  }
  if (nb == 0 || na == 0 || !(loAsk > hiBid)) return false;
  nb = 0;
  na = 0;
  for (let i = 0; i + 2 < n; i += 3) { // second pass: copy the levels, at most LEVELS a side
    const price = cells[i];
    const size = cells[i + 1];
    if (!(price > 0.0) || !(size > 0.0)) continue;
    if (cells[i + 2] > 0.0) { if (nb < LEVELS) { bidPx[nb] = price; bidSz[nb] = size; nb += 1; } }
    else if (cells[i + 2] < 0.0) { if (na < LEVELS) { askPx[na] = price; askSz[na] = size; na += 1; } }
  }
  bids = nb;
  asks = na;
  bookBar = barIndex;
  return true;
}

function clearReadings(): void {
  mid = NaN; bestBid = NaN; bestAsk = NaN;
  bidsNear = NaN; asksNear = NaN;
  bidWall = NaN; bidWallUsd = NaN; askWall = NaN; askWallUsd = NaN;
  bidWall2 = NaN; bidWall2Usd = NaN; askWall2 = NaN; askWall2Usd = NaN;
}

// measure() reads the stored snapshot: the touch and the mid, the dollars within near_pct of the mid per side, and
// the two biggest single levels within range_pct per side.
function measure(): void {
  clearReadings();
  let hiBid = -Infinity;
  let loAsk = Infinity;
  for (let k = 0; k < bids; k++) if (bidPx[k] > hiBid) hiBid = bidPx[k];
  for (let k = 0; k < asks; k++) if (askPx[k] < loAsk) loAsk = askPx[k];
  bestBid = hiBid;
  bestAsk = loAsk;
  mid = (hiBid + loAsk) * 0.5;
  const near = mid * nearPct / 100.0;
  const reach = mid * rangePct / 100.0;
  bidsNear = 0.0;
  asksNear = 0.0;
  for (let k = 0; k < bids; k++) {
    const price = bidPx[k];
    const dollars = price * bidSz[k];
    const away = mid - price;
    if (away <= near) bidsNear += dollars;
    if (away <= reach) {
      if (isNaN(bidWallUsd) || dollars > bidWallUsd) { bidWall2 = bidWall; bidWall2Usd = bidWallUsd; bidWall = price; bidWallUsd = dollars; }
      else if (isNaN(bidWall2Usd) || dollars > bidWall2Usd) { bidWall2 = price; bidWall2Usd = dollars; }
    }
  }
  for (let k = 0; k < asks; k++) {
    const price = askPx[k];
    const dollars = price * askSz[k];
    const away = price - mid;
    if (away <= near) asksNear += dollars;
    if (away <= reach) {
      if (isNaN(askWallUsd) || dollars > askWallUsd) { askWall2 = askWall; askWall2Usd = askWallUsd; askWall = price; askWallUsd = dollars; }
      else if (isNaN(askWall2Usd) || dollars > askWall2Usd) { askWall2 = price; askWall2Usd = dollars; }
    }
  }
}

// Insertion sort of one side's price and size pairs by price: bids descending (best first), asks ascending. The
// chart's own order is already sorted one way or the other, so this costs little, and it runs on the live bar only.
function sortSide(px: StaticArray<f64>, sz: StaticArray<f64>, n: i32, ascending: bool): void {
  for (let i = 1; i < n; i++) {
    const p = px[i];
    const s = sz[i];
    let j = i - 1;
    while (j >= 0 && (ascending ? px[j] > p : px[j] < p)) {
      px[j + 1] = px[j];
      sz[j + 1] = sz[j];
      j -= 1;
    }
    px[j + 1] = p;
    sz[j + 1] = s;
  }
}

// The book's price step and the decimals the market prints in, read off the smallest gap between neighbouring levels
// of the sorted sides (the chart serves the book at its own grouping, so the step is the grouping, not the exchange tick).
function readTick(): void {
  tick = Infinity;
  for (let k = 1; k < bids && k < 40; k++) { const gap = bidPx[k - 1] - bidPx[k]; if (gap > 0.0 && gap < tick) tick = gap; }
  for (let k = 1; k < asks && k < 40; k++) { const gap = askPx[k] - askPx[k - 1]; if (gap > 0.0 && gap < tick) tick = gap; }
  if (!(tick < Infinity)) { tick = NaN; decimals = 2; return; }
  let d: i32 = 0;
  let t = tick;
  while (d < 6 && Math.abs(t - Math.round(t)) > 1e-6) { t *= 10.0; d += 1; }
  decimals = d;
}

// The cumulative dollars at one level of a sorted side (the point a wall callout pins on); NaN when the level is
// outside the drawn reach.
function cumAt(px: StaticArray<f64>, cum: StaticArray<f64>, n: i32, price: f64): f64 {
  for (let k = 0; k < n; k++) if (px[k] == price) return cum[k];
  return NaN;
}

// Text sinks: 0 writes into the string builder (the card's slots), 1 into the frame buffer (the panel's labels).
function putText(sink: i32, s: string): void { if (sink == 0) sb_text(s); else fb_text(s); }
function putInt(sink: i32, v: i32): void { if (sink == 0) sb_int(v); else fb_int(v); }
function putFixed(sink: i32, v: f64, d: i32): void { if (sink == 0) sb_f64(v, d); else fb_f64(v, d); }

// A price with thousands separators and the market's decimals: 85,115 or 0.1412.
function putPrice(sink: i32, v: f64, d: i32): void {
  let scale = 1.0;
  for (let i = 0; i < d; i++) scale *= 10.0;
  const rounded = Math.round(v * scale) / scale;
  const whole = Math.floor(rounded);
  let group = 1.0;
  while (whole >= group * 1000.0) group *= 1000.0;
  let rest = whole;
  let first = true;
  while (group >= 1.0) {
    const g = Math.floor(rest / group);
    if (!first) {
      putText(sink, ",");
      if (g < 100.0) putText(sink, "0");
      if (g < 10.0) putText(sink, "0");
    }
    putInt(sink, i32(g));
    rest -= g * group;
    group /= 1000.0;
    first = false;
  }
  if (d > 0) {
    putText(sink, ".");
    let frac = i32(Math.round((rounded - whole) * scale));
    if (frac >= i32(scale)) frac = i32(scale) - 1;
    let place = i32(scale) / 10;
    while (place > 1 && frac < place) { putText(sink, "0"); place /= 10; }
    putInt(sink, frac);
  }
}

// Money as $26.1M, $950.0K, $1.2B, one decimal at K and up, whole dollars under 1K.
function putUsd(sink: i32, x: f64): void {
  putText(sink, "$");
  if (x >= 1.0e9) { putFixed(sink, x / 1.0e9, 1); putText(sink, "B"); }
  else if (x >= 1.0e6) { putFixed(sink, x / 1.0e6, 1); putText(sink, "M"); }
  else if (x >= 1.0e3) { putFixed(sink, x / 1.0e3, 1); putText(sink, "K"); }
  else putFixed(sink, x, 0);
}

// One wall callout in the frame's markers list: pinned on the side's staircase at the wall's price, at the exact
// cumulative value there (an exact y, because the lane pins a named series' callout on the first series only).
function fbWallMarker(price: f64, dollars: f64, y: f64, color: string): void {
  if (isNaN(price) || isNaN(y)) return;
  fb_text(',{"x":');
  fb_num(price);
  fb_text(',"valign":"point","y":');
  fb_f64(y, 0);
  fb_text(',"color":');
  fb_str(color);
  fb_text(',"badge":true,"label":"');
  putUsd(1, dollars);
  fb_text(' wall"}');
}

// The curve frame, from the stored snapshot: rows ascending by price (the far bid up to the best bid, then the best
// ask up to the far ask), each row one side's cumulative dollars from the touch outward and null on the other side.
function writeCurve(side: f64, ratio: f64): void {
  const reach = mid * rangePct / 100.0;
  let nb: i32 = 0;
  let cum = 0.0;
  for (let k = 0; k < bids; k++) {
    if (mid - bidPx[k] > reach) break;
    cum += bidPx[k] * bidSz[k];
    bidCum[k] = cum;
    nb = k + 1;
  }
  let na: i32 = 0;
  cum = 0.0;
  for (let k = 0; k < asks; k++) {
    if (askPx[k] - mid > reach) break;
    cum += askPx[k] * askSz[k];
    askCum[k] = cum;
    na = k + 1;
  }
  fb_clear();
  fb_text('{"title":"Depth within ');
  fb_f64(rangePct, rangePct == Math.floor(rangePct) ? 0 : 1);
  fb_text('% of the mid","rows":[');
  let rows: i32 = 0;
  for (let k = nb - 1; k >= 0; k--) {
    if (rows > 0) fb_text(",");
    fb_text("[");
    fb_num(bidPx[k]);
    fb_text(",");
    fb_f64(bidCum[k], 0);
    fb_text(",null]");
    rows += 1;
  }
  for (let k = 0; k < na; k++) {
    if (rows > 0) fb_text(",");
    fb_text("[");
    fb_num(askPx[k]);
    fb_text(",null,");
    fb_f64(askCum[k], 0);
    fb_text("]");
    rows += 1;
  }
  fb_text('],"markers":[{"x":');
  fb_num(mid);
  fb_text(',"label":"Mid ');
  putPrice(1, mid, decimals);
  fb_text('","line_style":"dashed","color":"#94a3b8","badge":true}');
  fbWallMarker(bidWall, bidWallUsd, cumAt(bidPx, bidCum, nb, bidWall), "#2dd4bf");
  fbWallMarker(bidWall2, bidWall2Usd, cumAt(bidPx, bidCum, nb, bidWall2), "#2dd4bf");
  fbWallMarker(askWall, askWallUsd, cumAt(askPx, askCum, na, askWall), "#f86800");
  fbWallMarker(askWall2, askWall2Usd, cumAt(askPx, askCum, na, askWall2), "#f86800");
  fb_text('],"badge":{"text":"');
  if (side == BIDS_HEAVIER) { fb_text("Bids heavier "); fb_f64(ratio, 1); fb_text("x"); }
  else if (side == ASKS_HEAVIER) { fb_text("Asks heavier "); fb_f64(1.0 / ratio, 1); fb_text("x"); }
  else if (isNaN(ratio)) fb_text("Thin near the mid");
  else fb_text("Balanced book");
  fb_text('","color":');
  fb_str(side == BIDS_HEAVIER ? "#2dd4bf" : side == ASKS_HEAVIER ? "#f86800" : "#94a3b8");
  fb_text("}");
  if (bookBar != barIndex) {
    fb_text(',"caption":"Last snapshot, ');
    fb_int(barIndex - bookBar);
    fb_text(' bars ago"');
  }
  fb_text("}");
  writeFrameBuffer(FRAME_DEPTH);
}

function onStart(): void {
  rangePct = p_range_pct();
  nearPct = p_near_pct();
}

// onBar() runs once per bar: read the snapshot and write the data outputs; on the live bar write the card's words and
// the curve from the newest snapshot the chart delivered.
function onBar(): void {
  barIndex += 1;
  if (readBook()) measure();
  else clearReadings();
  const ratio = bidsNear > 0.0 && asksNear > 0.0 ? bidsNear / asksNear : NaN;
  let side = BALANCED;
  if (ratio >= LEAN) side = BIDS_HEAVIER;
  else if (ratio <= 1.0 / LEAN) side = ASKS_HEAVIER; // a NaN ratio passes neither test and stays balanced
  const spreadPct = isNaN(mid) ? NaN : ((bestAsk - bestBid) / mid) * 100.0;
  out_side(side);
  out_ratio(ratio);
  out_bids_near(bidsNear);
  out_asks_near(asksNear);
  out_spread_pct(spreadPct);
  out_bid_wall(bidWall);
  out_bid_wall_usd(bidWallUsd);
  out_ask_wall(askWall);
  out_ask_wall_usd(askWallUsd);
  if (!bar.isLast()) return;

  sb_clear();
  sb_f64(nearPct, nearPct == Math.floor(nearPct) ? 0 : 1);
  sb_text("%");
  str_near_text_sb();
  if (bookBar < 0) { // no bar ever carried both sides of a book: the short sentence that fits the headline, nothing else
    sb_clear();
    sb_text("No order book");
    str_ratio_text_sb();
    return;
  }
  if (isNaN(mid)) measure(); // the live bar carries no snapshot: the card and the curve read the newest one instead
  sortSide(bidPx, bidSz, bids, false); // bids best first, asks best first: the curve walks each side from the touch
  sortSide(askPx, askSz, asks, true);
  readTick();
  const r = bidsNear > 0.0 && asksNear > 0.0 ? bidsNear / asksNear : NaN;
  let s = BALANCED;
  if (r >= LEAN) s = BIDS_HEAVIER;
  else if (r <= 1.0 / LEAN) s = ASKS_HEAVIER;
  sb_clear();
  if (s == BIDS_HEAVIER) { sb_text("Bids "); sb_f64(r, 1); sb_text("x asks"); }
  else if (s == ASKS_HEAVIER) { sb_text("Asks "); sb_f64(1.0 / r, 1); sb_text("x bids"); }
  else if (isNaN(r)) sb_text("Nothing resting within the band");
  else sb_text("Balanced book");
  str_ratio_text_sb();
  sb_clear();
  if (isNaN(bidWallUsd) && isNaN(askWallUsd)) sb_text("-");
  else if (isNaN(askWallUsd) || bidWallUsd >= askWallUsd) { putUsd(0, bidWallUsd); sb_text(" bid at "); putPrice(0, bidWall, decimals); }
  else { putUsd(0, askWallUsd); sb_text(" ask at "); putPrice(0, askWall, decimals); }
  str_wall_text_sb();
  sb_clear();
  const gap = bestAsk - bestBid;
  const sp = (gap / mid) * 100.0;
  if (!isNaN(tick) && gap <= tick * 1.0001) { // the touch sits inside one step of the book's grouping
    sb_text("up to ");
    putPrice(0, tick, decimals);
    sb_text(" (");
    sb_f64(sp, sp >= 0.01 ? 2 : 4);
    sb_text("%)");
  } else {
    sb_f64(sp, sp >= 0.01 ? 2 : 4);
    sb_text("% (");
    putPrice(0, gap, decimals);
    sb_text(")");
  }
  str_spread_text_sb();
  writeCurve(s, r);
}How it works
The book is a block of tuples. input("book", book.cells, { max_cells: 1000, block_size: 10 }) hands onBar() this bar's snapshot as one [price, size, side] tuple per level, side +1 a bid and -1 an ask, sizes in coins, up to 500 levels a side, so 1000 tuples hold any bar; block_size is required by the declaration and the chart keeps its own grouping. in_book_cells() counts the numbers delivered (tuples times three), 0 for an empty block and -1 for a bar that carries none, and in_book_view() is the cells in place. readBook() walks whole tuples by price and side, never by position, and copies the snapshot into the side arrays only when both sides are present and the book is not crossed; otherwise the arrays keep the newest usable one and bookBar remembers which bar it came from.
Every bar writes the numbers. The mid is (best bid + best ask) / 2 and a level's dollars are price times size. measure() sums the dollars within near_pct of the mid per side and finds the two largest single levels per side within range_pct; the ratio is bid dollars over ask dollars in the band, and side reads 2 (bids heavier) at LEAN (1.05) and up, 0 (asks heavier) at 1/1.05 and under, 1 between or when nothing rests in the band. The nine data-only outputs (side, ratio, bids_near, asks_near, spread_pct, bid_wall, bid_wall_usd, ask_wall, ask_wall_usd) are written on every bar, so a watch or an alert can read the book too; a bar without a usable snapshot writes NaN to them (side reads 1). The sort, the tick and the words wait for bar.isLast().
One frame is the curve. On the live bar sortSide() orders each side best first, and writeCurve() builds the depth frame in the frame buffer with the fb_* builders, allocation-free: one row per level within range_pct, [price, bid dollars | null, ask dollars | null], ascending by price, each side's cumulative dollars from the touch outward, so the bids fall toward the mid, the asks rise away from it, and the two staircases meet at the mid with the spread as the gap between them. panel.line draws it below the chart on a number axis (x: "number", x_format: "usd", so the price ticks read "$85.0K") with style: "step" on both series and fill: true with a 55-alpha fill_color, so the area reads without hiding the grid. chrome: "grid" is what the step series, the fills and the markers need; the value axis prints whole dollars (format: "usd", decimals: 0), y_zero: true keeps zero on it, hover_card: true opens a readout under the pointer, and height_frac: 0.32 gives the pane about a third of the chart.
Markers, callouts, chip and caption ride the frame. Beside rows, the frame carries markers: the mid as a dashed slate line (line_style: "dashed", badge: true, its label "Mid 85,115" through putPrice()), and up to four wall callouts, each a marker with valign: "point" at the wall's price and an exact y, the cumulative dollars at that level from cumAt(), so the dot sits on top of the jump and fbWallMarker() prints "$26.1M wall" beside it through putUsd(). The frame's badge is the chip on the title row, its text and colour following side (teal, orange or slate); the caption ("Last snapshot, 3 bars ago") is written only when the live bar carried no snapshot and the curve reads an older one. The frame's title prints the reach ("Depth within 2% of the mid").
The card reads slots and a ladder. render.hud("depth_card", { position: "top_left", safe_area: true, look: "phosphor", title: "Order book within {{near_text}}", columns: 1, width: 300, tiles: [...] }) is the card: a tile.pill headline reading the ratio_text slot at font_size: 20, coloured by the side ladder (color_by: "side", orange, slate, teal), and a tile.rows of wall_text and spread_text. The slots are written on the live bar with the sb_* builders, and the title takes the band from the near_text slot ("1%"), since a HUD title resolves outputs and slots, not settings. Prices print with thousands separators and the decimals the book's step needs: readTick() reads the smallest gap between neighbouring levels (25 gives 0 decimals, 0.0001 gives 4) and putPrice() writes them digit by digit into either sink, so BTC prints "85,115" and a sub-dollar alt prints "0.1412".
The spread is the book's step. The chart serves the book at its own grouping (25-dollar steps on BTCUSDT), so the best bid and best ask groups sit one step apart whatever the exchange spread is: a touch inside one step reads "up to 25 (0.03%)", and a wider gap prints the percent of the mid and the price gap ("0.07% (0.0001)"), with 2 decimals at 0.01% and up and 4 under. spread_pct carries the same percent as a data-only output.
Where it runs
Any market the chart serves an order book for: crypto perpetuals and spot on Binance, Bybit, OKX, Hyperliquid and the other venues, on any interval (15m and 1h alike): the curve reads the live snapshot, not the bars. No market refuses the run by name: where there is no book the lane answers an empty block on every bar and the run goes on without a toast, so the card does the telling (below). The book and the candles are two lanes, so the mid can sit a few dollars off the last trade while the bar forms. The pane sits below the chart and the card at the top left of the price pane, under the legend (safe_area: true), where it covers the oldest candles on screen instead of the newest.
When data is missing
On a market without an order book (gold and the other FX_OTC pairs, stocks, a prediction market when the lane serves none) no bar ever carries both sides, so the card's headline prints the short sentence No order book, whole at the headline's 20 px, in slate through the side ladder; the Biggest wall and Spread rows print a dash (their slots are never written) and the pane is not drawn (the frame is never written). When the live bar carries no usable snapshot (none delivered, a side missing, or a crossed book) the curve and the card read the newest bar that had one and the pane's caption says how many bars ago that was ("Last snapshot, 3 bars ago"). Bars before the first usable snapshot write NaN to every data output. When a side has nothing resting within near_pct the ratio is NaN: the chip reads "Thin near the mid" and the headline "Nothing resting within the band", both in slate; when no level sits within range_pct the Biggest wall row prints a dash.
Customize it
- Reach.
range_pct(2, from 0.5 to 10 in steps of 0.5) sets how far from the mid the curve reaches, percent each side; the pane's title follows it ("Depth within 2% of the mid") and the walls are searched within the same reach. - The band.
near_pct(1, from 0.1 to 5 in steps of 0.1) is the band the ratio, the chip and the card's headline read; the card's title prints it ("Order book within 1%"). - A wider lean.
LEAN(1.05) is the ratio either side of 1 before a side is named; raise it in the source and more books read as "Balanced book". - Other inks. The bid and ask colours are literals on the two series (teal
#2dd4bf, orange#f86800), repeated on the wall callouts, the chip and the headline ladder: a panel series takes a literal, not aparam.color, so change them in the source and Run again. - Change the look. The card is made in
phosphor; the Look row on the indicator's Style page switches it to glass, this example's other look, or any other shipped look without code (The Style page).
Run it
- In the editor's Explorer, press the Templates icon ("Browse starter templates") and pick Depth Curve under Beyond the time axis.
- Press Run on a chart with an order book, such as BTCUSDT on Binance Futures at 15m: the depth curve fills the pane under the chart with the chip on its title row, and the phosphor card appears at the top left of the price pane, under the legend.
- At the editor's Console prompt, type
last 20 ratioto read bid dollars over ask dollars within the band on the last 20 bars.
Concepts used
- Order flow for
book.cells, its[price, size, side]tuple,max_cellsand thein_book_cells()/in_book_view()loop - Data sources for the
booksource and the empty block a market without a book answers - Cards, frames and panels for frames and the
fb_*builders,panel.lineon a number axis, step series and fills, markers, callouts withvalign: "point"andy, thebadgechip and thecaption - HUD cards for
render.hud, its anchors,safe_areaandwidth - Looks for
look: "phosphor",glassand what each draws - Blocks and tiles for the headline
tile.pillandtile.rows - The Style page for the Look row that switches the look without code
- Strings and text for the
sb_*builders and string slots