Volume heat hours
Every clock hour boxed over its high and low, tinted by that hour's volume against the average of the last day's completed hours: quiet hours are nearly invisible slate, busy hours turn amber and get darker, and an hour past the hot multiple gets an amber border and a tag such as "2.3x" above it (whole numbers from 10x up).
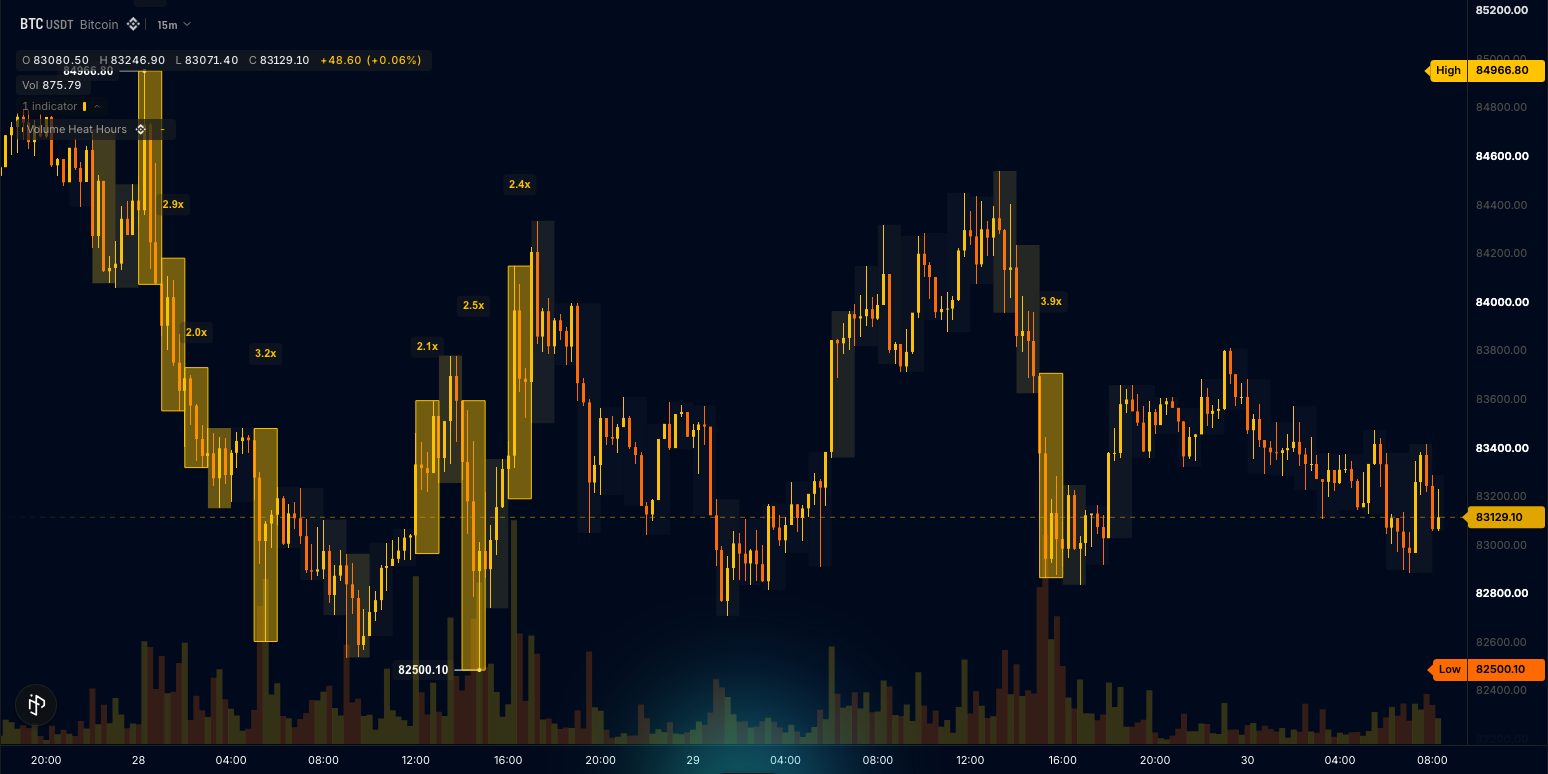
The live hour fills in as its bars arrive.
The parts are one box handle per clock hour and a label handle for the tag (Drawing objects), the bar's open time, bar.time(), for the hour boundary (Time and sessions), and a rolling average of completed hours kept in module-level state. Hours are folded from the chart's own bars, so no pinned leg is needed and the example runs on stocks too. This is also the volume-heat-hours template: the Volume Heat Hours card under On price in the editor's starter list, and it compiles as written.
The wrun indicator
// Volume Heat Hours: every clock hour boxed over its range and tinted by its volume against the average of the last day's hours,
// from near-invisible slate (quiet) to amber (hot); hot hours get a border and a "2.3x" tag. Hours are folded from the chart's own bars.

param.int("baseline_hours", 24, { min: 6, max: 168, label: "Baseline in hours", description: "Completed hours the average volume is taken over" });
param.number("hot_multiple", 2.0, { min: 1.2, max: 5, step: 0.1, label: "Hot multiple", description: "An hour at this multiple of the average is hot: it gets a border and a tag" });
param.int("hours_kept", 60, { min: 6, max: 60, label: "Hours kept", description: "Hours kept on the chart; the oldest box is reused" });
legend({ title: "({{baseline_hours}}h)" }); // the words after the name in the legend: the baseline, read by name
input("high", ohlcv.high); // the hour's box spans its high and low
output("hour_ratio", none, overlay, { description: "This hour's volume so far against the average completed hour" }); // data-only, so the Console can read it
string("tag", { max_bytes: 48 }); // one bounded slot every tag is written through
handles.box({ opacity: 0.04, borderWidth: 0 }); // boxes in chart time and price: one per hour, quiet by default
handles.label({ size: 11 }); // the "2.3x" tags (centred over their box) and the one line of words when the example cannot run

const MAX_HOURS = 60; // the ring's ceiling: 60 boxes and 60 tag ids (only hot hours draw theirs)
const MAX_BASE = 168; // the baseline ring's ceiling: a week of hours
const AMBER: i32 = rgba(248, 192, 0, 255);
const SLATE: i32 = rgba(148, 163, 184, 255);
function makeBoxes(first: i32, count: i32): BoxHandle[] { const out: BoxHandle[] = []; for (let i = 0; i < count; i += 1) out.push(draw.box(first + i)); return out; }
function makeLabels(first: i32, count: i32): LabelHandle[] { const out: LabelHandle[] = []; for (let i = 0; i < count; i += 1) out.push(draw.label(first + i)); return out; }
const boxes = makeBoxes(0, MAX_HOURS); // handle objects allocate once, at module load
const tags = makeLabels(MAX_HOURS, MAX_HOURS); // tag i belongs to box i, so a recycled hour never leaves a stale tag behind
const words = draw.label(200); // the one line of words
const hourVolumes = new StaticArray<f64>(MAX_BASE); // completed hours' volumes, the baseline ring

let baselineHours = 24; let hot = 2.0; let hoursKept = 60;
let baseHead = 0; let baseCount = 0; let baseSum = 0.0; // the baseline ring's cursor, fill and running sum
let t: f64 = NaN; let prevT: f64 = NaN; let width: f64 = NaN; // width = the smallest gap between bar opens seen
let hourKey: f64 = NaN; let hourSlot = 0; let hours = 0; // the hour being drawn, its ring slot, hours seen
let hStart: f64 = NaN; let hEnd: f64 = NaN; let hHi: f64 = NaN; let hLo: f64 = NaN; let hVol = 0.0; // the open hour
let bars = 0; let sawVolume = false; let wordsShown = false;
let wordsText = ""; // the line of words to show

function showWords(): void { sb_clear(); sb_text(wordsText); words.set(56, 14).text(str_tag_sb).anchor(ANCHOR_TOP_RIGHT).align(ALIGN_RIGHT).color(SLATE); wordsShown = true; }

// onStart() runs once before the first bar: read the settings.
function onStart(): void {
  baselineHours = i32(p_baseline_hours()); if (baselineHours < 1) baselineHours = 1; if (baselineHours > MAX_BASE) baselineHours = MAX_BASE;
  hot = p_hot_multiple(); if (hot < 1.01) hot = 1.01;
  hoursKept = i32(p_hours_kept()); if (hoursKept < 1) hoursKept = 1; if (hoursKept > MAX_HOURS) hoursKept = MAX_HOURS;
}
// onBar() runs once per bar: fold the bar into its hour (when a new hour opens, the finished one joins the baseline), write the output,
// then paint this hour's box from its ratio; a hot hour gets a border and a tag.
function onBar(): void {
  prevT = t; t = bar.time(); const high = bar.high(); const low = bar.low(); const volume = bar.volume();
  if (!isNaN(prevT) && t > prevT && (isNaN(width) || t - prevT < width)) width = t - prevT;
  bars += 1;
  if (isNaN(width)) return; // the first bar has no width yet
  const coarse = width >= 3600.0; // an hourly or coarser chart: an hour is one bar, the boxes would say nothing new
  if (coarse) { if (!wordsShown) { wordsText = "Volume Heat Hours needs a chart finer than 1h"; showWords(); } return; }
  const key = Math.floor(t / 3600.0);
  let fresh = false;
  if (key != hourKey) {
    if (!isNaN(hourKey)) { // the finished hour joins the baseline ring (its oldest entry drops out of the sum)
      baseSum += hVol - unchecked(hourVolumes[baseHead]); hourVolumes[baseHead] = hVol;
      baseHead = (baseHead + 1) % baselineHours; if (baseCount < baselineHours) baseCount += 1;
    }
    hourKey = key; hourSlot = hours % hoursKept; hours += 1;
    hStart = t; hHi = high; hLo = low; hVol = 0.0; fresh = true;
  } else {
    if (high > hHi) hHi = high;
    if (low < hLo) hLo = low;
  }
  if (!isNaN(volume) && volume > 0.0) { hVol += volume; sawVolume = true; }
  hEnd = t + width;
  const average = baseCount >= 3 ? baseSum / f64(baseCount) : NaN; // three completed hours before the first tint
  const ratio = average > 0.0 ? hVol / average : NaN;
  out_hour_ratio(ratio);
  if (!sawVolume) { if (bar.isLast() && bars >= 8 && !wordsShown) { wordsText = "No volume on this market"; showWords(); } return; }
  if (wordsShown) { words.delete(); wordsShown = false; } // volume arrived after all
  if (fresh) tags[hourSlot].delete(); // a recycled slot starts without the old hour's tag
  if (isNaN(ratio)) return; // no baseline yet: nothing drawn for this hour
  let u = (ratio - 0.75) / (hot - 0.75); if (u < 0.0) u = 0.0; if (u > 1.0) u = 1.0; // 0 at three quarters of the average and below, 1 at the hot multiple
  const r = i32(148.0 + (248.0 - 148.0) * u); const g = i32(163.0 + (192.0 - 163.0) * u); const b = i32(184.0 - 184.0 * u); // slate to amber
  const isHot = ratio >= hot;
  boxes[hourSlot].set(hStart, hHi, hEnd, hLo).fill(rgba(r, g, b, 255)).opacity(0.04 + 0.41 * u * u).color(AMBER).border(isHot ? 1.0 : 0.0); // alpha 0.04 to 0.45, rising with the square so average hours stay faint
  if (isHot) { // the tag sits over the box and re-reads its multiple while the hour is still filling
    sb_clear(); sb_f64(ratio, ratio >= 10.0 ? 0 : 1); sb_text("x"); // "2.3x", "220x"
    tags[hourSlot].set((hStart + hEnd) * 0.5, hHi + (hHi - hLo) * 0.35).text(str_tag_sb).color(AMBER).size(11);
  }
}
How it works
An hour is folded from the bars. bar.time() gives each bar's open; a new hour starts when the bar's hour of day changes. The hour's box spans its high and low (bar.high(), bar.low()) and its volume is the sum of its bars' bar.volume(). On the live bar the open hour's box is moved with set() so it fills in as the bars arrive.
The baseline is the completed hours. baseline_hours (24, 6 to 168) completed hours feed the average; the ratio of this hour's volume so far against that average is hour_ratio, a data-only output the editor's Console prompt reads after a Run. The first three completed hours are the warm-up, so nothing is tinted before them.
Tint by ratio, border past the multiple. The box's fill opacity follows the ratio: nearly invisible slate for a quiet hour, amber that darkens as the ratio climbs. An hour at or past hot_multiple (2.0) gets an amber border and a tag ("2.3x", whole numbers from 10x up) written through the one bounded slot with the allocation-free builder (sb_clear, sb_f64, sb_text, str_tag_sb).
A ring of hours. hours_kept (60, the ceiling the handle ring allows) boxes stay on the chart; the oldest is reused. The handle objects are made once, at module start.
Where it runs
Every market with volume, on charts finer than 1h.
When data is missing
On an hourly or coarser chart it draws one slate line of words at the top-right ("Volume Heat Hours needs a chart finer than 1h"). A market without volume (gold on the FX venue) gets "No volume on this market" and nothing else.
Customize it
- A longer baseline.
baseline_hoursup to 168 (a week of hours) smooths the average over the weekly cycle. - Stricter tags. Raise
hot_multipleto tag only the busiest hours; the tint still grades every hour. - Session hours only. Gate the fold on the hour of day (the Session map recipe's window test) to box the cash session alone.
Run it
- In the editor's Explorer, press the Templates icon ("Browse starter templates") and pick Volume Heat Hours under On price.
- Press Run on a chart finer than 1h, such as 5m or 15m.
- At the editor's Console prompt, type
last 24 hour_ratioto read, for each of the last 24 bars, its hour's volume so far against the average completed hour.
Concepts used
- Drawing objects for box and label handles and ids reused by slot
- Time and sessions for
bar.time()and the hour boundary - Execution model for module-level state and where
onStart()andonBar()run