ETF flows
The daily net flow of the chart coin's spot ETFs as one wide bar per day in a pane under the chart, amber for an inflow day and orange for an outflow day, in dollars (the legend and the axis print $29.0M), with a zero line between them that stays out of the legend; the flow summed since the start of the loaded window as a line in a strip along the bottom of the price pane (its own scale, so the day bars keep theirs); and a faint wash behind each day's candles in the day's colour, so the flow reads against price. A day whose flow is a multiple of the window's mean day is tagged with its size ("+$1.20B"). A card at the top right reads the latest day (value and date), the window's sum over its days, the current streak ("4 days of inflow") and the biggest day of the window; a date names its month ("Oct 2") and carries its year when it is not this year ("Oct 6, 2025").
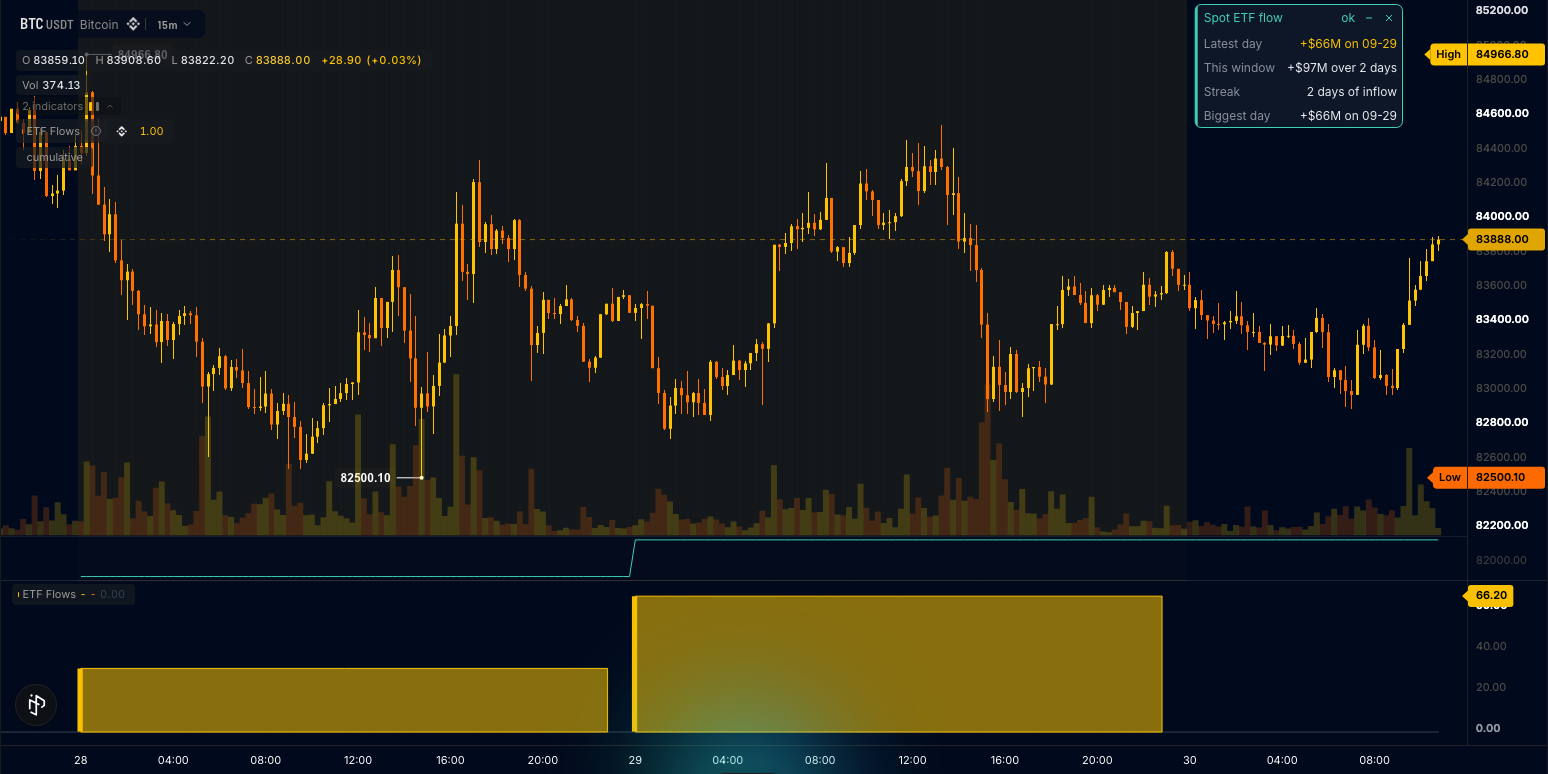
The parts are an etf_flow.flow_usd input landing once per day with missing: "nan" (Data sources), lower-pane box handles for the day bars and label handles for the tags (Drawing objects), an out.inset strip along the bottom of the price pane, a render.bgcolor wash (Styling) and a draw.card with text slots (Cards, frames and panels). This is also the etf-flows template: the ETF Flows card under Beyond the time axis in the editor's starter list, and it compiles as written.
The wrun indicator
// ETF Flows: the daily net flow of the chart coin's spot ETFs, in millions of USD, as one wide bar per day in a pane
// under the chart (amber inflow, orange outflow), the flow summed since the start of the loaded window as a line in a
// strip along the bottom of the price pane, and a faint tint behind each day's candles in the day's colour, so the
// flow reads against price. A day whose flow
// dwarfs the window's norm is tagged with its size. A card at the top right reads the latest day, the window's sum,
// the current streak and the biggest day. The flow is daily: on an intraday chart it lands on the first bar of its
// day, so the pane draws the day once (a box across the day) instead of a bar per 15m; on daily and coarser charts
// each bar is its own day and the histogram carries it. Weekends and holidays have no flow and draw nothing.

param.number("big_day", 2.0, { min: 1.0, max: 10.0, step: 0.1, label: "Big day multiple", description: "A day is tagged with its size when its flow is this many times the window's mean day" });
input("close", ohlcv.close); // the chart's own close: the grid
input("flow", etf_flow.flow_usd, { fund: "all", missing: "nan", description: "Daily net spot-ETF flow in USD, summed over every fund listed for the chart's coin; change fund to one ticker (IBIT, ETHA, ...) to follow it alone" }); // lands on the first bar of its day, NaN elsewhere
output("flow_sign", none, overlay, { description: "+1 on an inflow day, -1 on an outflow day, NaN on a day without a flow; the tint's gate" }); // first output on price: the package homes on the chart
output("flow_tone", none, overlay, { description: "1 on an inflow day, 0 on an outflow day: the tint's colour index" });
output("latest_tone", none, overlay, { description: "1 while the latest day is an inflow, 0 while an outflow: the card's colour index" });
output("day_flow", none, overlay, { description: "The day's net flow in millions of USD, carried through the day" });
output("inflow", histogram, lower, { color: "#f8c000", label: "Inflow", format: "usd", description: "Inflow days, USD, on the bar the day lands on" }); // usd prints the legend and the axis as $29.0M
output("outflow", histogram, lower, { color: "#f86800", label: "Outflow", format: "usd", description: "Outflow days, USD, on the bar the day lands on" });
output("zero", line, lower, { color: "#334155", width: 1, legend: false, description: "The pane's zero line: inflow above it, outflow below; it keeps zero inside the pane's scale" }); // a scale helper: kept out of the legend
out.inset("cumulative", { dock: "bottom", height_px: 44, shape: "line" }); // net flow summed since the start of the loaded window, millions of USD: a strip along the bottom of the price pane with its own scale, so the day bars keep theirs
string("latest", { max_bytes: 24 }); // the card's cells, one slot each, written on the live bar
string("window", { max_bytes: 24 });
string("streak", { max_bytes: 24 });
string("biggest", { max_bytes: 24 });
string("text", { max_bytes: 24 }); // the big-day tags
string("note", { max_bytes: 80 }); // the one sentence while no flow day is in view
render.bgcolor("flow_days", { where: "flow_sign", color_by: "flow_tone", colors: ["#f8680014", "#f8c00014"] }); // a faint wash behind each day's candles, alpha 0.08
handles.box({ panel: "lower", opacity: 0.55, borderWidth: 1 }); // one box per day in the pane: x in seconds, y in USD
handles.label({ panel: "lower", size: 11, color: "#e2e8f0", align: "center" }); // the big-day tags, centred over the day
draw.card("flow_card", {
  title: "Spot ETF flow",
  anchor: "top_right",
  offset: [56, 0], // inward past the price-axis tags
  rows: [
    { label: "Latest day", value: { text: "latest" }, color: { color_by: "latest_tone", colors: ["#f86800", "#f8c000"] } },
    { label: "This window", value: { text: "window" } },
    { label: "Streak", value: { text: "streak" } },
    { label: "Biggest day", value: { text: "biggest" } },
  ],
});
render.label("note_label", { position: "top_center", text: "note", color: "#94a3b8", style: "knockout", offset: [0, 8] }); // the sentence: top centre, clear of the card

const DAY = 86400.0;
const MAX_BOXES = 60; // day boxes ride a ring: the oldest is recycled
const MAX_TAGS = 20;
const AMBER = rgba(248, 192, 0, 255);
const ORANGE = rgba(248, 104, 0, 255);
const boxes: BoxHandle[] = [];
for (let i = 0; i < MAX_BOXES; i += 1) boxes.push(draw.box(i));
const tags: LabelHandle[] = []; // ids are one space across kinds
for (let i = 0; i < MAX_TAGS; i += 1) tags.push(draw.label(100 + i));

let bigDay = 2.0; // setting, read in onStart()
let prevT: f64 = NaN; // the previous bar's open time
let barSec: f64 = NaN; // the grid spacing, the smallest gap seen between bars
let dayIndex: i64 = -1; // the current day (days since the epoch) and what it carries
let dayFlowM: f64 = NaN; // the day's flow in millions, NaN until it lands
let dayStart: f64 = NaN;
let pendingStart: f64 = NaN; // a day that landed before the grid spacing was known: its box is drawn one bar later
let pendingFlowM: f64 = NaN;
let cumulativeM = 0.0; // since the first landed day of the window
let days = 0; // landed days in the window
let sumAbsM = 0.0; // for the big-day norm
let boxesDrawn = 0;
let tagsDrawn = 0;
let streak = 0; // consecutive landed days with the latest day's sign
let latestM: f64 = NaN;
let latestDay: i64 = -1;
let biggestM: f64 = NaN;
let biggestDay: i64 = -1;

const MONTHS: StaticArray<string> = ["Jan", "Feb", "Mar", "Apr", "May", "Jun", "Jul", "Aug", "Sep", "Oct", "Nov", "Dec"];
let civilYear: i64 = 0;
let civilMonth = 0;
let civilDay = 0;
function civilFromDays(daysSinceEpoch: i64): void { // days since 1970-01-01 -> year, month and day of month (proleptic Gregorian)
  const z = daysSinceEpoch + 719468;
  const era = (z >= 0 ? z : z - 146096) / 146097;
  const doe = z - era * 146097;
  const yoe = (doe - doe / 1460 + doe / 36524 - doe / 146096) / 365;
  const doy = doe - (365 * yoe + yoe / 4 - yoe / 100);
  const mp = (5 * doy + 2) / 153;
  civilDay = i32(doy - (153 * mp + 2) / 5 + 1);
  civilMonth = i32(mp < 10 ? mp + 3 : mp - 9);
  civilYear = yoe + era * 400 + (civilMonth <= 2 ? 1 : 0);
}
function sbDate(day: i64, today: i64): void { // "Sep 29", with the year when it is not this bar's year: "Oct 6, 2025"
  civilFromDays(today);
  const thisYear = civilYear;
  civilFromDays(day);
  sb_text(MONTHS[civilMonth - 1]);
  sb_text(" ");
  sb_int(civilDay);
  if (civilYear != thisYear) {
    sb_text(", ");
    sb_int(civilYear);
  }
}
function sbMoneyM(m: f64): void { // millions in: "+$351M", "-$1.20B", "+$5.1K"
  sb_text(m < 0.0 ? "-$" : "+$");
  const v = Math.abs(m);
  if (v >= 1000.0) {
    sb_f64(v / 1000.0, 2);
    sb_text("B");
  } else if (v >= 1.0) {
    sb_f64(v, 0);
    sb_text("M");
  } else {
    sb_f64(v * 1000.0, 0);
    sb_text("K");
  }
}

// A day's box in the pane: from the day's first second to its last (a 5% gap keeps neighbouring days apart), 0 to the flow.
function drawDayBox(start: f64, flowM: f64): void {
  const k = boxesDrawn % MAX_BOXES;
  boxesDrawn += 1;
  const ink = flowM >= 0.0 ? AMBER : ORANGE;
  boxes[k].set(start, flowM * 1.0e6, start + DAY * 0.95, 0.0).fill(ink).color(ink).opacity(0.55).border(1.0);
}
// A tag over (or under) the day's bar when the day dwarfs the window's mean day.
function tagBigDay(start: f64, flowM: f64): void {
  const k = tagsDrawn % MAX_TAGS;
  tagsDrawn += 1;
  sb_clear();
  sbMoneyM(flowM);
  tags[k].set(start + DAY * 0.475, flowM * 1.0e6).text(str_text_sb).color(flowM >= 0.0 ? AMBER : ORANGE);
}

function onStart(): void {
  bigDay = p_big_day();
}

// onBar() runs once per bar: the grid spacing, the day the bar belongs to, and the day's flow when it lands; then the day's
// numbers on every bar, the histogram on the landing bar, the box when the chart is finer than a day, the tag on a big day,
// the card on the live bar only.
function onBar(): void {
  const close = bar.close();
  const t = bar.time();
  if (!isNaN(prevT) && t > prevT && (isNaN(barSec) || t - prevT < barSec)) barSec = t - prevT;
  prevT = t;
  const day = i64(Math.floor(t / DAY));
  if (day != dayIndex) {
    dayIndex = day;
    dayStart = f64(day) * DAY;
    dayFlowM = NaN;
  }
  let landedNow = false; // this bar carried the day's value
  const flow = in_flow();
  if (!isNaN(flow) && flow != 0.0 && isNaN(dayFlowM)) { // the day's value, once; a reported zero (a day the funds did not trade) counts as no flow
    dayFlowM = flow / 1.0e6;
    landedNow = true;
    cumulativeM += dayFlowM;
    days += 1;
    sumAbsM += Math.abs(dayFlowM);
    if (!isNaN(latestM) && (latestM >= 0.0) == (dayFlowM >= 0.0)) streak += 1;
    else streak = 1;
    latestM = dayFlowM;
    latestDay = day;
    if (isNaN(biggestM) || Math.abs(dayFlowM) > Math.abs(biggestM)) {
      biggestM = dayFlowM;
      biggestDay = day;
    }
  }
  if (isNaN(close)) return;
  const hasDay = !isNaN(dayFlowM);
  out_flow_sign(hasDay ? (dayFlowM >= 0.0 ? 1.0 : -1.0) : NaN);
  out_flow_tone(hasDay ? (dayFlowM >= 0.0 ? 1.0 : 0.0) : NaN);
  out_latest_tone(isNaN(latestM) ? NaN : latestM >= 0.0 ? 1.0 : 0.0);
  out_day_flow(dayFlowM);
  out_inflow(landedNow && dayFlowM >= 0.0 ? dayFlowM * 1.0e6 : NaN); // the pane is in USD: the histogram, the boxes and the tags
  out_outflow(landedNow && dayFlowM < 0.0 ? dayFlowM * 1.0e6 : NaN);
  out_zero(0.0);
  out_cumulative(days > 0 ? cumulativeM : NaN);
  const intraday = !isNaN(barSec) && barSec < DAY;
  if (!isNaN(pendingStart) && !isNaN(barSec)) { // the first bar's day, drawn now that the spacing is known
    if (intraday) drawDayBox(pendingStart, pendingFlowM);
    pendingStart = NaN;
  }
  if (landedNow) {
    if (isNaN(barSec)) {
      pendingStart = dayStart;
      pendingFlowM = dayFlowM;
    } else if (intraday) drawDayBox(dayStart, dayFlowM);
    if (days >= 3 && Math.abs(dayFlowM) >= bigDay * (sumAbsM / f64(days))) tagBigDay(dayStart, dayFlowM); // a norm needs a few days
  }
  if (bar.isLast()) str_note(days > 0 ? "" : "No ETF flow day in view: open the 1h chart or pan back a few days"); // an empty text draws no label
  if (bar.isLast() && days > 0) {
    sb_clear();
    sbMoneyM(latestM);
    sb_text(" on ");
    sbDate(latestDay, day);
    str_latest_sb();
    sb_clear();
    sbMoneyM(cumulativeM);
    sb_text(" over ");
    sb_int(days);
    sb_text(days == 1 ? " day" : " days");
    str_window_sb();
    sb_clear();
    sb_int(streak);
    sb_text(streak == 1 ? " day of " : " days of ");
    sb_text(latestM >= 0.0 ? "inflow" : "outflow");
    str_streak_sb();
    sb_clear();
    sbMoneyM(biggestM);
    sb_text(" on ");
    sbDate(biggestDay, day);
    str_biggest_sb();
  }
}
How it works
A daily series on an intraday chart. input("flow", etf_flow.flow_usd, { fund: "all", missing: "nan" }) sums every fund listed for the chart's coin (11 for BTC, 10 for ETH, 7 for SOL); change fund to one ticker (IBIT, FBTC, ETHA, ...) to follow that fund alone, and the lane names the coin's tickers when one does not match. The day's value arrives on the first bar of its day and nothing else that day, so the pane draws the day once: a box handle from the day's first second to its last, with a thin histogram bar (inflow or outflow) on the landing bar that keeps the pane's scale honest, and the zero line between them. The pane is in dollars: format: "usd" on the two histograms prints the legend and the axis as $29.0M and -$149.0M, the boxes and tags sit at the same dollar heights, and legend: false keeps the zero line, a scale helper, out of the legend. On daily and coarser charts each bar is its own day and the histogram carries it (a weekly bar sums its days).
The flow reads against price. flow_sign (+1, -1 or NaN) gates and flow_tone (1 inflow, 0 outflow) colours render.bgcolor("flow_days", ...), the faint wash behind each day's candles; out.inset("cumulative", { dock: "bottom", height_px: 44, shape: "line" }) draws the flow summed since the start of the window in a strip along the bottom of the price pane with its own scale. day_flow carries the day's flow in millions through the day as a data-only output.
Tags and the card. A day whose flow is big_day (2.0) times the window's mean day (after three landed days) is tagged with its size through the text slot, centred over the day. The card's cells (the latest day and its date, the window's sum, the streak, the biggest day) are text slots written on the live bar, amber while the latest day is an inflow and orange while an outflow. sbDate() writes the month's short name and the day, and the year after a comma when the day falls in another year than the live bar's, so a biggest day a year back never reads as a date to come. Boxes ride a ring of 60 days; tags a ring of 20.
Where it runs
Charts of BTC, ETH and SOL on any venue (Binance Futures BTCUSDT, Binance spot ETHUSDT, ...). The flows arrive once a day, after the US session, and the chart polls for them while it is open. OpenMarket's alerts engine does not read ETF flows yet, so an alert on this indicator is refused when you save it (Alerts).
When data is missing
Other coins are refused by name before any fetch: "Input 'flow' (etf_flow) needs a chart of a coin with listed spot ETFs (BTC, ETH, SOL): this chart's coin is PURR". Gold refuses the same way. Weekends and holidays have no flow (the lane reports zero, which counts as no flow) and draw nothing; a window whose first day has no midnight bar starts on the next landed day; a day the lane has not reported yet (today, before the close) draws nothing and the card keeps the latest reported day. An intraday chart whose loaded window holds no flow day (a 1m chart on a Monday morning) reads one sentence at the top centre of the price pane, "No ETF flow day in view: open the 1h chart or pan back a few days", through a render.label over the note slot, written on the live bar and empty once a day lands.
Customize it
- One fund. Change
fund: "all"to a ticker (a declaration literal, not a setting) and Run again. A ticker the coin does not list is refused by name, and the message names the coin's funds. - More tags. Lower
big_day; a day is tagged once its flow passes the multiple of the window's mean day. - No wash. Delete the
render.bgcolorline to keep the pane, the strip and the card without the tint.
Run it
- In the editor's Explorer, press the Templates icon ("Browse starter templates") and pick ETF Flows under Beyond the time axis.
- Press Run on a BTC, ETH or SOL chart, such as BTCUSDT on Binance Futures at 1h: the day bars fill the pane, the strip runs along the bottom of the price pane, and the card appears at the top right.
- At the editor's Console prompt, type
last 5 day_flowto read the day's flow, in millions of USD, on the last five bars (inflowandoutflowcarry it in dollars).
Concepts used
- Data sources for the
etf_flowsource, thefundword andmissing: "nan" - Drawing objects for lower-pane box and label handles
- Styling for
render.bgcolorand Cards, frames and panels forout.inset,draw.cardand text slots