Who is trading
Who did the volume over the last window bars, by the size of each trade. Under the chart, a donut shares the window's dollar volume out over seven trade-size buckets, from under 1K to 10M and up, in a fixed ramp: slate for the three small sizes, then sky, violet and teal up to the whales.
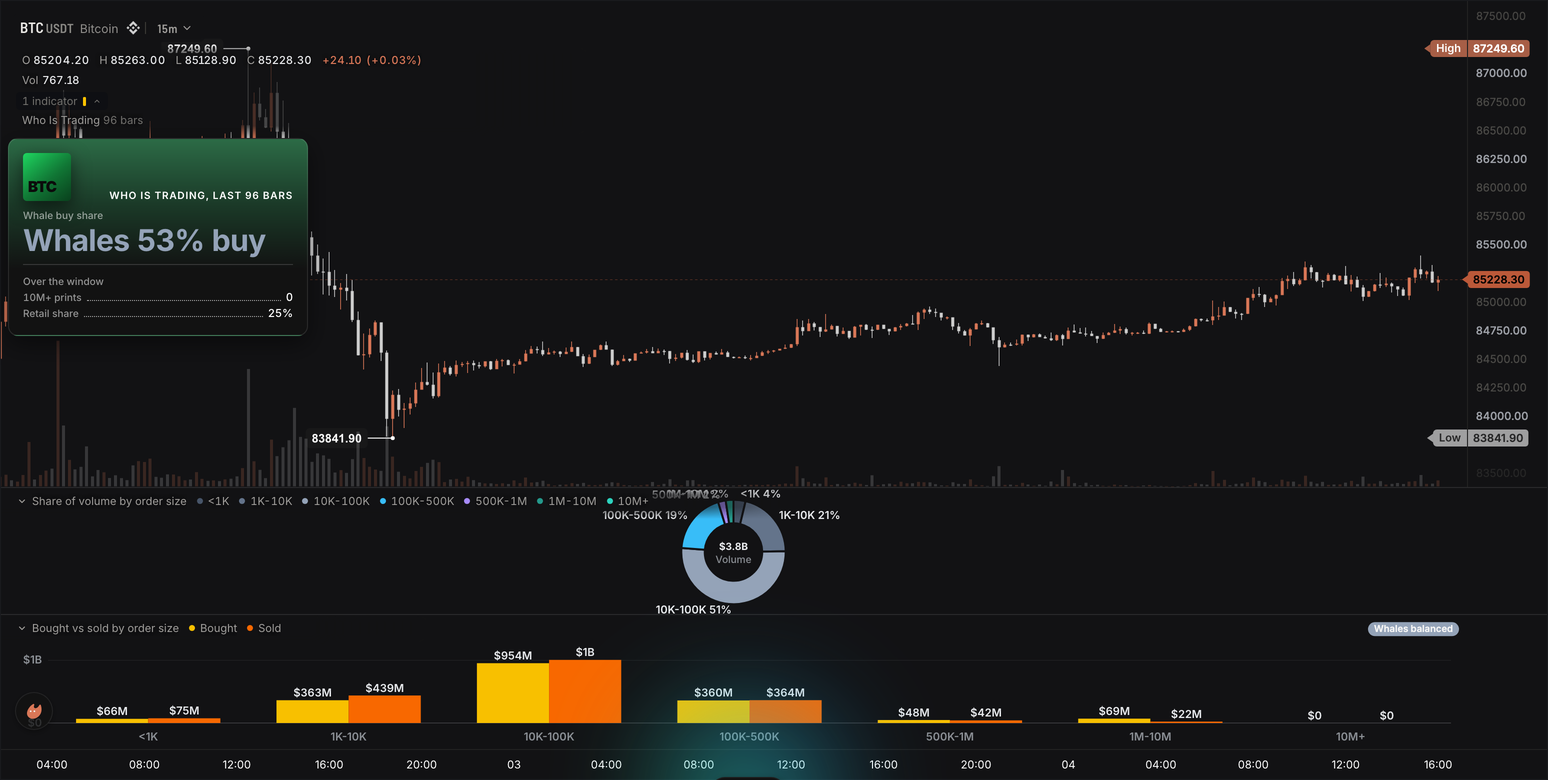
Every traded slice carries its name and its share ("10K-100K 51%"), the hole prints the window's total dollars, and a size that did not trade in the window has no slice. Under the donut, one pair of columns per size: bought dollars in amber, sold dollars in orange, each column printed in dollars (K, M, B) with the axis in dollars too, and a chip on the title row with the window's verdict: "Whales buying", "Whales selling", "Whales balanced" or "No whale prints". On the price pane, a card in the stage look (the chart's coin as a cover, a heavy headline, one green accent) at the top left under the legend: "Who is trading, last 96 bars" as the title (the window in bars), the whales' buy share as the headline ("Whales 62% buy": of every dollar whales traded, the part they bought; amber from the lean setting up, orange from its mirror down, slate between or when no whale traded), then two rows, "10M+ prints" (trades of 10M and up in the window, buys and sells together) and "Retail share" (the part of the window's dollars traded in trades under 10K, the sum of the donut's two smallest slices as printed). The legend reads the window after the name ("Who Is Trading 96 bars"). Everything is measured on the live bar over a rolling window; history bars only feed the window.
The parts are a trade_volume_by_size.cells input with max_cells: 7 (Data sources), two frames feeding a panel.pie donut and a panel.bars of vertical columns with a badge chip (Cards, frames and panels), a render.hud card of a headline tile.pill and a tile.rows in the stage look (HUD cards, Looks), and a handles.label handle for the one sentence a market with no size buckets gets (Drawing objects). This is also the whos-trading template: the Who Is Trading card under Beyond the time axis in the editor's starter list, and it compiles as written.
The wrun indicator
// Who Is Trading: who did the volume over the last 'window' bars, by the size of each trade. The trader sees a donut
// under the chart (the window's dollar volume shared out over seven trade-size buckets, from under 1K to 10M and up,
// a slate to teal ramp from small to whale, each slice labelled with its name and share), bars under it (bought in
// amber against sold in orange, one pair per bucket, a badge chip with the window's verdict), and a card
// on the price pane in the stage look: the whales' buy share as the headline ("Whales 62% buy", amber when they
// bought more than they sold, orange when they sold more), then the count of 10M+ prints and the retail share of the
// volume. Every bar feeds the rolling window; the panels and the card's numbers are measured on the live bar only.
// A trade here is one fill, bucketed by its own dollar value: an order that fills in pieces lands in smaller buckets, so
// the whale share and the 10M+ count are floors.

// Settings: the window in bars, and the buy share above which whales count as buying (below its mirror, selling).
param.int("window", 96, { min: 12, max: 1000, label: "Window in bars", description: "Bars in the rolling window (96 bars of 15m is one day)" });
param.number("lean", 55, { min: 50, max: 90, step: 1, label: "Whale lean in percent", description: "Whale buy share, percent, from which whales count as buying; below 100 minus it they count as selling" });
legend({ title: "{{window}} bars" }); // the words after the name in the legend: the window, read by name

// Inputs: the chart's own candles set the grid; the size buckets ride a celled block, one row per bucket that traded.
input("close", ohlcv.close);
input("sizes", trade_volume_by_size.cells, { max_cells: 7, description: "This bar's traded USD by trade-size bucket, each fill bucketed by its own value" }); // [bucket, buy_usd, sell_usd, buy_count, sell_count] per bucket that traded; seven buckets hold a full bar

// Outputs: data only, written on every bar, so the card's tiles, the Console and a watch read the same numbers.
output("whale_buy_share", none, overlay, { format: "0", description: "Whales' bought USD as a percent of what whales traded over the window (trades of 100K and up)" });
output("whale_share", none, overlay, { format: "0", description: "Whales' share of the window's USD volume, percent" });
output("retail_share", none, overlay, { format: "0", description: "Share of the window's USD volume in trades under 10K, percent" });
output("big_prints", none, overlay, { format: "int", description: "Prints of 10M and up over the window, buys and sells together" });
output("whale_tone", none, overlay, { description: "The verdict as a ladder rung: 0 whales selling, 1 balanced or no whale prints, 2 whales buying" });

// The card's words, written on the live bar.
string("headline", { max_bytes: 24 }); // "Whales 62% buy"
string("span_text", { max_bytes: 16 }); // "96 bars": the title's when
string("retail_text", { max_bytes: 8 }); // "18%": the sum of the two retail slices as the donut prints them
string("notice", { max_bytes: 40 }); // the one sentence when the market has no size buckets
handles.label({ anchor: "top_right", align: "right", color: "#94a3b8", size: 11 }); // the notice, in pane pixels from the top-right corner

// The panels under the chart: two frames, each one JSON snapshot rewritten on the live bar.
const share_rows = frame("share_rows", { max_bytes: 2048 }); // the donut: [bucket, usd, color] per bucket
const flow_rows = frame("flow_rows", { max_bytes: 2048 }); // the bars: [bucket, bought, sold] per bucket, plus the verdict badge
// The donut: the window's dollars by trade size, labels on every traded slice, the total in the hole, a hairline gap
// between slices in the chart's own background.
panel.pie({ name: "size_share", title: "Share of volume by trade size", x: "category", place: "below", frame: share_rows, hole: 0.55, labels: true, chrome: "none", legend_style: "title", hole_total: true, hole_caption: "Volume", slice_gap: 2, border_color: "theme.bg", border_width: 1, format: "usd", height_frac: 0.17 });
// The bars: bought against sold per bucket, one amber and one orange column under each bucket name, dollars on the
// axis and on every column, the window's verdict as the chip on the title row (written per run into the frame).
panel.bars({ name: "size_flow", title: "Bought vs sold by trade size", x: "category", place: "below", frame: flow_rows, orientation: "vertical", chrome: "grid", labels: true, series: [{ name: "Bought", color: "#f8c000" }, { name: "Sold", color: "#f86800" }], format: "usd", decimals: 0, hover_card: true, legend_style: "title", height_frac: 0.18 });

// The card, in the stage look (the chart's coin as a cover, a heavy headline, one green accent): one column at the
// top left under the legend. The whales' buy share leads as the headline, its colour following the verdict rung
// (selling, balanced, buying); two rows under it. The viewer switches the look on the Style page's Look row.
render.hud("who", { position: "top_left", look: "stage", title: "Who is trading, last {{span_text}}", columns: 1, width: 300, safe_area: true, tiles: [
  tile.pill("Whale buy share", "headline", { headline: true, font_size: 30, color_by: "whale_tone", colors: ["#f86800", "#94a3b8", "#f8c000"] }),
  tile.rows("Over the window", [["10M+ prints", "big_prints", "int"], ["Retail share", "retail_text"]], { leader: "dots" }),
] });

// The seven buckets, by the USD value of one trade: 1 under 1K, 2 1K to 10K, 3 10K to 100K, 4 100K to 500K,
// 5 500K to 1M, 6 1M to 10M, 7 10M and up. Whales are buckets 4 to 7; retail is buckets 1 and 2.
const BUCKETS = 7;
const FIRST_WHALE = 3; // bucket 4, as a 0-based slot
const LAST_RETAIL = 1; // bucket 2, as a 0-based slot
const BIGGEST = 6; // bucket 7, as a 0-based slot
const TUPLE = 5; // f64s per block row: bucket, buy_usd, sell_usd, buy_count, sell_count
const BUCKET_NAMES: String[] = ["<1K", "1K-10K", "10K-100K", "100K-500K", "500K-1M", "1M-10M", "10M+"];
const SLICE_COLORS: String[] = ["#475569", "#64748b", "#94a3b8", "#38bdf8", "#a78bfa", "#2dd4bfb3", "#2dd4bf"]; // slate ramp for the small trades, then sky, violet and teal up to the whales
const AMBER = "#f8c000"; // the flow pair: bought amber, sold orange; slate for no lean
const ORANGE = "#f86800";
const SLATE = "#94a3b8";
const SELLING = 0.0; // the verdict rungs, in the ladder's order
const BALANCED = 1.0;
const BUYING = 2.0;

// The rolling window rides rings sized for the largest window; onStart() reads the one in use.
const MAX_WINDOW = 1000;
const ringBuy = new StaticArray<f64>(MAX_WINDOW * BUCKETS); // each ring bar's bought USD per bucket
const ringSell = new StaticArray<f64>(MAX_WINDOW * BUCKETS); // and its sold USD
const ringBig = new StaticArray<f64>(MAX_WINDOW); // and its count of 10M+ prints
const winBuy = new StaticArray<f64>(BUCKETS); // the window totals per bucket: the new bar added, the bar leaving subtracted
const winSell = new StaticArray<f64>(BUCKETS);
let winBig = 0.0;

let window = 96;
let lean = 55.0;
let head = 0; // the ring slot the next bar takes
let total = 0.0; // the window's USD volume over every bucket
let whaleBuy = 0.0; // the whales' bought and sold USD
let whaleSell = 0.0;
let whaleBuyShare: f64 = NaN;
let tone = BALANCED;
const notice = draw.label(0); // handle objects allocate once, at module load

// Fold this bar's block into the rings and the window totals.
function foldBar(): void {
  const base = head * BUCKETS;
  for (let b = 0; b < BUCKETS; b += 1) {
    winBuy[b] -= ringBuy[base + b]; // the bar leaving the window
    winSell[b] -= ringSell[base + b];
    ringBuy[base + b] = 0.0;
    ringSell[base + b] = 0.0;
  }
  winBig -= ringBig[head];
  ringBig[head] = 0.0;
  const n = in_sizes_cells(); // -1 absent, 0 empty: either way this bar adds nothing
  if (n > 0) {
    const cells = in_sizes_view(); // this bar's rows in place
    for (let i = 0; i + TUPLE - 1 < n; i += TUPLE) {
      const b = i32(cells[i]) - 1;
      if (b < 0 || b >= BUCKETS) continue;
      const buy = cells[i + 1] > 0.0 ? cells[i + 1] : 0.0;
      const sell = cells[i + 2] > 0.0 ? cells[i + 2] : 0.0;
      ringBuy[base + b] += buy;
      ringSell[base + b] += sell;
      winBuy[b] += buy;
      winSell[b] += sell;
      if (b == BIGGEST) {
        const prints = (cells[i + 3] > 0.0 ? cells[i + 3] : 0.0) + (cells[i + 4] > 0.0 ? cells[i + 4] : 0.0);
        ringBig[head] += prints;
        winBig += prints;
      }
    }
  }
  head = (head + 1) % window;
}

// The window's readings. Running sums can drift a hair below zero once a bucket empties, so a negative reads as zero.
function measure(): void {
  total = 0.0;
  whaleBuy = 0.0;
  whaleSell = 0.0;
  for (let b = 0; b < BUCKETS; b += 1) {
    if (winBuy[b] < 0.0) winBuy[b] = 0.0;
    if (winSell[b] < 0.0) winSell[b] = 0.0;
    total += winBuy[b] + winSell[b];
    if (b >= FIRST_WHALE) {
      whaleBuy += winBuy[b];
      whaleSell += winSell[b];
    }
  }
  if (winBig < 0.5) winBig = 0.0;
  const whaleUsd = whaleBuy + whaleSell;
  whaleBuyShare = whaleUsd > 0.0 ? (100.0 * whaleBuy) / whaleUsd : NaN;
  tone = isNaN(whaleBuyShare) ? BALANCED : whaleBuyShare >= lean ? BUYING : whaleBuyShare <= 100.0 - lean ? SELLING : BALANCED;
}

// A bucket's share of the window's volume as the donut prints it: a whole percent.
function printedShare(b: i32): i32 {
  return i32(Math.round((100.0 * (winBuy[b] + winSell[b])) / total));
}

// The two frames, built in the kit's frame buffer without allocating: the donut's slices and the bars' rows with
// the verdict chip.
function writeFrames(): void {
  fb_clear();
  fb_text("{\"rows\":[");
  for (let b = 0; b < BUCKETS; b += 1) {
    if (b > 0) fb_text(",");
    fb_text("[");
    fb_str(BUCKET_NAMES[b]);
    fb_text(",");
    fb_f64(winBuy[b] + winSell[b], 0);
    fb_text(",");
    fb_str(SLICE_COLORS[b]);
    fb_text("]");
  }
  fb_text("]}");
  writeFrameBuffer(share_rows);
  fb_clear();
  fb_text("{\"badge\":{\"text\":");
  fb_str(isNaN(whaleBuyShare) ? "No whale prints" : tone == BUYING ? "Whales buying" : tone == SELLING ? "Whales selling" : "Whales balanced");
  fb_text(",\"color\":");
  fb_str(tone == BUYING ? AMBER : tone == SELLING ? ORANGE : SLATE);
  fb_text("},\"rows\":[");
  for (let b = 0; b < BUCKETS; b += 1) {
    if (b > 0) fb_text(",");
    fb_text("[");
    fb_str(BUCKET_NAMES[b]);
    fb_text(",");
    fb_f64(winBuy[b], 0);
    fb_text(",");
    fb_f64(winSell[b], 0);
    fb_text("]");
  }
  fb_text("]}");
  writeFrameBuffer(flow_rows);
}

// The card's words: the headline, the title's when, and the retail share as the sum of the two retail slices'
// printed shares, so the card and the donut never differ by a rounding point.
function writeWords(): void {
  sb_clear();
  if (isNaN(whaleBuyShare)) sb_text("No whale prints");
  else {
    sb_text("Whales ");
    sb_int(i64(Math.round(whaleBuyShare)));
    sb_text("% buy");
  }
  str_headline_sb();
  sb_clear();
  sb_int(window);
  sb_text(" bars");
  str_span_text_sb();
  sb_clear();
  sb_int(printedShare(0) + printedShare(LAST_RETAIL));
  sb_text("%");
  str_retail_text_sb();
}

// onStart() runs once before the first bar: the settings.
function onStart(): void {
  window = i32(p_window());
  lean = p_lean();
}

// onBar() runs once per bar: fold the bar into the window, write the readings as numbers; the frames and the card's
// words on the live bar only. A window with no size buckets at all writes the one sentence instead.
function onBar(): void {
  foldBar();
  measure();
  out_whale_buy_share(whaleBuyShare);
  out_whale_share(total > 0.0 ? (100.0 * (whaleBuy + whaleSell)) / total : NaN);
  out_retail_share(total > 0.0 ? (100.0 * (winBuy[0] + winSell[0] + winBuy[LAST_RETAIL] + winSell[LAST_RETAIL])) / total : NaN);
  out_big_prints(total > 0.0 ? winBig : NaN);
  out_whale_tone(tone);
  if (!bar.isLast()) return;
  if (total <= 0.0) {
    sb_clear();
    sb_text("No trade sizes on this market");
    notice.set(16, 44).text(str_notice_sb); // under the chart's own High tag, which takes the corner when the high is at the top edge
    return;
  }
  notice.delete(); // a no-op when the notice was never drawn
  writeFrames();
  writeWords();
}
How it works
Seven buckets are the input. input("sizes", trade_volume_by_size.cells, { max_cells: 7 }) serves this bar's traded dollars by the size of each trade, one [bucket, buy_usd, sell_usd, buy_count, sell_count] row per bucket that traded, bucket 1 (under 1K) to bucket 7 (10M and up); a bucket that did not trade has no row, and a bar with no trades is an empty block. in_sizes_cells() counts this bar's values (-1 absent, 0 empty) and in_sizes_view() holds them in place; foldBar() walks them five at a time. Whales are buckets 4 to 7 (FIRST_WHALE, 100K and up) and retail is buckets 1 and 2 (LAST_RETAIL, under 10K); bucket 3 counts toward the donut, the bars and the total, but toward neither share on the card.
A bucket counts fills, not orders. The lane buckets every fill, one matched trade at one price, by its own dollar value, so an order that takes liquidity from many resting orders arrives as many smaller fills: a 2M market buy that fills in forty pieces of 50K counts in the 10K-100K bucket, not the 1M-10M one. Read the whales' share and the 10M+ count as floors for what large traders did, and the retail share as a ceiling.
The window is a ring of running sums. foldBar() subtracts the bar leaving the window from the per-bucket totals winBuy and winSell, writes this bar's bought and sold dollars into its slot of ringBuy and ringSell (sized at load for MAX_WINDOW, 1000 bars by seven buckets) and adds them to the totals; ringBig and winBig do the same for the 10M+ prints (buy_count plus sell_count of bucket 7). measure() then sums the window: total over every bucket, whaleBuy and whaleSell over buckets 4 to 7; a running sum that drifts a hair below zero once a bucket empties reads as zero. onStart() reads window (96) and lean (55), and legend({ title: "{{window}} bars" }) reads the window by name, so the legend row prints "Who Is Trading 96 bars".
The verdict is a ladder. whaleBuyShare is the whales' bought dollars over what whales traded, NaN when no whale traded. The rung tone is BUYING (2) from lean up, SELLING (0) from 100 minus lean down, BALANCED (1) between or when no whale traded; whale_tone carries it as a data-only output, and the pill's colors ladder reads orange, slate and amber from it. whale_buy_share, whale_share and retail_share (percent) and big_prints (a count) are the other data-only outputs, written on every bar so the Console and a watch read the numbers the card shows.
Two frames are the panels. On the live bar, writeFrames() builds share_rows in the frame buffer with the fb_* writers, one [name, usd, color] row per bucket from BUCKET_NAMES and SLICE_COLORS, and panel.pie draws it as the donut: hole: 0.55 with hole_total and hole_caption: "Volume" print the window's dollars in the hole, labels: true names every traded slice with its share, legend_style: "title" puts a chip per bucket on the title row (an untraded bucket still names itself), slice_gap: 2 with border_color: "theme.bg" cuts a hairline gap in the chart's own background, and chrome: "none" drops the box. flow_rows carries one [name, bought, sold] row per bucket plus a badge with the verdict's words and colour, and panel.bars draws it as vertical columns, Bought in amber and Sold in orange, format: "usd" with decimals: 0 on the axis and on every column (labels: true), hover_card: true for a readout under the pointer. A badge written into the frame replaces the declared chip for that run, so the verdict rides the title row with no chip in the declaration.
The card reads slots and outputs. render.hud("who", { position: "top_left", look: "stage", title: "Who is trading, last {{span_text}}", columns: 1, width: 300, safe_area: true, ... }) is one column of 300 px that starts under the legend, its title reading the span_text slot ("96 bars"). tile.pill("Whale buy share", "headline", { headline: true, font_size: 30, color_by: "whale_tone", colors: [...] }) is the headline, its words from the headline slot ("Whales 62% buy", or "No whale prints"), its colour from the verdict rung; font_size: 30 is the stage look's own headline size, declared so a look with a larger one keeps the headline inside the card. tile.rows("Over the window", [["10M+ prints", "big_prints", "int"], ["Retail share", "retail_text"]], { leader: "dots" }) prints the count from the output and the retail share from a slot, with dotted leaders. writeWords() fills the three slots with the sb_* builders on the live bar; the retail text is the sum of the two retail slices' printed shares (printedShare, a whole percent each), so the card never disagrees with the donut by a rounding point, while the exact ratio stays the retail_share output.
The one sentence is a handle. handles.label({ anchor: "top_right", align: "right", color: "#94a3b8", size: 11 }) declares label handles placed in pane pixels from the top-right corner, and draw.label(0) makes the one handle at module load. On a live bar whose window holds no dollars at all, notice.set(16, 44).text(str_notice_sb) draws "No trade sizes on this market" under the chart's own High tag and the frames and the words are not written; on any other live bar notice.delete() removes it (a no-op when it was never drawn).
Where it runs
Crypto markets whose venue serves volume by trade size: Binance Futures perpetuals, Binance spot and Hyperliquid perpetuals (BTCUSDT on Binance Futures, ETHUSDT on Binance spot and PURR on Hyperliquid, at 15m and 1h). trade_volume_by_size is a required lane: on a market where the feed is declined (FX, CME, stocks) the run is refused by name before any bar, with a toast that begins "Trade volume by size data is unavailable" and ends "so the indicator cannot compute". The card sits at the top left of the price pane under the legend (safe_area), and the two panels take 0.17 and 0.18 of the chart's height under it.
When data is missing
When every bar in the window is an empty block (the feed answers but nothing traded by size), the panels are not drawn and one slate line at the top right of the price pane reads "No trade sizes on this market"; the card's tiles read a dash. Before the window is full the numbers cover the bars loaded so far. The window totals are running sums kept per bucket, so a size that stops trading leaves the donut as its bars leave the window, and a bucket that never traded keeps its legend chip with no slice; on a window with no prints of 10M and up the 10M+ columns print $0 and the card's row reads 0.
Customize it
- A longer window.
windowsets the bars in the rolling window (96, 12 to 1000); 96 bars of 15m is one day, and the card's title and the legend say the window in bars. - A stricter lean.
leanis the whale buy share, in percent, from which whales count as buying (55, 50 to 90); below 100 minus it they count as selling, between they are balanced. The headline's colour and the badge follow it. - Whales from 500K. Set
FIRST_WHALEto 4 (bucket 5 as a 0-based slot) to count whales from 500K and up, and reword thewhale_buy_shareandwhale_sharedescriptions to match. - Bars on their side.
orientation: "horizontal"onpanel.barslays the seven buckets down the left edge; at 0.18 of the chart the pane prints only every other bucket name, so give it about 0.24 withheight_fracand take the difference from the donut. - Change the look. The Look row on the indicator's Style page switches the card between the twelve looks without code (The Style page); this example was made in
stageand is also shown insignal, a black card with a hairline border and the headline as a capsule in the verdict's colour (Looks).lookon the declaration takes a look's name as a literal, never a setting, and a word declared beside it still wins.
Run it
- In the editor's Explorer, press the Templates icon ("Browse starter templates") and pick Who Is Trading under Beyond the time axis.
- Press Run on a crypto chart whose venue serves volume by trade size, such as BTCUSDT on Binance Futures at 15m: the donut and the bought-against-sold columns appear under the chart, the stage card at the top left of the price pane under the legend, and the legend row reads the window.
- At the editor's Console prompt, type
last 20 whale_buy_shareto read the whales' buy share of the window on the last 20 bars.
Concepts used
- Data sources for
trade_volume_by_size.cells, its seven buckets and thein_sizes_cells()andin_sizes_view()readers - Cards, frames and panels for frames, the
fb_*writers,panel.pie,panel.bars, their words and the framebadge - HUD cards for
render.hud, its anchors,widthandsafe_area - Looks for
look: "stage",signaland the other ten - Blocks and tiles for the headline
tile.pill,tile.rowsandleader: "dots" - The Style page for the Look row that switches the look without code
- Drawing objects for
handles.label,draw.label(id)and theset,textanddeletecalls - Strings and text for the
sb_*builders andstr_<slot>_sb()