CVD divergence
Cumulative volume delta (aggressive buys minus aggressive sells, summed bar after bar) in coins, in its own pane under the chart, with its own axis.
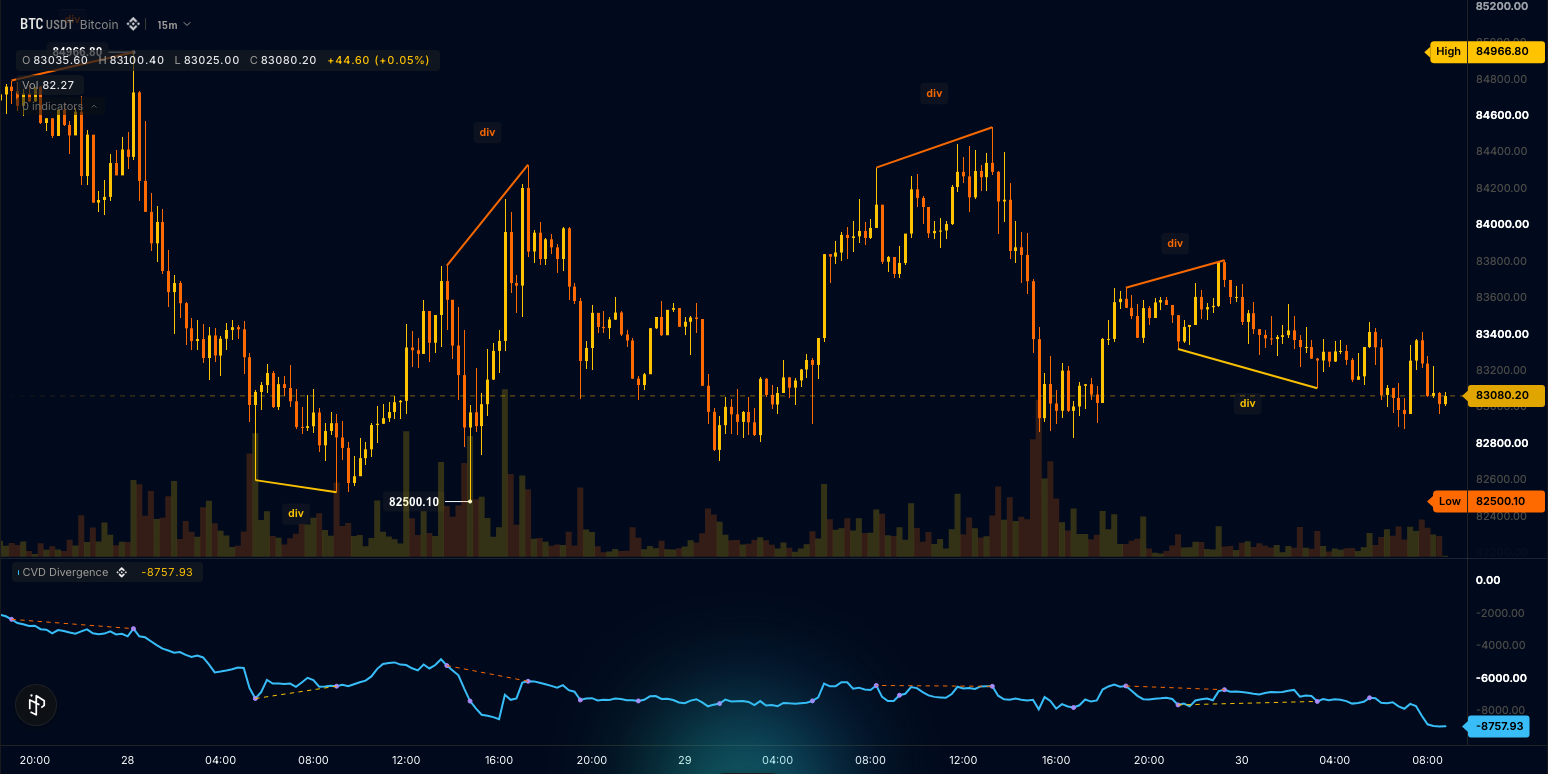
Every confirmed swing high and swing low of price is dotted on the CVD line in the pane. When price makes a higher high while CVD makes a lower high, or a lower low while CVD makes a higher low, the example draws the evidence: a line joining the two price swings on the chart (orange for the bearish case, amber for the bullish one), a dashed line joining the two CVD swings in the pane, and a small "div" tag beside the price line. Nothing is drawn on ordinary bars.
The parts are side-split trades.volume inputs (Data sources), a shape output displaced back to the swing bar, and three handle kinds: line handles on price, a polyline handle in the lower pane and label handles for the tags (Drawing objects). This is also the cvd-divergence template: the CVD Divergence card under Order flow in the editor's starter list, and it compiles as written.
The wrun indicator
// CVD Divergence: cumulative volume delta, in coins, in its own pane. When price makes a higher high while CVD makes
// a lower high (or a lower low while CVD makes a higher low), a line joins the two price swings on the chart, a dashed
// line joins the two CVD swings in the pane, every confirmed swing is dotted in the pane, and a small "div" tag names it.

param.int("swing", 8, { min: 3, max: 30, label: "Swing strength in bars", description: "Bars on each side a swing high or low must beat; a swing is confirmed this many bars later" });
param.bool("cvd_reset", false, { label: "Reset at midnight", description: "Restart CVD at every UTC midnight; off, it runs from the first loaded bar" }); // a toggle: pb_cvd_reset() reads it in onStart()
param.int("lines_kept", 12, { min: 1, max: 60, label: "Divergence lines kept", description: "Divergence lines kept on the chart; the oldest is recycled" });
legend({ title: "({{swing}})" }); // the words after the name in the legend: the swing strength, read by name
input("close", ohlcv.close); // the primary input: the chart's own candles define the grid every other input lines up on
input("buy", trades.volume, { side: "BUY", missing: "zero" }); // aggressive buy volume; a bar with no prints reads 0
input("sell", trades.volume, { side: "SELL", missing: "zero" }); // aggressive sell volume, the other half of the tape
output("cvd", line, lower, { color: "#38bdf8", width: 2, label: "CVD", format: "si", unit: " coins" }); // cumulative volume delta in the base asset (trades.volume reads coins), in its own pane under the chart
output("cvd_swing", shape, lower, { color: "#a78bfa", shape_where: "swing_here", displacement_bars: -8, displacement_bars_by: { param: "swing", scale: -1 }, label: "CVD swing", format: "si", unit: " coins" }); // a dot on the CVD at each confirmed swing, drawn back at the swing bar: `swing` bars before the bar that confirms it (-8 is the default strength's shift)
output("swing_here", none); // data-only: 1 on the bar that confirms a swing (the dot's gate)
output("divergence", none); // data-only: -1 bearish, +1 bullish, 0 none; read it in the Console or fire an alert(...) on it
string("text", { max_bytes: 40 }); // one bounded slot every label is written through
handles.line({ width: 2 }); // the price link between the two swings (chart time and price)
handles.polyline({ panel: "lower", width: 1, lineStyle: "dashed" }); // the CVD link between the two swings, in the pane
handles.label({ size: 11, color: "#e2e8f0" }); // the "div" tag on price, and the one line of words when the market has no sided trades

const RING = 64; // the swing window: 2 x 30 + 1 bars at the largest strength
const MAX_LINES = 60; // handles per kind at the largest setting
const highs = new StaticArray<f64>(RING); // the last RING bars, rings the swing test reads
const lows = new StaticArray<f64>(RING);
const cvds = new StaticArray<f64>(RING);
const times = new StaticArray<f64>(RING);
const points = new StaticArray<f64>(4); // x0, y0, x1, y1 for the pane link
const lines: LineHandle[] = []; // handle objects allocate once; ids are one space across kinds
const links: PolylineHandle[] = [];
const tags: LabelHandle[] = [];
for (let i = 0; i < MAX_LINES; i += 1) {
  lines.push(draw.line(i));
  links.push(draw.polyline(100 + i));
  tags.push(draw.label(200 + i));
}
const notice = draw.label(300);
const ORANGE = rgba(248, 104, 0, 255); // bearish: price up, CVD down
const AMBER = rgba(248, 192, 0, 255); // bullish: price down, CVD up
const SLATE = rgba(148, 163, 184, 255);

let swing = 8; // settings, read in onStart()
let resetDaily = false;
let linesKept = 12;
let barCount = 0; // bars seen
let cvd = 0.0; // the running delta
let sidedVolume = 0.0; // every sided print seen: 0 means the market has no sided trades
let prevDay = -1.0; // the UTC day of the previous bar, for the daily reset
let rangeAvg = NaN; // a running mean of high - low: the tag's distance from the line
let lastHighPrice = NaN; // the previous confirmed swing high and the CVD at it
let lastHighCvd = NaN;
let lastHighTime = NaN;
let lastLowPrice = NaN; // the previous confirmed swing low and the CVD at it
let lastLowCvd = NaN;
let lastLowTime = NaN;
let divergences = 0; // how many have been drawn: the ring position
let swingHere = 0.0; // this bar's results, set by testSwing()
let swingCvd = NaN;
let pendingKind = 0; // 0 none, -1 bearish, +1 bullish: a divergence to draw this bar
let x1 = NaN; // the two price swings and the CVD at each
let y1 = NaN;
let x2 = NaN;
let y2 = NaN;
let c1 = NaN;
let c2 = NaN;

// testSwing() tests the bar `swing` bars back for a swing, then the swing against the previous one of its kind for a divergence.
function testSwing(): void {
  swingHere = 0.0;
  swingCvd = NaN;
  pendingKind = 0;
  if (barCount < 2 * swing + 1) return; // not enough bars on both sides yet
  const center = barCount - 1 - swing; // the bar under test, `swing` bars back
  const c = center % RING;
  let isHigh = true;
  let isLow = true;
  for (let k = 1; k <= swing; k += 1) {
    const leftSlot = (center - k) % RING;
    const rightSlot = (center + k) % RING;
    if (!(highs[c] > highs[leftSlot]) || !(highs[c] >= highs[rightSlot])) isHigh = false; // above every bar before it, at or above every bar after it (a flat top counts once, on its first bar)
    if (!(lows[c] < lows[leftSlot]) || !(lows[c] <= lows[rightSlot])) isLow = false; // the mirror for a swing low
  }
  if (!isHigh && !isLow) return;
  swingHere = 1.0;
  swingCvd = cvds[c];
  if (isHigh) {
    if (!isNaN(lastHighPrice) && highs[c] > lastHighPrice && cvds[c] < lastHighCvd) { // higher high in price, lower high in CVD
      pendingKind = -1;
      x1 = lastHighTime;
      y1 = lastHighPrice;
      c1 = lastHighCvd;
      x2 = times[c];
      y2 = highs[c];
      c2 = cvds[c];
    }
    lastHighPrice = highs[c];
    lastHighCvd = cvds[c];
    lastHighTime = times[c];
  }
  if (isLow) {
    if (!isNaN(lastLowPrice) && lows[c] < lastLowPrice && cvds[c] > lastLowCvd) { // lower low in price, higher low in CVD
      pendingKind = 1;
      x1 = lastLowTime;
      y1 = lastLowPrice;
      c1 = lastLowCvd;
      x2 = times[c];
      y2 = lows[c];
      c2 = cvds[c];
    }
    lastLowPrice = lows[c];
    lastLowCvd = cvds[c];
    lastLowTime = times[c];
  }
}

function onStart(): void {
  swing = i32(p_swing());
  resetDaily = pb_cvd_reset();
  linesKept = i32(p_lines_kept());
}

// onBar() runs once per bar: fold the bar into CVD and the rings, test for a swing, write the outputs on every bar, and
// draw a divergence on the bar that confirms it.
function onBar(): void {
  const high = bar.high();
  const low = bar.low();
  const barTime = bar.time();
  const buy = in_buy();
  const sell = in_sell();
  if (resetDaily) {
    const day = Math.floor(barTime / 86400.0);
    if (day != prevDay) cvd = 0.0;
    prevDay = day;
  }
  cvd += buy - sell;
  sidedVolume += buy + sell;
  const range = high - low;
  rangeAvg = isNaN(rangeAvg) ? range : rangeAvg + (range - rangeAvg) * 0.1;
  const slot = barCount % RING;
  highs[slot] = high;
  lows[slot] = low;
  cvds[slot] = cvd;
  times[slot] = barTime;
  barCount += 1;
  testSwing();
  out_cvd(cvd);
  out_swing_here(swingHere);
  out_cvd_swing(sidedVolume > 0.0 ? swingCvd : NaN); // no dots on a market with no sided trades: the pane holds a flat zero line and the words
  out_divergence(f64(pendingKind));
  if (pendingKind != 0) {
    const k = divergences % linesKept; // the ring position: the oldest line, link and tag are reused
    divergences += 1;
    const tone = pendingKind < 0 ? ORANGE : AMBER;
    lines[k].set(x1, y1, x2, y2).color(tone);
    points[0] = x1;
    points[1] = c1;
    points[2] = x2;
    points[3] = c2;
    links[k].setPoints(points, 2).color(tone);
    const offset = (isNaN(rangeAvg) ? 0.0 : rangeAvg) * 0.6; // the tag sits just outside the line, on the swing side
    const tagY = pendingKind < 0 ? Math.max(y1, y2) + offset : Math.min(y1, y2) - offset;
    sb_clear();
    sb_text("div");
    tags[k].set((x1 + x2) * 0.5, tagY).text(str_text_sb);
    tags[k].color(tone);
  }
  if (bar.isLast() && sidedVolume <= 0.0) { // the market served no sided prints at all: say so once, top right
    sb_clear();
    sb_text("No sided trades on this market");
    notice.set(16, 14).text(str_text_sb);
    notice.anchor(ANCHOR_TOP_RIGHT).align(ALIGN_RIGHT).color(SLATE);
  }
}How it works
CVD is a running sum. input("buy", trades.volume, { side: "BUY", missing: "zero" }) and its SELL twin deliver the bar's aggressive volume per side (a bar with no prints counts as zero); their difference summed bar after bar is cvd, a line in the lower pane labelled CVD. trades.volume reads the base asset, so the sum is in coins: format: "si" with unit: " coins" prints it in the legend as "CVD -17.6K coins". cvd_reset (off) runs it from the first loaded bar; on, it restarts at every UTC midnight.
Swings confirm late. swing (8, 3 to 30) is the number of bars on each side a swing must beat, so a swing is confirmed swing bars after itself. A swing must beat every bar before it and at least match every bar after it, so a flat top on an odds chart counts once, on its first bar. swing_here is 1 on a confirming bar and gates the cvd_swing dot, which displacement_bars_by: { param: "swing", scale: -1 } draws back on the swing bar itself, swing bars before the confirming bar at whatever strength is set (displacement_bars: -8, the default's shift, stays for a host that reads only the literal).
A divergence is two swings that disagree. A higher price high against a lower CVD high is bearish (-1), a lower price low against a higher CVD low is bullish (+1); divergence carries the sign on the confirming bar and 0 elsewhere, a data-only signal the editor's Console prompt reads and a declared alert can fire on. On that bar a line handle joins the two price swings (x from bar.time()), a dashed polyline handle joins the two CVD swings in the pane, and a label handle writes "div" beside the price line through the one bounded slot. lines_kept (12, 1 to 60) lines stay on the chart; the oldest is recycled.
Where it runs
Markets with sided trades: crypto perps and spot, prediction markets. A market where one side does all the trading (CVD climbing the whole window) shows swings and no divergence, which is the honest reading.
When data is missing
On a market with no sided trades (FX, stocks) CVD stays flat at zero, no swing is dotted, and one slate line of words sits at the top right of the chart: "No sided trades on this market".
Customize it
- Faster swings. Lower
swing; more swings confirm and more pairs qualify. - A session CVD. Switch
cvd_reseton to restart the sum at every UTC midnight. - Dollars instead of coins. Add
currency: "USD"to bothtrades.volumeinputs and declareformat: "usd"without the unit oncvdandcvd_swing: the sum is then each trade's notional, as the native Cumulative Volume Delta reads by default. - Alert on a divergence. Bind
divergenceto aconstand declarealert("cvd_divergence", { when: ... }): it fires on the bar a divergence confirms, since the output turns from 0 to -1 or +1 there. Once the indicator is published and on a chart, the signal is in the chart's alert dialog (Alerts).
Run it
- In the editor's Explorer, press the Templates icon ("Browse starter templates") and pick CVD Divergence under Order flow.
- Press Run on a crypto perp or spot market: CVD draws in its own pane, and the evidence lines appear where a divergence confirmed.
- At the editor's Console prompt, type
last 60 divergenceto read the sign on each of the last 60 bars.
Concepts used
- Data sources for the
tradessource, its sides and themissingpolicy - Drawing objects for line, polyline and label handles and the lower-pane placement
- Plotting for
shape_wheregates anddisplacement_bars_by