Seasonality grid
A calendar of returns under the chart, shaped by the chart's interval and folded from a fixed span of the chart's own market, read as closed candles, however few bars the chart has loaded.
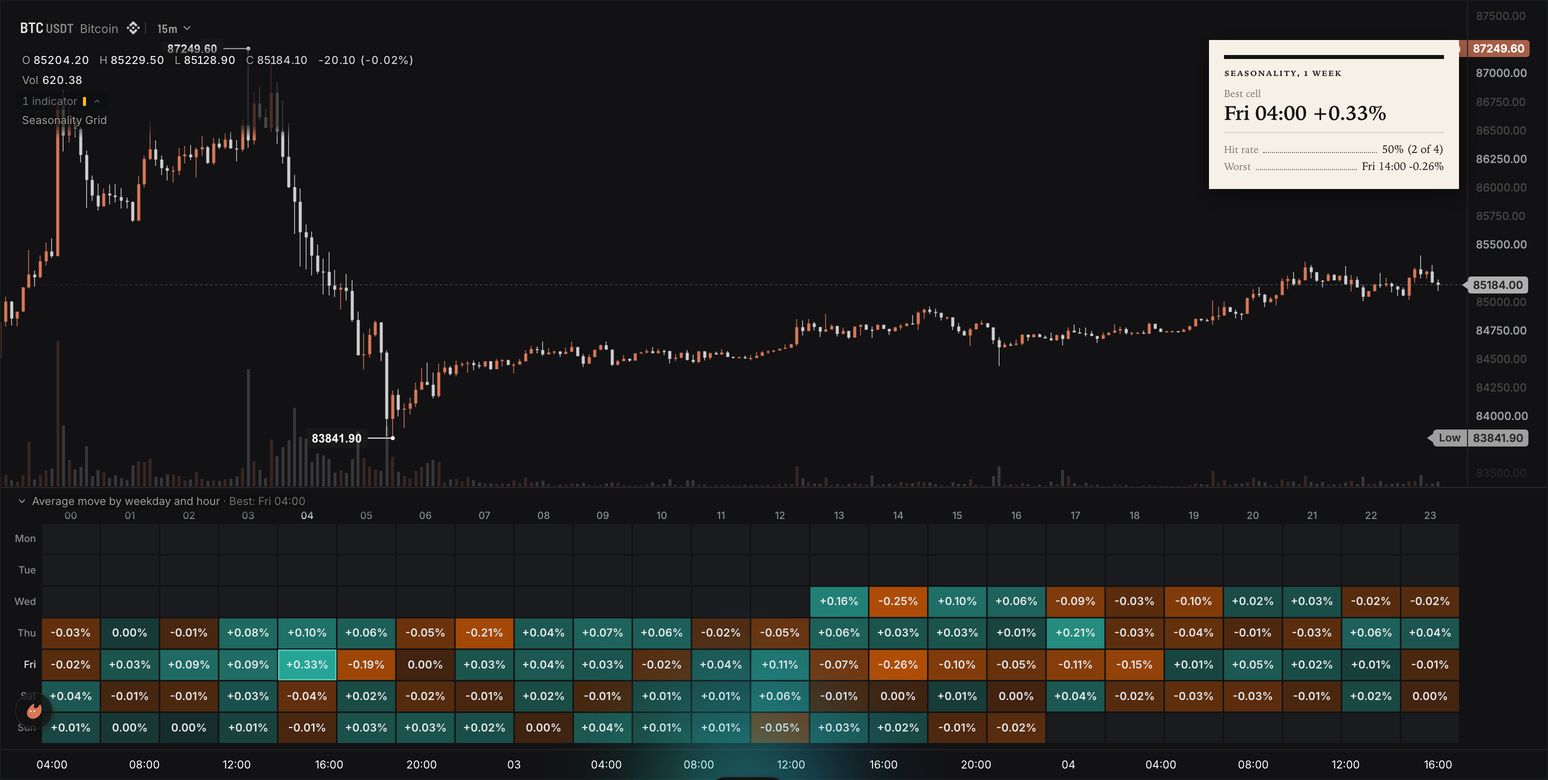
On any chart under a day it is a weekday by UTC-hour grid, Mon to Sun by 00 to 23, each cell the average move of that hour, its hourly candle's open to close in percent, over the newest 26 weeks: one sample per week, so a 1m, a 15m and a 1h chart show the same grid. On a daily or coarser chart it is a year by month grid: one cell per month, the month's return (its last close over the last close of the month before) as signed percent, the years as rows, newest first, at most max_rows, and an Avg row under them; the running month shows its move so far at the live price and counts in no average until it closes. Teal cells gained, orange cells lost, the strongest cells brightest, and zero reads as the chart's background; the best cell is outlined and named in the panel caption ("Best: Fri 08:00", "Best: Oct"), and the pointer opens a readout on any cell. A card at the top right, in the broadsheet look (newsprint, serif type, small caps, dotted leaders), carries the span in its title ("Seasonality, 26 weeks" or "Seasonality, since 2019"), the best cell with its average as the headline ("Fri 08:00 +0.25%", "October +18.2%"), then two rows: the hit rate (the share of that cell's samples that closed up, with the count) and the worst cell. While no cell has min_samples samples there is no grid: one sentence in slate at the top right of the price pane says how much history it found and the way out, and the card's headline reads "Not enough history".
The parts are the chart's own close, the bar grid (Data sources); two candles streams of the same market, hours at 1h and days at 1d, each a block of closed candles on every bar, the backlog on the first (Multi-timeframe); chart.interval_sec(), read once in onStart() to pick the grid (Sessions and units); two param.int settings labelled Years shown and Min samples (Setting kinds); one frame feeding one panel.heatmap whose title, caption, outlined cell and Avg row are written per run (Cards, frames and panels); a render.hud card of a headline tile.pill and a tile.rows with dotted leaders in the broadsheet look (HUD cards, Looks); and a label handle for the one sentence (Drawing objects). This is also the seasonality-grid template: the Seasonality Grid card under Beyond the time axis in the editor's starter list, and it compiles as written.
The wrun indicator
// Seasonality Grid: a calendar of returns below the chart, folded from a fixed span of history whatever the chart has
// loaded. On a chart under a day, a weekday x UTC-hour grid: each cell the average move of that hour (its open to its
// close) over the newest 26 weeks of hourly candles. On a daily or coarser chart, a year x month grid: each cell the
// month's return (its last close over the month before's), over up to 12 years of daily candles. Teal cells gained,
// orange cells lost, the strongest cells brightest, the best cell outlined. The trader sees when this market tends to
// move (the month that pays, the hour of the week that drifts), how often the best cell held, and which cell hurt most.

chart.interval_sec(); // the chart's bar interval in seconds, written by the chart: under a day the weekday grid, else the monthly grid
param.int("max_rows", 12, { min: 3, max: 12, label: "Years shown", description: "Years kept in the monthly grid, newest first (the weekday grid always has its 7 rows)" });
param.int("min_samples", 3, { min: 1, max: 20, label: "Min samples", description: "Samples a cell needs before it can be named best or worst: years behind a month, weeks behind a weekday hour" });
input("close", ohlcv.close); // the chart's own candles: the bar grid the two streams ride
// The two spans, read as closed candles of the chart's own market however few bars the chart has loaded: the weekday grid
// folds the hourly one on any chart under a day, the monthly grid folds the daily one on a daily or coarser chart.
input("hours", candles.cells, { interval: "1h", bars: 4368, description: "The newest 26 weeks of closed hourly candles: the weekday grid" });
input("days", candles.cells, { interval: "1d", bars: 4392, description: "The newest 12 years of closed daily candles: the monthly grid" });
output("best_avg", none, overlay, { description: "The best cell's average return, percent" }); // data-only, so the Console and a hover can read them
output("worst_avg", none, overlay, { description: "The worst cell's average return, percent" });
output("hit_rate", none, overlay, { description: "Share of the best cell's samples that closed up, percent" });
string("best_text", { max_bytes: 32 }); // "October +12.4%" or "Tue 14:00 +0.21%": the card's headline
string("worst_text", { max_bytes: 32 }); // the worst cell the same way
string("hit_text", { max_bytes: 32 }); // "65% (17 of 26)"
string("span_text", { max_bytes: 24 }); // "26 weeks" or "since 2019": the history the grid folds
string("words", { max_bytes: 128 }); // the one sentence when the history is too short
handles.label({ size: 11 }); // the one sentence, top right, in slate
const gridRows = frame("grid_rows", { max_bytes: 16384 }); // the heatmap: one cell per month and year, or per weekday and hour
// The grid under the chart: a signed scale around zero (teal gained, orange lost, the chart's background at zero, the strongest
// cells brightest), signed percent in every cell, a readout under the pointer; the title, the caption, the outlined best
// cell and the monthly grid's Avg row are written per run in the frame.
panel.heatmap({ name: "grid", title: "Seasonality", x: "category", place: "below", frame: gridRows, scale: "signed", positive_color: "#2dd4bf", negative_color: "#f86800", format: "%", decimals: 2, signed: true, hover_card: true, height_frac: 0.35 });
// The card, in the broadsheet look (newsprint, serif type, small caps, dotted leaders): the span in the title, the best cell
// and its average as the headline, then the hit rate and the worst cell as two rows. The viewer picks another look on the
// Style page's Look row.
render.hud("card", { position: "top_right", look: "broadsheet", title: "Seasonality, {{span_text}}", columns: 1, width: 250, safe_area: true, tiles: [
  tile.pill("Best cell", "best_text", { headline: true }),
  tile.rows([["Hit rate", "hit_text"], ["Worst", "worst_text"]], { leader: "dots" }),
] });

const MAX_YEARS = 12; const MONTHS = 12; const DAYS = 7; const HOURS = 24; // ring sizes for the largest settings
const DAY_SEC: f64 = 86400.0; const HOUR_SEC: f64 = 3600.0; const WEEK_SEC: f64 = 604800.0;
const MONTH_SHORT: StaticArray<string> = ["Jan", "Feb", "Mar", "Apr", "May", "Jun", "Jul", "Aug", "Sep", "Oct", "Nov", "Dec"];
const MONTH_LONG: StaticArray<string> = ["January", "February", "March", "April", "May", "June", "July", "August", "September", "October", "November", "December"];
const DAY_NAMES: StaticArray<string> = ["Mon", "Tue", "Wed", "Thu", "Fri", "Sat", "Sun"];
const SLATE: i32 = rgba(148, 163, 184, 255);
const monthRet = new StaticArray<f64>(MAX_YEARS * MONTHS); // the monthly grid: a return per year slot and month, NaN where empty
const yearOfSlot = new StaticArray<i32>(MAX_YEARS); // the year each ring slot holds
const hourSum = new StaticArray<f64>(DAYS * HOURS); // the weekday x hour grid: summed hour moves, samples, up samples
const hourCount = new StaticArray<i32>(DAYS * HOURS);
const hourUp = new StaticArray<i32>(DAYS * HOURS);
const monthAvg = new StaticArray<f64>(MONTHS); // the Avg row: each month's mean over the closed years shown, NaN below min_samples
const words = draw.label(0); // the one sentence

let daily = false; let maxRows = 12; let minSamples = 3; // read in onStart()
let lastDayClose: f64 = NaN; let lastDayOpen: f64 = NaN; // the daily fold: the newest closed day
let prevMonthEnd: f64 = NaN; // the close that ended the month before the newest one: the base of its return
let curMonthKey = -1; let curYear = -1; let curSlot = 0; let curMonth = 0; let yearsSeen = 0; // the month and year row being filled
let firstHourOpen: f64 = NaN; let lastHourOpen: f64 = NaN; // the hourly fold's span
let wordsShown = false;
let civYear = 0; let civMonth = 0; // civil()'s answer

// The UTC calendar date of epoch seconds (days to civil), into civYear and civMonth (1..12).
function civil(t: f64): void {
  const z = i64(Math.floor(t / DAY_SEC)) + 719468;
  const era = (z >= 0 ? z : z - 146096) / 146097;
  const doe = z - era * 146097;
  const yoe = (doe - doe / 1460 + doe / 36524 - doe / 146096) / 365;
  const doy = doe - (365 * yoe + yoe / 4 - yoe / 100);
  const mp = (5 * doy + 2) / 153;
  civMonth = i32(mp < 10 ? mp + 3 : mp - 9);
  civYear = i32(yoe + era * 400 + (civMonth <= 2 ? 1 : 0));
}
function monthKeyOf(t: f64): i32 { civil(t); return civYear * 12 + civMonth - 1; }
function sbSigned(v: f64, decimals: i32): void { if (v >= 0.0) sb_text("+"); sb_f64(v, decimals); sb_text("%"); } // "+12.4%", "-0.03%"
function sbHour(h: i32): void { if (h < 10) sb_text("0"); sb_int(h); sb_text(":00"); } // "14:00"
function fbHour(h: i32): void { fb_text("\""); if (h < 10) fb_text("0"); fb_int(h); fb_text("\""); } // the hour column key, "14"
function fbHourText(h: i32): void { if (h < 10) fb_text("0"); fb_int(h); fb_text(":00"); } // "14:00" inside a caption
function sbCount(n: i32, one: string, many: string): void { sb_int(n); sb_text(n == 1 ? one : many); } // "1 week", "26 weeks"
function showWords(): void { // the sentence: the label at the top right, and the card's headline says why it has no cell
  str_words_sb(); words.set(56, 14).text(str_words_sb).anchor(ANCHOR_TOP_RIGHT).align(ALIGN_RIGHT).color(SLATE); wordsShown = true;
  sb_clear(); sb_text("Not enough history"); str_best_text_sb();
}
function hideWords(): void { if (wordsShown) { words.delete(); wordsShown = false; } }

// onStart() runs once before the first bar: read the settings and the chart's interval, clear the rings.
function onStart(): void {
  daily = p_chart_interval_sec() >= DAY_SEC;
  maxRows = i32(p_max_rows()); if (maxRows < 1) maxRows = 1; if (maxRows > MAX_YEARS) maxRows = MAX_YEARS;
  minSamples = i32(p_min_samples()); if (minSamples < 1) minSamples = 1;
  for (let i = 0; i < MAX_YEARS * MONTHS; i += 1) monthRet[i] = NaN;
  for (let i = 0; i < DAYS * HOURS; i += 1) { hourSum[i] = 0.0; hourCount[i] = 0; hourUp[i] = 0; }
}

// The daily stream into its months: a new month closes the one before on the last daily close seen; the newest month is
// rewritten by every day that closes in it. A month whose calendar month before it holds no close stays empty (the first
// month of the stream, a month after a gap), so a return never spans two months.
function foldDays(t: f64): void {
  const block = in_days_view(); const cells = in_days_cells(); // f64 cells, six per candle: [offset_ms, open, high, low, close, volume]
  const n = cells < block.length ? cells : block.length; // -1 (no history on this bar) and 0 fold nothing
  for (let i = 0; i + 6 <= n; i += 6) {
    const close = block[i + 4]; if (!(close > 0.0)) continue;
    const open = t + block[i] / 1000.0; // the day's open, epoch seconds
    const key = monthKeyOf(open);
    if (key != curMonthKey) { // a new month: the last close seen ended the month before, when that month is the one just before
      prevMonthEnd = curMonthKey >= 0 && key == curMonthKey + 1 ? lastDayClose : NaN;
      curMonthKey = key; curMonth = civMonth - 1;
      if (civYear != curYear) { // a new year row: the next ring slot (the oldest row is reused once the ring is full)
        curYear = civYear; curSlot = yearsSeen % MAX_YEARS; yearsSeen += 1; yearOfSlot[curSlot] = civYear;
        for (let m = 0; m < MONTHS; m += 1) monthRet[curSlot * MONTHS + m] = NaN;
      }
    }
    if (!isNaN(prevMonthEnd)) monthRet[curSlot * MONTHS + curMonth] = (close / prevMonthEnd - 1.0) * 100.0; // final once the month's last day is in
    lastDayClose = close; lastDayOpen = open;
  }
}

// The hourly stream into its weekday hours: each hour's move, its open to its close in percent (every price move inside
// the hour summed), is one sample of the cell for the weekday and UTC hour it opened in, Monday first.
function foldHours(t: f64): void {
  const block = in_hours_view(); const cells = in_hours_cells(); // f64 cells, six per candle, as the daily stream
  const n = cells < block.length ? cells : block.length;
  for (let i = 0; i + 6 <= n; i += 6) {
    const open = block[i + 1]; const close = block[i + 4]; if (!(open > 0.0) || !(close > 0.0)) continue;
    const at = t + block[i] / 1000.0; // the hour's open, epoch seconds
    const day = i64(Math.floor(at / DAY_SEC)); // 1970-01-01 was a Thursday: (day + 3) % 7 is 0 on a Monday
    const cell = i32((day + 3) % 7) * HOURS + i32(i64(Math.floor(at / HOUR_SEC)) % 24);
    const move = (close / open - 1.0) * 100.0;
    hourSum[cell] += move; hourCount[cell] += 1; if (move > 0.0) hourUp[cell] += 1;
    if (isNaN(firstHourOpen)) firstHourOpen = at; lastHourOpen = at;
  }
}

// The monthly grid, on the live bar of a daily or coarser chart. Rows newest year first, every month a cell (null where
// the history has none), then the Avg row: each month's mean, the number the best month is picked by. The month still
// running shows the live price's move so far and counts in no average until it closes.
function writeCalendar(): void {
  const rows = yearsSeen < maxRows ? yearsSeen : maxRows;
  const forming = curMonthKey >= 0 && !isNaN(lastDayOpen) && monthKeyOf(lastDayOpen + DAY_SEC) == curMonthKey; // the newest month has days to come
  let best = -1; let worst = -1; let bestAvg = -Infinity; let worstAvg = Infinity; let bestUp = 0; let bestN = 0; let mostN = 0;
  for (let m = 0; m < MONTHS; m += 1) { // a month's samples are its closed returns across the years shown
    let sum = 0.0; let n = 0; let up = 0;
    for (let k = 0; k < rows; k += 1) {
      const slot = (curSlot - k + MAX_YEARS) % MAX_YEARS;
      if (forming && slot == curSlot && m == curMonth) continue;
      const v = monthRet[slot * MONTHS + m]; if (isNaN(v)) continue;
      sum += v; n += 1; if (v > 0.0) up += 1;
    }
    if (n > mostN) mostN = n;
    monthAvg[m] = NaN;
    if (n < minSamples) continue;
    const avg = sum / f64(n); monthAvg[m] = avg;
    if (avg > bestAvg) { bestAvg = avg; best = m; bestUp = up; bestN = n; }
    if (avg < worstAvg) { worstAvg = avg; worst = m; }
  }
  sb_clear(); if (yearsSeen > 0) { sb_text("since "); sb_int(yearOfSlot[(curSlot - rows + 1 + MAX_YEARS) % MAX_YEARS]); } str_span_text_sb();
  if (best < 0) { // no month has min_samples closed years: one sentence and its way out, never an empty grid
    sb_clear();
    if (mostN == 0) sb_text("No closed month in this market's history yet: open the 1h chart for the weekday grid");
    else { sb_text("Only "); sbCount(mostN, " year", " years"); sb_text(" of monthly history here, "); sb_int(minSamples); sb_text(" needed: open the 1h chart for the weekday grid"); }
    showWords(); return;
  }
  hideWords();
  const hit = (100.0 * f64(bestUp)) / f64(bestN);
  out_best_avg(bestAvg); out_worst_avg(worstAvg); out_hit_rate(hit);
  sb_clear(); sb_text(MONTH_LONG[best]); sb_text(" "); sbSigned(bestAvg, 1); str_best_text_sb();
  sb_clear(); sb_text(MONTH_LONG[worst]); sb_text(" "); sbSigned(worstAvg, 1); str_worst_text_sb();
  sb_clear(); sb_f64(hit, 0); sb_text("% ("); sb_int(bestUp); sb_text(" of "); sb_int(bestN); sb_text(")"); str_hit_text_sb();
  const live = bar.close(); const liveRet = forming && live > 0.0 && !isNaN(prevMonthEnd) ? (live / prevMonthEnd - 1.0) * 100.0 : NaN;
  fb_clear();
  fb_text("{\"title\":\"Monthly returns\",\"caption\":\"Best: "); fb_text(MONTH_SHORT[best]); // the worst rides the card
  fb_text("\",\"highlight\":{\"col\":\""); fb_text(MONTH_SHORT[best]); fb_text("\"},\"summary\":[{\"label\":\"Avg\",\"values\":[");
  for (let m = 0; m < MONTHS; m += 1) { if (m > 0) fb_text(","); fb_f64(monthAvg[m], 2); }
  fb_text("]}],\"rows\":[");
  let first = true;
  for (let k = 0; k < rows; k += 1) { // newest year first; every month emitted so the columns keep their calendar order
    const slot = (curSlot - k + MAX_YEARS) % MAX_YEARS;
    for (let m = 0; m < MONTHS; m += 1) {
      if (!first) fb_text(","); first = false;
      const v = forming && slot == curSlot && m == curMonth && !isNaN(liveRet) ? liveRet : monthRet[slot * MONTHS + m];
      fb_text("[\""); fb_text(MONTH_SHORT[m]); fb_text("\",\""); fb_int(yearOfSlot[slot]); fb_text("\","); fb_f64(v, 2); fb_text("]");
    }
  }
  fb_text("]}"); writeFrameBuffer(FRAME_GRID_ROWS);
}

// The weekday x hour grid, on the live bar of a chart under a day. Mon..Sun rows, 00..23 UTC columns, each cell the
// average move of that hour over the weeks folded (null where no hour closed); the best cell is outlined.
function writeHours(): void {
  const weeks = isNaN(firstHourOpen) ? 0 : i32(Math.round((lastHourOpen - firstHourOpen + HOUR_SEC) / WEEK_SEC)); // the span, in whole weeks
  let best = -1; let worst = -1; let bestAvg = -Infinity; let worstAvg = Infinity; let mostN = 0;
  for (let i = 0; i < DAYS * HOURS; i += 1) {
    const n = hourCount[i]; if (n > mostN) mostN = n; if (n < minSamples) continue;
    const avg = hourSum[i] / f64(n);
    if (avg > bestAvg) { bestAvg = avg; best = i; }
    if (avg < worstAvg) { worstAvg = avg; worst = i; }
  }
  sb_clear(); sbCount(weeks, " week", " weeks"); str_span_text_sb();
  if (best < 0) { // no weekday hour has min_samples weeks behind it: one sentence and its way out, never an empty grid
    sb_clear();
    if (mostN == 0) sb_text("No hourly history for this market yet: switch to a market that has traded for a few weeks");
    else { sb_text("Only "); sbCount(mostN, " week", " weeks"); sb_text(" of hourly history here, "); sb_int(minSamples); sb_text(" needed: lower Min samples in the settings"); }
    showWords(); return;
  }
  hideWords();
  const bestN = hourCount[best]; const bestUp = hourUp[best]; const hit = (100.0 * f64(bestUp)) / f64(bestN);
  out_best_avg(bestAvg); out_worst_avg(worstAvg); out_hit_rate(hit);
  sb_clear(); sb_text(DAY_NAMES[best / HOURS]); sb_text(" "); sbHour(best % HOURS); sb_text(" "); sbSigned(bestAvg, 2); str_best_text_sb();
  sb_clear(); sb_text(DAY_NAMES[worst / HOURS]); sb_text(" "); sbHour(worst % HOURS); sb_text(" "); sbSigned(worstAvg, 2); str_worst_text_sb();
  sb_clear(); sb_f64(hit, 0); sb_text("% ("); sb_int(bestUp); sb_text(" of "); sb_int(bestN); sb_text(")"); str_hit_text_sb();
  fb_clear();
  fb_text("{\"title\":\"Average hourly move by weekday (UTC)\",\"caption\":\"Best: "); fb_text(DAY_NAMES[best / HOURS]); fb_text(" "); fbHourText(best % HOURS); // the worst rides the card
  fb_text("\",\"highlight\":{\"row\":\""); fb_text(DAY_NAMES[best / HOURS]); fb_text("\",\"col\":"); fbHour(best % HOURS); fb_text("},\"rows\":[");
  let first = true;
  for (let d = 0; d < DAYS; d += 1) for (let h = 0; h < HOURS; h += 1) { // every cell emitted so both axes keep their order
    if (!first) fb_text(","); first = false;
    const i = d * HOURS + h;
    fb_text("["); fbHour(h); fb_text(",\""); fb_text(DAY_NAMES[d]); fb_text("\",");
    if (hourCount[i] > 0) fb_f64(hourSum[i] / f64(hourCount[i]), 4); else fb_text("null");
    fb_text("]");
  }
  fb_text("]}"); writeFrameBuffer(FRAME_GRID_ROWS);
}

// onBar() runs once per bar: fold the closed candles this bar carries from the stream its grid reads (the first bar
// carries the whole backlog), then on the live bar write that grid, the card's words and the outputs.
function onBar(): void {
  const t = bar.time();
  if (daily) foldDays(t); else foldHours(t);
  if (!bar.isLast()) return;
  if (daily) writeCalendar(); else writeHours();
}How it works
The chart's interval picks the grid. chart.interval_sec() declares a hidden setting the chart fills with its bar interval in seconds before the first bar, and onStart() reads it once through p_chart_interval_sec(): 86400 or more, a daily or coarser chart, picks the year by month grid and its days stream; anything shorter, 0 included (an unknown interval), picks the weekday by hour grid and its hours stream. onBar() then folds only that stream, on every bar, the live bar included, and on the live bar (bar.isLast()) writes only that grid, the card's words and the outputs. The chart replays the forming bar from a snapshot of the module taken after the last closed bar, so these plain sums never count a candle twice (Repainting). Both streams are declared, so both load on every chart, and only the picked one is folded.
Two streams, two fixed spans. input("hours", candles.cells, { interval: "1h", bars: 4368 }) asks for the newest 26 weeks of closed hourly candles (26 weeks of 168 hours), and input("days", candles.cells, { interval: "1d", bars: 4392 }) for the newest 12 years of closed daily candles (12 years of 366 days), both of the chart's own market, since neither names a symbol or an exchange. A stream reaches its bars back however few bars the chart has loaded (further when the chart has loaded more; the card's title reads the span actually folded), so the grid does not follow the chart's window: a 1m, a 15m and a 1h chart fold the same hourly candles and show the same weekday grid. The first bar carries the backlog, every candle closed up to it, and each later bar the candles that closed since the bar before, so a forming candle never arrives and none arrives twice (Multi-timeframe). Each candle is six numbers, [offset_ms, open, high, low, close, volume], oldest first: in_hours_cells() counts those numbers, not candles (-1 or 0 on a bar that carries none), so the folds step by six through in_hours_view(), and in_days_view() the same way; the candle opened at bar.time() + offset_ms / 1000 epoch seconds, the instant its cell is keyed on. close stays the first input, the bar grid the two streams ride.
Why not a pin or the chart's bars. A scalar ohlcv input pinned to interval: "1h" hands each chart bar one hourly close, so it covers only the chart's own window plus its pre-roll (a few hours of closes on a 1m chart), and a pin finer than the chart is refused, which would stop the run on every daily chart. The chart's own bars are only what it has loaded (on BTCUSDT on Binance Futures, about 290 on a 1h chart and 481 on a 1d chart), which gives each weekday hour or each month one or two samples, under the default min_samples of 3.
An hour is one sample a week. foldHours() turns each hourly candle into one sample, its open to close in percent ((close / open - 1) * 100, every price move inside the hour summed), and adds it to the cell of the weekday and UTC hour the candle opened in, Monday first (1970-01-01 was a Thursday, so (day + 3) % 7 is 0 on a Monday). Each cell keeps its summed moves, its sample count and its count of samples that closed up (hourSum, hourCount, hourUp). A weekday hour comes round once a week, so its count is the weeks behind it, and the cell prints the average of its samples. The hour's own candle reads the same on every chart interval, where an average of a 1m chart's bar returns would round to 0.00%.
A month is its last close over the month before's. foldDays() walks the daily candles into calendar months by the UTC date of each day's open (civil() turns epoch seconds into the year and the month). A day in a new month closes the month before on the last daily close seen, and every day that closes in a month rewrites that month's cell in monthRet as its close over the close that ended the month before, in percent, so the cell is final once the month's last day is in. The stream's first month has no close before it and stays empty, and so does a month whose calendar month before it holds no candle (a gap in the history): the close that ended a month only bases the next month's return when the two months are adjacent (key == curMonthKey + 1), so a return never spans two months. A new year takes the next of 12 ring slots (MAX_YEARS, each slot's year in yearOfSlot), and once 12 years are held the oldest row is reused. The month still running shows the live price's move so far, bar.close() over the close that ended the month before, and counts in no average: a month joins the averages once the day after its newest closed day falls in the next month.
One frame is the grid. frame("grid_rows") carries [x key, y key, value] cells: [month, year, return] on the monthly grid, newest year first, and [hour, weekday, average] on the weekday grid, null where the history has none (fb_f64 writes a NaN month as null), so every cell is written and both axes keep their calendar order, since the panel orders keys as the rows first name them. Beside the rows the frame carries what changes per run: title ("Monthly returns" or "Average hourly move by weekday (UTC)"), caption, which names the best cell only ("Best: Oct", "Best: Fri 08:00"; the worst rides the card, so the title row stays short enough to read), highlight, the best month's column ({"col": "Oct"}) or the best weekday-hour cell ({"row": "Fri", "col": "08"}), which the panel outlines, and on the monthly grid summary, one row labelled "Avg" under the years: each month's mean over the closed years shown, null below min_samples, the number the best month is picked by. The declared panel.heatmap holds what does not change: scale: "signed" around zero with teal positive_color and orange negative_color, format: "%" with decimals: 2 and signed: true so a cell prints "+2.28%" or "-0.27%", hover_card: true for the readout, height_frac: 0.35 for the pane's share of the chart. The panel prints a cell's value when the cell is at least 34 px wide and 11 px tall; no word toggles it. The grid is built in the frame buffer (fb_clear, fb_text, fb_int, fb_f64) and sent with writeFrameBuffer(FRAME_GRID_ROWS), allocation-free on every live tick.
Best and worst need samples. A cell qualifies once it holds min_samples (3) samples: closed years behind a month, counted over the year rows shown with the running month skipped, or weeks behind a weekday hour. Among the qualifying cells the highest average is best and the lowest is worst, so the caption, the outline and the card only ever name a cell that has min_samples. best_avg, worst_avg and hit_rate (the share of the best cell's samples that closed up, in percent) are data-only outputs written on the live bar once a cell qualifies, so the Console and a hover can read the numbers behind the card.
The card reads slots. The headline is a tile.pill on the best_text slot, so the cell's name rides with its number ("Fri 08:00 +0.25%" with two decimals, "October +18.2%" with one; a tile.value would print the number alone), and tile.rows with leader: "dots" reads hit_text ("65% (17 of 26)", so the count shows) and worst_text ("Fri 18:00 -0.27%", "June -8.5%"). The title "Seasonality, {{span_text}}" resolves the span_text slot on the chart: the hourly span folded, in whole weeks ("26 weeks"), or the oldest year row shown ("since 2019"), written on the live bar before the sample check, so the span reads even while no cell qualifies. Every line is built with the sb_* builder and sent with str_<slot>_sb() (Strings and text). look: "broadsheet" sets the paper, the serif type, the small-caps title, the headline at 20 and the dotted leaders; width: 250 and safe_area: true keep the card clear of the legend and the pane action bar at the top right.
The sentence is a label handle. handles.label({ size: 11 }) declares the kind and draw.label(0) makes the one handle. While no cell qualifies, showWords() sends the sentence to the words slot, sets the label 56 px in from the pane's top right corner and 14 px down (ANCHOR_TOP_RIGHT, right-aligned, in slate), and writes "Not enough history" into best_text for the card's headline; the first live write that finds a best cell deletes the label (hideWords()).
Where it runs
Every market with candles, on any chart from 1m up: crypto perpetuals and spot, gold, prediction markets. It reads only the chart's own market (its candles, an hourly stream and a daily stream), never another one, so no market refuses it, and every cell is keyed on UTC. On a market that pauses (gold), the hours it does not trade stay empty cells. A young market shows the sentence until a cell has min_samples samples: at the default 3, a chart under a day draws the grid once one weekday hour has closed in three different weeks, and a daily chart once one calendar month holds three closed returns, which takes over two years; until then the daily chart's sentence points to the 1h chart and its weekday grid. Both streams load on every chart, so a daily chart also fetches the hourly candles back to its first bar, which its grid never reads. On a weekly chart the legend carries one warning: the hourly stream asks back to the chart's first bar, and hourly candles reach back only 25,000 hours (How far back history reaches). The monthly grid does not read them and is whole.
When data is missing
Until one cell has min_samples samples there is no grid: the live bar writes no frame and no outputs (best_avg, worst_avg and hit_rate stay unwritten), and one sentence in slate stands at the top right of the price pane with the history found and the way out. On a chart under a day it reads "Only 2 weeks of hourly history here, 3 needed: lower Min samples in the settings", or "No hourly history for this market yet: switch to a market that has traded for a few weeks" before any hour has closed; on a daily or coarser chart, "Only 2 years of monthly history here, 3 needed: open the 1h chart for the weekday grid", or "No closed month in this market's history yet: open the 1h chart for the weekday grid". The card stays up: its title still reads the span, its headline reads "Not enough history", and the Hit rate and Worst rows print a dash, since their slots are never written. Cells the history has not reached stay empty: the hours a paused market does not trade, the months of the newest year still to come, and the stream's first month, which has no close before it to measure from (the daily history of BTCUSDT on Binance Futures starts in November 2019, so its 2019 row holds December only). The running month shows its move so far at the live price but counts in no average until it closes.
Customize it
- More or fewer year rows.
max_rows(12, 3 to 12), the Years shown row, is the years kept in the monthly grid, newest first, and the card's "since" year is the oldest of them; the weekday grid always has its 7 rows. - A stricter best cell.
min_samples(3, 1 to 20), the Min samples row, is the samples a cell needs before it can be named best or worst: years behind a month, weeks behind a weekday hour. A higher number waits for more history before the grid draws, and since the monthly grid counts only the years shown, amin_samplesabovemax_rowskeeps a daily chart on the sentence. - A longer or shorter span. The spans are the streams'
bars: 4368 hourly candles (26 weeks) onhoursand 4392 daily candles (12 years) ondays. Change either in the source and Run again:barstakes up to 5000 (about 30 weeks of hourly candles), and the monthly grid keeps at most 12 year rows whatever the daily span. - Other colours.
positive_colorandnegative_coloron the panel are colour literals in this source (the house teal#2dd4bfand orange#f86800), so here another pair is a source edit. Declare aparam.colorand write"@<name>"in either word, and that colour becomes a setting: the build writes the setting's default in its place, and the chart paints the trader's pick (Panel words). - Change the look. The card is made in the broadsheet look, a literal
lookin this source, so the Look row on the indicator's Style page switches it to any of the twelve shipped looks without code, "As made" first (The Style page). Bindlookto aparam.choiceover looks instead (look: "@card_look") and that setting's row becomes the look's one control, with no Look row for the card (Looks). The grid look (paper, a bold headline at 44, a red accent) is the second one this example was shot in.
Run it
- In the editor's Explorer, press the Templates icon ("Browse starter templates") and pick Seasonality Grid under Beyond the time axis.
- Press Run on BTCUSDT on Binance Futures at 15m: the weekday by hour grid fills below the chart with the best cell outlined, and the broadsheet card names it at the top right. Switch the chart to 1m or 1h for the same grid, and to 1D for the year by month grid with its Avg row; no scroll back is needed, since each grid reads its own stream.
- At the editor's Console prompt, type
hit_rateto read the best cell's hit rate on the live bar, oroutputsforbest_avg,worst_avgandhit_ratetogether.
Concepts used
- Data sources for
ohlcv.close, the chart's own candles and the bar grid the streams ride - Multi-timeframe for the
candlesstream:interval,bars, the six-number candle, the backlog on the first bar and thein_<name>_cells()/in_<name>_view()loop - How far back history reaches for the 25,000 hourly candles behind the warning on a weekly chart
- Sessions and units for
chart.interval_sec()andp_chart_interval_sec() - Setting kinds and Options on a setting for the two
param.intsettings and theirlabel - Cards, frames and panels for frames,
panel.heatmap, the signed scale, the per-runtitle,caption,highlightandsummary, and the frame buffer - Panel words for
positive_color,negative_colorand a colour word bound to aparam.color - HUD cards for
render.hud, its anchors,widthandsafe_area - Looks for
look: "broadsheet", the grid look andlookbound to aparam.choice - Blocks and tiles for the headline
tile.pillandtile.rowswithleader: "dots" - The Style page for the Look row that switches the look without code
- Strings and text for the
sb_*builders and string slots - Drawing objects for
handles.labeland thedraw.labelhandle