Positioning regimes
Each bar's open-interest change, counted in contracts and as a percent, in its own pane under the chart, colored by who moved: amber for price up with open interest up (new longs), orange for price down with open interest up (new shorts), sky for price up with open interest down (short covering), violet for price down with open interest down (long closing). A key card at the top right of the chart names the four colors and gives each regime's share of the last key_window bars, so the colors explain themselves. On price, a small dot marks the bar where the window's leading regime changed hands: amber under the bar when buying pressure took over, orange over the bar when selling pressure did.
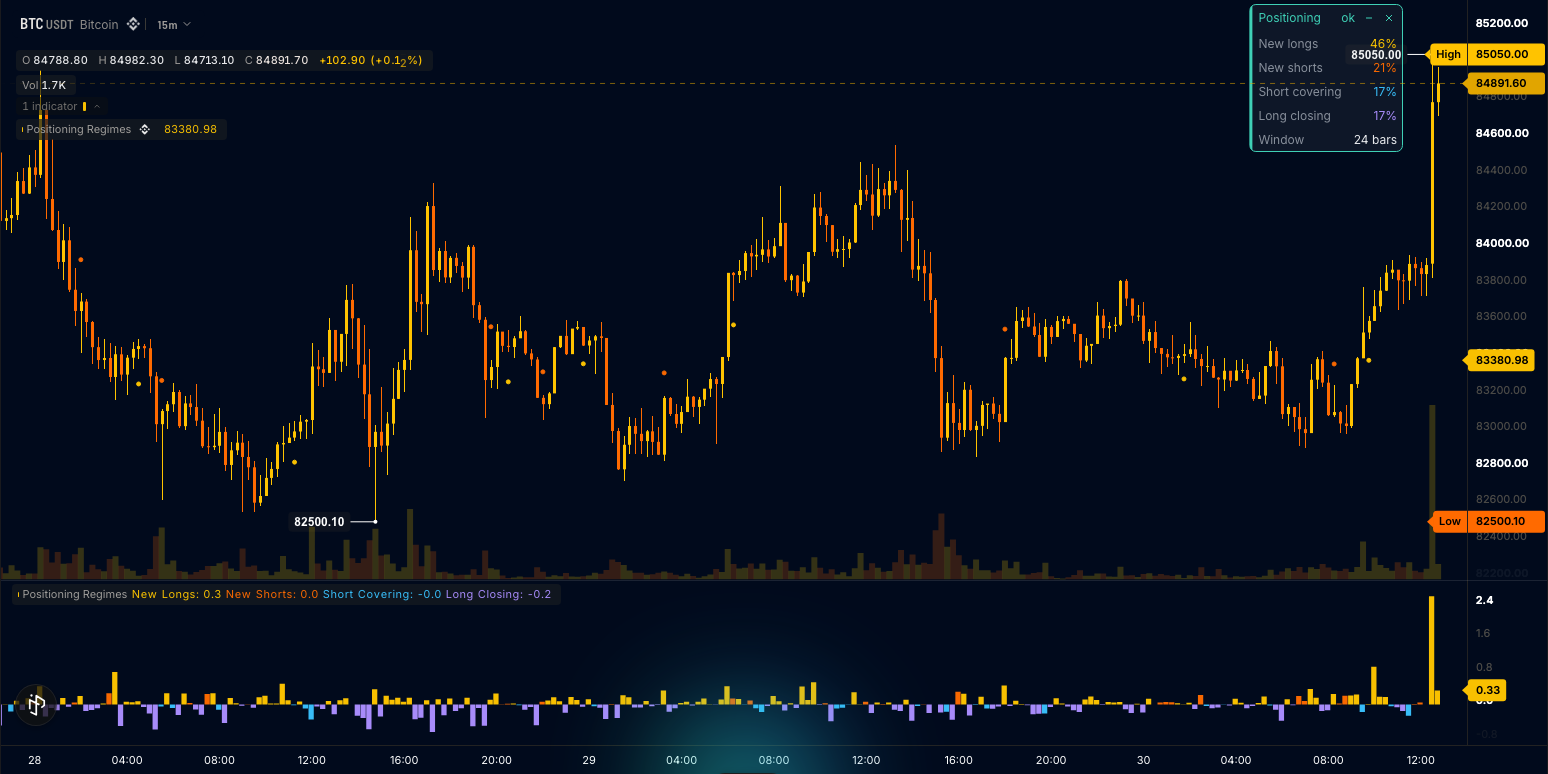
The parts are an oi.close input that reads NaN where the market has none and a funding.rate_close input that reads NaN off perpetuals (Data sources), one histogram output per regime so the legend names every colour (Plotting), a draw.card with one text slot per value cell (Cards, frames and panels), and two shape outputs for the leader-flip dots. This is also the positioning-regimes template: the Positioning Regimes card under Order flow in the editor's starter list, and it compiles as written.
The wrun indicator
// Positioning Regimes: each bar's open-interest change in its own pane, colored by who moved. On a perpetual, open
// interest is counted in coins (the dollar reading over the bar's close), so a price move alone never changes it; a
// prediction market's reading is used as served (already a count of YES and NO pairs). Price up with OI up is
// new longs (amber), price down with OI up is new shorts (orange), price up with OI down is short covering (sky),
// price down with OI down is long closing (violet). A key card at the top right gives each regime's share of the
// last bars, so the colors explain themselves; a dot on price marks the bar where the window's leading regime changed
// hands and held for three bars, amber for buying pressure, orange for selling pressure.

param.int("smoothing", 1, { min: 1, max: 20, label: "Smoothing, bars", description: "Bars the OI change and the price change are averaged over before coloring; 1 = raw" });
param.int("key_window", 24, { min: 4, max: 200, label: "Key window, bars", description: "Bars the key card's shares are counted over" });
input("close", ohlcv.close); // the primary input: the chart's own candles define the grid every other input lines up on
input("oi", oi.close, { missing: "nan" }); // open interest at the bar's close, as served; a bar without a reading, or a market without open interest, reads NaN
input("funding", funding.rate_close, { missing: "nan" }); // served on perpetuals only (NaN elsewhere): their open interest is dollars, read in coins
output("new_longs", histogram, lower, { unit: "%", color: "#f8c000" }); // the bar's OI change in contracts as a percent, drawn by the regime that owns the bar: price up, OI up
output("new_shorts", histogram, lower, { unit: "%", color: "#f86800" }); // price down, OI up
output("short_covering", histogram, lower, { unit: "%", color: "#38bdf8" }); // price up, OI down
output("long_closing", histogram, lower, { unit: "%", color: "#a78bfa" }); // price down, OI down
output("regime", none); // data-only: 0 new longs, 1 new shorts, 2 short covering, 3 long closing; the Console can read it
output("share_new_longs", none); // data-only: each regime's share of the key window, 0..1, read in the Console
output("share_new_shorts", none);
output("share_short_covering", none);
output("share_long_closing", none);
output("buyers_lead", shape, overlay, { color: "#f8c000" }); // a dot under the bar where the window's leading regime turned to buying pressure (new longs or short covering)
output("sellers_lead", shape, overlay, { color: "#f86800" }); // a dot over the bar where it turned to selling pressure (new shorts or long closing)
output("leader", none); // data-only: the regime with the most bars in the window, 0..3
string("new_longs", { max_bytes: 8 }); // the card's value cells, one slot each, written on the live bar
string("new_shorts", { max_bytes: 8 });
string("short_covering", { max_bytes: 8 });
string("long_closing", { max_bytes: 8 });
string("window", { max_bytes: 16 });
string("text", { max_bytes: 40 }); // the one line of words when the market has no open interest
handles.label({ anchor: "top_right", align: "right", color: "#94a3b8", size: 11 }); // the notice, in pane pixels from the chart's top-right corner
draw.card("positioning_key", {
  title: "Positioning",
  anchor: "top_right",
  offset: [56, 0], // inward past the price-axis tags (High, Low, last price reach about 46 px into the pane)
  rows: [
    { label: "New longs", value: { text: "new_longs" }, color: "#f8c000" },
    { label: "New shorts", value: { text: "new_shorts" }, color: "#f86800" },
    { label: "Short covering", value: { text: "short_covering" }, color: "#38bdf8" },
    { label: "Long closing", value: { text: "long_closing" }, color: "#a78bfa" },
    { label: "Window", value: { text: "window" } },
  ],
});

const MAX_WINDOW = 200; // the ring is sized for the largest window; onStart() reads the one in use
const REGIMES = 4;
const regimeRing = new StaticArray<i32>(MAX_WINDOW); // the last window bars' regimes, -1 where the bar had no reading
const counts = new StaticArray<i32>(REGIMES); // how many bars of the window sit in each regime
const notice = draw.label(0);
let smoothing = 1; // settings, read in onStart()
let keyWindow = 24;
let oiChangeAvg = new Sma(1); // the smoothers, rebuilt in onStart()
let priceChangeAvg = new Sma(1);
let prevClose = NaN; // the previous bar's close and OI, as served
let prevOi = NaN;
let perp = false; // funding seen: a perpetual, whose dollar open interest moves with price
let oiSeen = false; // any finite OI reading at all: false means the market has no open interest
let head = 0; // the ring's write cursor and how many slots hold a bar
let filled = 0;
let leader = -1; // the regime holding the most bars of the window, once it has held for HOLD_BARS bars
let candidate = -1; // the regime leading right now, and how many bars in a row it has led
let candidateRun = 0;
const HOLD_BARS = 3; // a new leader is marked once it has led three bars in a row
let rangeAvg = NaN; // a running mean of high - low: the dot's distance from the bar

function share(index: i32): f64 { // a regime's share of the bars in the window that had a reading
  let counted = 0;
  for (let i = 0; i < REGIMES; i += 1) counted += counts[i];
  return counted == 0 ? NaN : f64(counts[index]) / f64(counted);
}

function sendShare(value: f64, send: () => i32): void { // "31%" into one card cell
  sb_clear();
  sb_f64(value * 100.0, 0);
  sb_text("%");
  send();
}

function onStart(): void {
  smoothing = i32(p_smoothing());
  keyWindow = i32(p_key_window());
  oiChangeAvg = new Sma(smoothing);
  priceChangeAvg = new Sma(smoothing);
  for (let i = 0; i < REGIMES; i += 1) counts[i] = 0;
}

// onBar() runs once per bar: the OI change in contracts as a percent, the price change, the regime from their signs, the window counts;
// then the histogram and the shares on every bar, the card's cells and the notice on the live bar only.
function onBar(): void {
  const close = bar.close();
  const high = bar.high();
  const low = bar.low();
  const oiNow = in_oi();
  const range = high - low;
  rangeAvg = isNaN(rangeAvg) ? range : rangeAvg + (range - rangeAvg) * 0.1;
  if (!isNaN(oiNow)) oiSeen = true;
  if (!isNaN(in_funding())) perp = true;
  const now = perp ? oiNow / close : oiNow; // both readings in one unit: coins on a perpetual, as served elsewhere
  const before = perp ? prevOi / prevClose : prevOi;
  const rawOiChange = isNaN(before) || before <= 0.0 ? NaN : ((now - before) / before) * 100.0;
  const rawPriceChange = isNaN(prevClose) ? NaN : close - prevClose;
  prevOi = oiNow;
  prevClose = close;
  const oiChange = oiChangeAvg.update(rawOiChange); // NaN until the smoothing window is full or while a reading is missing
  const priceChange = priceChangeAvg.update(rawPriceChange);
  let regime = -1;
  if (!isNaN(oiChange) && !isNaN(priceChange)) {
    if (oiChange >= 0.0) regime = priceChange >= 0.0 ? 0 : 1; // OI rising: new longs when price rose, new shorts when it fell
    else regime = priceChange >= 0.0 ? 2 : 3; // OI falling: short covering when price rose, long closing when it fell
  }
  const leaving = regimeRing[head]; // the bar that drops out of the window
  if (filled == keyWindow && leaving >= 0) counts[leaving] -= 1;
  regimeRing[head] = regime;
  if (regime >= 0) counts[regime] += 1;
  head = (head + 1) % keyWindow;
  if (filled < keyWindow) filled += 1;
  let shiftDot = NaN; // this bar's dot on price, NaN when the leader held
  let best = -1; // the window's leader: the regime with the most bars, holding at least two bars in five
  let bestCount = 0;
  let counted = 0;
  for (let i = 0; i < REGIMES; i += 1) {
    counted += counts[i];
    if (counts[i] > bestCount) {
      bestCount = counts[i];
      best = i;
    }
  }
  if (filled < keyWindow || counted == 0 || f64(bestCount) * 5.0 < f64(counted) * 2.0) best = -1; // no leader worth the name yet
  if (best == candidate) candidateRun += 1;
  else {
    candidate = best;
    candidateRun = 1;
  }
  if (candidate >= 0 && candidateRun == HOLD_BARS && candidate != leader) { // the lead changed hands and held: mark it once
    if (leader >= 0) shiftDot = candidate == 0 || candidate == 2 ? low - rangeAvg * 0.6 : high + rangeAvg * 0.6; // buying pressure below the bar, selling pressure above
    leader = candidate;
  }
  out_new_longs(regime == 0 ? oiChange : NaN); // one bar per regime output; the others read NaN and draw nothing
  out_new_shorts(regime == 1 ? oiChange : NaN);
  out_short_covering(regime == 2 ? oiChange : NaN);
  out_long_closing(regime == 3 ? oiChange : NaN);
  out_regime(regime < 0 ? NaN : f64(regime));
  const newLongs = share(0);
  const newShorts = share(1);
  const shortCovering = share(2);
  const longClosing = share(3);
  out_share_new_longs(newLongs);
  out_share_new_shorts(newShorts);
  out_share_short_covering(shortCovering);
  out_share_long_closing(longClosing);
  out_leader(leader < 0 ? NaN : f64(leader));
  out_buyers_lead(leader == 0 || leader == 2 ? shiftDot : NaN);
  out_sellers_lead(leader == 1 || leader == 3 ? shiftDot : NaN);
  if (bar.isLast()) {
    if (oiSeen && !isNaN(newLongs)) { // the card appears once every cell has a value; history bars never write them
      sendShare(newLongs, str_new_longs_sb);
      sendShare(newShorts, str_new_shorts_sb);
      sendShare(shortCovering, str_short_covering_sb);
      sendShare(longClosing, str_long_closing_sb);
      sb_clear();
      sb_int(keyWindow);
      sb_text(" bars");
      str_window_sb();
    } else if (!oiSeen) { // the market served no open interest at all: say so once, top right
      sb_clear();
      sb_text("No open interest on this market");
      notice.set(16, 14).text(str_text_sb);
    }
  }
}How it works
Who moved is two signs. On a perpetual, open interest arrives in dollars, so each reading is divided by the bar's close first: a dollar figure rises with price even when no position opened, which would paint short covering as new longs. Only a perpetual serves funding, so a finite funding reading is what marks one. A prediction market's open interest is its collateral, one dollar per YES and NO pair, already a count of contracts, so it is read as served. The bar's price change and its open-interest change in contracts, each averaged over smoothing bars (1 is raw), sort the bar into one of four regimes; regime carries the index (0 new longs, 1 new shorts, 2 short covering, 3 long closing) as a data-only output. The bar's open-interest change in contracts, as a percent, is written to the one histogram output that owns the regime (new_longs, new_shorts, short_covering, long_closing) and NaN to the other three, so each colour is its own series and the legend names it.
The key card counts the window. A ring of the last key_window (24, 4 to 200) regimes gives each regime's share, written to the card's text slots on the live bar (share_* carry the same fractions as data-only outputs). The card sits at the top right, offset inward past the price-axis tags.
A leader flip is confirmed. leader is the regime with the most bars in the window. The new leader must hold at least two bars in five of the window and stay in the lead for three bars in a row; on that bar buyers_lead (new longs or short covering took over) carries the bar's low and sellers_lead the bar's high, the two dots on price.
Where it runs
Perps (Binance Futures, Hyperliquid), whose open interest is counted in coins, and prediction markets, whose open interest is the collateral as served (Polymarket serves it in sparse readings: most bars read NaN and the bars with a reading carry the whole change). The card appears once the window has readings.
When data is missing
Spot, stocks and FX have no open interest: the pane stays empty, the card stays away, and one slate line of words sits at the top right of the chart: "No open interest on this market".
Customize it
- Smoother regimes. Raise
smoothingto average the two changes over more bars before sorting the bar. - A longer key.
key_windowup to 200 bars; the ring is sized for the largest window. - Two colours instead of four. Merge the two buying regimes and the two selling ones into two histogram outputs and a two-row card.
Run it
- In the editor's Explorer, press the Templates icon ("Browse starter templates") and pick Positioning Regimes under Order flow.
- Press Run on a perp, such as BTCUSDT on Binance Futures: the pane fills with the four colours and the key card appears once the window has readings.
- At the editor's Console prompt, type
last 24 regimeto read the regime index of the last 24 bars.
Concepts used
- Data sources for the
oisource andmissing: "nan" - Plotting for one histogram output per colour
- Cards, frames and panels for
draw.cardand its text slots