Correlation matrix
How this chart's market moved with eight crypto perpetuals over the last window bars, as a market by market grid below the chart: the Binance Futures BTC, ETH, SOL, BNB, XRP, DOGE, ADA and AVAX perpetuals.
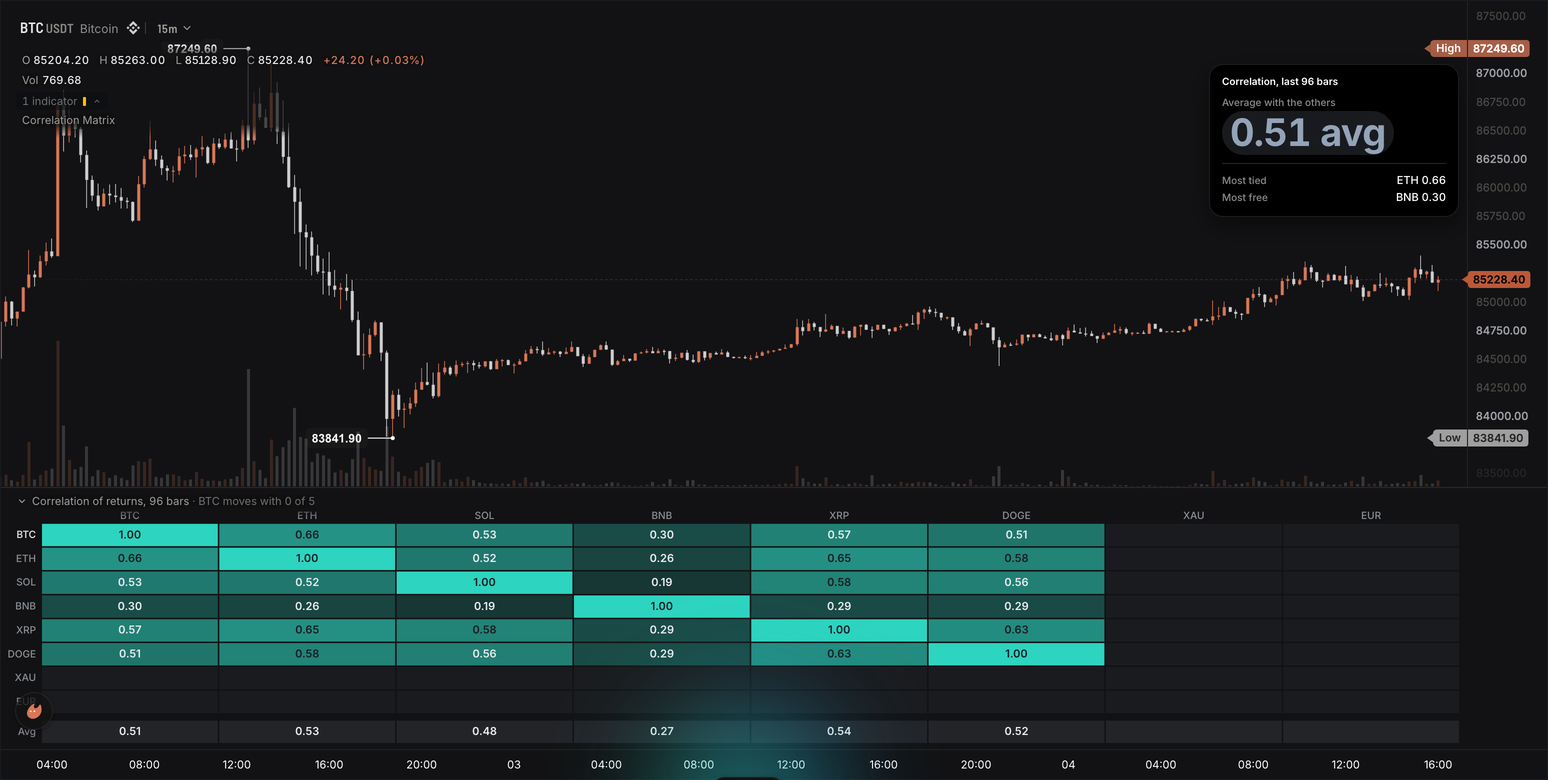
One row and one column per market, the chart's own market first on both axes and its row label lit. A teal cell is a pair that moved together over the window, a violet cell a pair that moved apart, a cell in the chart's own surface colour no relation; every cell prints its correlation with two decimals and opens a hover card ("Market BTC · vs ETH"). An empty cell is a pair that shared too few bars in the window (a coin listed after the window began, or a market whose candles the chart's bars cannot join); its row and column keep their names. An Avg row under the grid gives every market its average with the others. The pane's legend reads the title and a count, "Correlation of returns, 96 bars · BTC moves with 0 of 7": how many markets moved with the chart's market at or above the strong setting, counted over the markets that could be measured. A card at the top right, under the chart's High tag, in the signal look (black paper with a thin border and a large headline, a look that keeps its paper on a light chart), reads the chart market's average correlation with the others as the headline (teal at or above strong, slate between, violet below zero), then the market it is most tied to and the one it is most free of, each with its reading. When the chart is one of the eight markets (a Binance Futures BTC or ETH perpetual chart), that row carries the market's name and the grid is 8 by 8; on any other crypto market the first row is named "Chart" and the grid is 9 by 9. Correlation is written for crypto charts: on a chart whose candles carry no volume (forex, gold, silver) it draws no grid, the card's headline reads "Not crypto", and one sentence under the card names the way out.
The parts are ten inputs over nine sources, the chart's own ohlcv.close first and its ohlcv.volume from the same candles, then eight ohlcv.close inputs pinned by exchange and symbol to Binance Futures perpetuals with missing: "nan" (Data sources, Multi-source and aggregation), a frame feeding panel.heatmap on category axes with a palette scale, a highlight row, a caption and a summary row (Cards, frames and panels), a render.hud card of a headline tile.pill and a tile.rows in the signal look (HUD cards), and a label handle for the one sentence that stands in for the grid while the window loads or on a chart that is not crypto (Drawing objects). This is also the correlation-matrix template: the Correlation Matrix card under Beyond the time axis in the editor's starter list, and it compiles as written.
The wrun indicator
// Correlation Matrix: how this chart's market moved with eight crypto perpetuals over the last 'window' bars (the
// Binance Futures BTC, ETH, SOL, BNB, XRP, DOGE, ADA and AVAX perpetuals), as a market by market heatmap below the
// chart. Teal cells moved together, violet cells moved apart, the surface colour is no relation, and an empty cell is
// a pair with too few shared bars in the window (a coin listed after the window began, or one whose candles the
// chart's bars cannot join); its row keeps its name. The chart's own market is the first row and column; when it is
// one of the eight, that row carries the market's name and the grid is 8 by 8. The card reads the chart market's
// average correlation with the others, the market it is most tied to and the one it is most free of; the panel's
// legend counts how many moved with it above the 'strong' setting, and an Avg row under the grid gives every market
// the same reading. The trader sees in one glance whether the market is trading on its own or as one of the crowd,
// and which market to watch as a lead or a hedge. Correlation is written for crypto charts: on a chart whose candles
// carry no volume (forex, gold, silver) it says so in one sentence with the way out, and draws no grid.

section("Window");
param.int("window", 96, { min: 30, max: 500, label: "Window in bars", description: "Bars in the correlation window" });
param.number("strong", 0.7, { min: 0.3, max: 0.95, step: 0.05, label: "Strong correlation", description: "Correlation at or above which two markets count as moving together" });

// Inputs: the chart's own close is the grid and the first row, its volume tells a crypto chart from a quote-only
// one (forex, gold and silver candles carry none; the same candles, so no extra source); the eight pins join by
// timestamp and read NaN on a bar their market has no candle for, so a missing candle never fabricates a return.
input("close", ohlcv.close, { description: "This chart's close: the first row and column of the grid" });
input("volume", ohlcv.volume, { description: "This chart's volume: candles that never carry any (forex, gold, silver) mark a chart that is not crypto" });
input("btc", ohlcv.close, { exchange: "BINANCE_FUTURES", symbol: "BTCUSDT", missing: "nan", description: "Bitcoin, Binance Futures perpetual" });
input("eth", ohlcv.close, { exchange: "BINANCE_FUTURES", symbol: "ETHUSDT", missing: "nan", description: "Ether, Binance Futures perpetual" });
input("sol", ohlcv.close, { exchange: "BINANCE_FUTURES", symbol: "SOLUSDT", missing: "nan", description: "Solana, Binance Futures perpetual" });
input("bnb", ohlcv.close, { exchange: "BINANCE_FUTURES", symbol: "BNBUSDT", missing: "nan", description: "BNB, Binance Futures perpetual" });
input("xrp", ohlcv.close, { exchange: "BINANCE_FUTURES", symbol: "XRPUSDT", missing: "nan", description: "XRP, Binance Futures perpetual" });
input("doge", ohlcv.close, { exchange: "BINANCE_FUTURES", symbol: "DOGEUSDT", missing: "nan", description: "Dogecoin, Binance Futures perpetual" });
input("ada", ohlcv.close, { exchange: "BINANCE_FUTURES", symbol: "ADAUSDT", missing: "nan", description: "Cardano, Binance Futures perpetual" });
input("avax", ohlcv.close, { exchange: "BINANCE_FUTURES", symbol: "AVAXUSDT", missing: "nan", description: "Avalanche, Binance Futures perpetual" });

// Outputs are data-only, written on the live bar: the card, the Console and a watch read the same numbers.
output("avg_corr", none, overlay, { format: "0.00", description: "The chart market's average correlation with the other markets in the grid" });
output("tone", none, overlay, { description: "0 moving apart, 1 loosely related, 2 moving together, NaN with no reading: the headline's colour" });
output("strong_count", none, overlay, { description: "How many of the other markets correlate with the chart's market at or above 'strong'" });
output("served_count", none, overlay, { description: "How many of the other markets had enough bars in the window to be measured" });
output("bars", none, overlay, { format: "int", description: "The window in bars, read by the card's title" });
string("avg_text", { max_bytes: 24 }); // "0.62 avg"
string("tied_text", { max_bytes: 24 }); // "ETH 0.91"
string("free_text", { max_bytes: 24 }); // "AVAX 0.12"
string("note", { max_bytes: 80 }); // the one sentence: the window still loading, or a chart that is not crypto

// The one sentence: a slate knockout label at the top right of the price pane, under the card.
handles.label({ text: "note", anchor: "top_right", align: "right", color: "#94a3b8", size: 11, style: "knockout", padding: 6, safe_area: true });
const note = draw.label(0);
const NOTE_Y: f64 = 200.0; // pixels down from the top-right corner: under the card, which ends about 172 px down

// The grid: one cell per market pair, violet at -1 through the chart surface at 0 to teal at +1, every cell printed
// with two decimals, a hover card per cell, the chart's own row lit in the row labels.
const grid = frame("grid", { max_bytes: 8192 });
panel.heatmap({ name: "corr_grid", title: "Correlation of returns", x: "category", place: "below", frame: grid, scale: "palette", palette: ["#a78bfa", "theme.bg", "#2dd4bf"], min: -1, max: 1, row_title: "Market", col_title: "vs", format: "0.00", hover_card: true, height_frac: 0.35 });

// The card, in the signal look, below the chart's own High tag: the window in the title, the average correlation as the headline (violet apart,
// slate loose, teal together; slate words when there is no reading), then the most tied and the most free market
// with their readings. The headline is a big number: its words stay short enough to fit the card.
render.hud("card", { position: "top_right", look: "signal", title: "Correlation, last {{bars:int}} bars", columns: 1, width: 250, offset: [0, 24], safe_area: true, tiles: [
  tile.pill("Average with the others", "avg_text", { headline: true, color_by: "tone", colors: ["#a78bfa", "#94a3b8", "#2dd4bf"], color: "#94a3b8" }),
  tile.rows([["Most tied", "tied_text"], ["Most free", "free_text"]]),
] });

const SERIES = 9; // the chart's market plus the eight pins
const MAX_WINDOW = 500; const MAX_RING = MAX_WINDOW + 1; // 'window' returns need 'window' + 1 closes
const NAMES: StaticArray<string> = ["Chart", "BTC", "ETH", "SOL", "BNB", "XRP", "DOGE", "ADA", "AVAX"];
const closes = new StaticArray<f64>(SERIES * MAX_RING); // the ring of closes, one row per series
const rets = new StaticArray<f64>(SERIES * MAX_WINDOW); // the window's log returns per series, oldest first
const corr = new StaticArray<f64>(SERIES * SERIES); // the live grid, NaN where a pair has too few bars
const order = new StaticArray<i32>(SERIES); // the series behind each grid row: the chart first, then the pins
const colAvg = new StaticArray<f64>(SERIES); // each column's average with the other markets (the Avg row)
let window = 96; let strong = 0.7; let ring = 97; let minPairs = 48; // the params, read in onStart()
let head = -1; let count = 0; // the ring: head is the newest slot, count the slots in use
let rows = SERIES; let chartName = "Chart"; // the grid's size and the chart row's name this run
let volumeSeen = false; // a bar of the chart carried volume: every crypto market trades some, quote-only candles never do

function readSeries(s: i32): f64 {
  switch (s) {
    case 1: return in_btc(); case 2: return in_eth(); case 3: return in_sol(); case 4: return in_bnb();
    case 5: return in_xrp(); case 6: return in_doge(); case 7: return in_ada(); case 8: return in_avax();
    default: return bar.close();
  }
}
function slotAt(k: i32, used: i32): i32 { return (head - used + 1 + k + MAX_RING) % MAX_RING; } // the k-th oldest of 'used' slots
function sameClose(a: f64, b: f64): bool { return Math.abs(a - b) <= 1e-9 * Math.max(1.0, Math.abs(a)); }
// At or above 'strong' as the cells print it, two decimals: a 0.6955 cell reads 0.70 and counts at 0.70.
function isStrong(r: f64): bool { return Math.round(r * 100.0) >= Math.round(strong * 100.0); }

// The pin that is this chart's own market, if any: its closes equal the chart's on every bar both have (the forming
// bar may lag by a tick, so one mismatch is allowed). That row is dropped and the chart row takes its name.
function duplicatePin(used: i32): i32 {
  for (let p = 1; p < SERIES; p += 1) {
    let present = 0; let equal = 0;
    for (let k = 0; k < used; k += 1) {
      const slot = slotAt(k, used); const a = closes[slot]; const b = closes[p * MAX_RING + slot];
      if (isNaN(a) || isNaN(b)) continue;
      present += 1; if (sameClose(a, b)) equal += 1;
    }
    if (present >= 2 && equal >= present - 1) return p;
  }
  return 0;
}
// Log returns of every series over the window, NaN where either close is missing.
function buildReturns(used: i32): i32 {
  const n = used - 1;
  for (let s = 0; s < SERIES; s += 1) {
    for (let k = 0; k < n; k += 1) {
      const a = closes[s * MAX_RING + slotAt(k, used)]; const b = closes[s * MAX_RING + slotAt(k + 1, used)];
      rets[s * MAX_WINDOW + k] = a > 0.0 && b > 0.0 ? Math.log(b / a) : NaN;
    }
  }
  return n;
}
// Pearson correlation of two series over the bars both have; NaN under 'minPairs' bars or a flat series.
function pearson(a: i32, b: i32, n: i32): f64 {
  let m = 0; let sx = 0.0; let sy = 0.0; let sxx = 0.0; let syy = 0.0; let sxy = 0.0;
  for (let k = 0; k < n; k += 1) {
    const x = rets[a * MAX_WINDOW + k]; const y = rets[b * MAX_WINDOW + k];
    if (isNaN(x) || isNaN(y)) continue;
    m += 1; sx += x; sy += y; sxx += x * x; syy += y * y; sxy += x * y;
  }
  if (m < minPairs) return NaN;
  const vx = sxx - (sx * sx) / f64(m); const vy = syy - (sy * sy) / f64(m);
  if (!(vx > 0.0) || !(vy > 0.0)) return NaN;
  const r = (sxy - (sx * sy) / f64(m)) / Math.sqrt(vx * vy);
  return r > 1.0 ? 1.0 : r < -1.0 ? -1.0 : r;
}
function buildGrid(n: i32): void {
  for (let i = 0; i < rows; i += 1) {
    for (let j = i; j < rows; j += 1) {
      const r = pearson(order[i], order[j], n);
      corr[i * SERIES + j] = r; corr[j * SERIES + i] = r;
    }
  }
  for (let j = 0; j < rows; j += 1) { // the Avg row: each column against the other markets
    let sum = 0.0; let m = 0;
    for (let i = 0; i < rows; i += 1) { if (i == j) continue; const r = corr[i * SERIES + j]; if (isNaN(r)) continue; sum += r; m += 1; }
    colAvg[j] = m > 0 ? sum / f64(m) : NaN;
  }
}
function writeGrid(strongCount: i32, served: i32): void { // [column market, row market, correlation] per cell, null where unmeasured
  fb_clear();
  fb_text("{\"title\":\"Correlation of returns, "); fb_int(<i64>window); fb_text(" bars\",\"caption\":\"");
  fb_text(chartName); fb_text(" moves with "); fb_int(<i64>strongCount); fb_text(" of "); fb_int(<i64>served);
  fb_text("\",\"highlight\":{\"row\":"); fb_str(chartName); fb_text("},\"rows\":[");
  for (let i = 0; i < rows; i += 1) {
    for (let j = 0; j < rows; j += 1) {
      if (i > 0 || j > 0) fb_text(",");
      fb_text("["); fb_str(order[j] == 0 ? chartName : NAMES[order[j]]); fb_text(","); fb_str(order[i] == 0 ? chartName : NAMES[order[i]]); fb_text(",");
      fb_f64(corr[i * SERIES + j], 2); fb_text("]");
    }
  }
  fb_text("],\"summary\":[{\"label\":\"Avg\",\"values\":[");
  for (let j = 0; j < rows; j += 1) { if (j > 0) fb_text(","); fb_f64(colAvg[j], 2); }
  fb_text("]}]}");
  writeFrameBuffer(FRAME_GRID);
}
// A state with no grid: the one sentence under the card, and the card's headline for that state with a dash per row.
function sayInstead(sentence: string, headline: string): void {
  sb_clear(); sb_text(sentence); note.set(0.0, NOTE_Y).text(str_note_sb);
  sb_clear(); sb_text(headline); str_avg_text_sb();
  sb_clear(); sb_text("-"); str_tied_text_sb();
  sb_clear(); sb_text("-"); str_free_text_sb();
}

// onStart() runs once before the first bar: read the params and size the ring to the window.
function onStart(): void {
  window = i32(p_window()); strong = p_strong(); ring = window + 1; minPairs = (window + 1) / 2;
}
// onBar() runs once per bar: push every close into the ring and note whether the chart's candles carry volume; on
// the live bar, measure the grid and write the panel, the card's words and the outputs, or the one sentence when
// the chart is not crypto or the window is not full yet.
function onBar(): void {
  head = (head + 1) % MAX_RING; if (count < ring) count += 1;
  for (let s = 0; s < SERIES; s += 1) closes[s * MAX_RING + head] = readSeries(s);
  if (in_volume() > 0.0) volumeSeen = true;
  if (!bar.isLast()) return;
  out_bars(f64(window));
  if (!volumeSeen) { // no candle carried volume: a forex, gold or silver chart, so no grid
    sayInstead("Correlation is written for crypto charts: switch to a BTC or ETH perp", "Not crypto");
    return;
  }
  if (count < window) { // fewer bars than the window: no grid yet
    sayInstead("Loading more history for the correlation window", "Loading");
    return;
  }
  note.delete();
  const used = count < ring ? count : ring;
  const dup = duplicatePin(used);
  chartName = dup > 0 ? NAMES[dup] : "Chart";
  rows = 0; order[rows] = 0; rows += 1;
  for (let p = 1; p < SERIES; p += 1) if (p != dup) { order[rows] = p; rows += 1; }
  buildGrid(buildReturns(used));
  // The chart's row: its average with the others, the most tied and most free markets, the count above 'strong'.
  let sum = 0.0; let served = 0; let strongCount = 0; let tied = -1; let free = -1;
  for (let j = 1; j < rows; j += 1) {
    const r = corr[j]; if (isNaN(r)) continue;
    sum += r; served += 1; if (isStrong(r)) strongCount += 1;
    if (tied < 0 || r > corr[tied]) tied = j;
    if (free < 0 || r < corr[free]) free = j;
  }
  const avg = served > 0 ? sum / f64(served) : NaN;
  out_avg_corr(avg); out_strong_count(f64(strongCount)); out_served_count(f64(served));
  out_tone(isNaN(avg) ? NaN : avg < 0.0 ? 0.0 : isStrong(avg) ? 2.0 : 1.0);
  sb_clear(); if (served > 0) { sb_f64(avg, 2); sb_text(" avg"); } else sb_text("No pairs"); str_avg_text_sb();
  sb_clear(); if (tied >= 0) { sb_text(NAMES[order[tied]]); sb_text(" "); sb_f64(corr[tied], 2); } else sb_text("-"); str_tied_text_sb();
  sb_clear(); if (free >= 0) { sb_text(NAMES[order[free]]); sb_text(" "); sb_f64(corr[free], 2); } else sb_text("-"); str_free_text_sb();
  writeGrid(strongCount, served);
}How it works
Nine closes ride one grid. input("close", ohlcv.close) is the chart's own close: the grid every other input is joined onto, and the first row and column. input("volume", ohlcv.volume) reads the volume of the same candles, so it adds no source; it only tells a crypto chart from a quote-only one (below). The eight pins (btc, eth, sol, bnb, xrp, doge, ada and avax, every one on BINANCE_FUTURES) are joined by timestamp at the chart's interval and read NaN on a bar their market has no candle for, by missing: "nan", so a missing candle never fabricates a return. ADAUSDT and AVAXUSDT replaced the gold and euro pins on FX_OTC, so every pinned market is served wherever crypto is. Every bar pushes all nine closes into a ring sized at load for the largest window (MAX_WINDOW 500, plus one close: window returns need window + 1 closes).
The grid is measured on the live bar. onBar() returns after the push and the volume check until bar.isLast(). On the live bar it writes bars, then stops at either state that draws no grid (below). Past them, buildReturns() turns the last window + 1 closes of every series into per-bar log returns (NaN where either close is missing), and pearson() measures each pair over the bars both markets have: fewer than (window + 1) / 2 shared bars, or a flat series, reads NaN, an empty cell, and the rest is clamped to [-1, 1]. buildGrid() fills the pairs and the Avg row, each column's average with the other markets. The chart's row gives the card its numbers: the average over the served markets, the most tied and the most free, and the count at or above strong. isStrong() compares the correlation as the cells print it, rounded to two decimals, so a 0.6955 cell that reads 0.70 counts at a strong of 0.70, and the headline's teal follows the printed average the same way.
A duplicate pin folds into the chart row. duplicatePin() looks for a pin whose closes equal the chart's on every bar both have (one mismatch allowed, since the forming bar may lag by a tick). That pin's row is dropped and the chart row takes its name, so a Binance Futures BTC chart reads an 8 by 8 grid with "BTC" first, and a Binance spot ETH chart reads 9 by 9 with "Chart" first and the ETH perpetual at 1.00.
One frame is the grid. writeGrid() builds frame("grid") through the fb_* builder and sends it with writeFrameBuffer(FRAME_GRID): a title ("Correlation of returns, 96 bars"), a caption ("BTC moves with 0 of 7"), a highlight on the chart's row, one [column market, row market, correlation] row per cell with null where a pair is unmeasured, and one summary row, "Avg". panel.heatmap reads it below the chart on category axes: scale: "palette" with palette: ["#a78bfa", "theme.bg", "#2dd4bf"] between min: -1 and max: 1 paints violet at -1, the chart's surface at 0 and teal at +1, with fixed bounds; format: "0.00" prints every cell; row_title: "Market" and col_title: "vs" word the hover card; height_frac: 0.35 is the pane's share of the chart. The caption prints on the pane's legend after the title.
The card reads slots and outputs. avg_corr, tone, strong_count, served_count and bars are data-only outputs (none) written on the live bar (bars in every state, the other four once the grid is measured), so the card, the Console and a watch read the same numbers. The words are string slots built with sb_* on the same bar (Strings and text): avg_text ("0.49 avg"), tied_text ("ETH 0.69") and free_text ("AVAX 0.31"). render.hud("card", ...) at top_right in the signal look: title: "Correlation, last {{bars:int}} bars" reads the bars output into the title, the headline tile.pill prints avg_text coloured by the tone ladder (0 violet, moving apart; 1 slate, loosely related; 2 teal, at or above strong), and tile.rows lists Most tied and Most free. The pill also declares color: "#94a3b8", the ladder's fallback where tone is not finite, so with no reading the words print in slate while tone stays NaN for a watch. The signal look sets the headline at 38 px, so the words of a state with no reading stay short enough for the 250 px card: "Not crypto", "Loading", "No pairs". offset: [0, 24] drops the card under the chart's High tag, safe_area: true keeps it clear of the price-axis tags, and columns: 1 with width: 250 keeps it narrow.
Volume tells a crypto chart. Every crypto market trades some volume, while forex, gold and silver candles are quotes that carry none, so any bar whose in_volume() is above 0 marks the chart as crypto (volumeSeen). On the live bar this check comes first: a chart where no bar carried volume gets no grid. writeGrid() never runs, so the frame stays unwritten and the pane is absent (no empty pane), and the card and the sentence say why (below). Volume, not the bar clock: reading bar.time() would add a time source, a tenth, and the chart counts an indicator against your plan's per-chart indicator limit once per distinct source it reads, while the chart's volume rides the candles its close already reads (How many sources you can open).
One sentence instead of a grid. handles.label({ text: "note", anchor: "top_right", style: "knockout", color: "#94a3b8", safe_area: true, ... }) declares one label kind pinned to the top right of the price pane, and draw.label(0) is its one handle. sayInstead(sentence, headline) writes a state with no grid: the sentence into the note slot, placed by note.set(0.0, NOTE_Y).text(str_note_sb) at NOTE_Y (200.0 pixels down from the top-right corner, under the card, which ends about 172 px down), the headline into avg_text, and a dash into tied_text and free_text. A chart that is not crypto gets "Correlation is written for crypto charts: switch to a BTC or ETH perp" with the headline "Not crypto"; while fewer bars than window are loaded, it gets "Loading more history for the correlation window" with "Loading". Once the grid is measured, note.delete() removes the sentence.
Where it runs
Crypto charts at any interval, spot and perpetual, on any venue: the eight pins are Binance Futures perpetuals, served wherever crypto is, and they join the chart's bars by timestamp at its interval. A Binance Futures BTC chart reads an 8 by 8 grid with BTC first; a Binance spot ETH chart reads 9 by 9 with "Chart" first and the ETH perpetual at 1.00. A forex, gold or silver chart carries no volume, so it gets the "Not crypto" card and the sentence instead of a grid (below). A US stock or CME chart carries volume, so the grid runs over its session bars, and a pin whose candles cannot join them stays an empty row with its name. The chart's own round button at the bottom left sits over the last row's label in the panel's gutter (the AVAX row); the hover card still names the row.
When data is missing
With fewer bars loaded than window, the chart draws no grid yet: the card's headline reads "Loading" in slate with a dash on each row (a HUD card is never hidden per run), and one sentence sits under the card, "Loading more history for the correlation window". Once the window is full the sentence goes and the grid draws. On a chart whose candles carry no volume (forex, gold, silver) no grid is drawn at all: the frame stays unwritten, so the panel is absent (no empty pane), the headline reads "Not crypto" in slate with a dash on each row, and one slate sentence sits under the card, "Correlation is written for crypto charts: switch to a BTC or ETH perp". A market the chart's bars cannot join over the window (a coin listed after the window began, or a pin whose candles miss the chart's bar times) keeps its row and column with their names and empty cells, and the legend's "N of M" counts only the markets that could be measured. A pair with fewer than half the window in shared bars, or a flat series, is an empty cell; when no market can be measured against the chart's own, the headline reads "No pairs" and the Most tied and Most free rows print a dash. missing: "nan" fills the bars a served market has no candle for; a pinned market the chart does not serve at all is another case. Today the chart stops the whole run when a pin is declined or answers empty, with a message that the pinned market's candle data is unavailable, whatever missing says. The eight pins are served wherever crypto is, so this reaches only a pin swapped to a market the chart does not serve.
Customize it
- A longer window.
window(96 bars, from 30 to 500) is how many bars the returns are measured over; a pair needs at least half of it in shared bars, the grid waits until that many bars are loaded, and the card's title and the pane's legend read the new count. - A stricter "moves with".
strong(0.7, from 0.3 to 0.95 in steps of 0.05) is the correlation at or above which a market counts in the legend's count and the headline turns teal, compared at the two decimals the cells print. - Other markets. A pin is one input line and one name: edit the line's
exchange,symbolanddescriptionto another crypto market (spellings on Exchange and symbol format), and its name at the same place inNAMES, the list the grid's rows and the card's words print ("Chart" first, then the pins in the orderreadSeries()reads them). Keepmissing: "nan"so a missing candle never fabricates a return, and pick a market the chart serves: a pin it declines stops the run today (above). - A taller pane.
height_frac: 0.35is the pane's share of the chart (0.05 to 0.9); raise it when a 9 by 9 grid crowds the row labels on a short chart. - Change the look. This source writes
look: "signal"as a literal, so the Look row on the indicator's Style page switches the card between the twelve looks without code, "As made" first (The Style page). Writelook: "@name"over aparam.choiceof looks and the look becomes a setting, its row the look's one control in place of the Look row (Looks). The grid's inks are literals too, and every colour word of a panel declaration, apaletteentry included, may name aparam.coloras "@name" (Panel words):palette: ["@apart", "theme.bg", "@together"]beside twoparam.colorsettings puts violet and teal on the Style page. The pill's ladder and the sentence's slate stay literals, since a tile and ahandles.*default take no setting.
Run it
- In the editor's Explorer, press the Templates icon ("Browse starter templates") and pick Correlation Matrix under Beyond the time axis.
- Press Run on BTCUSDT on Binance Futures at 15m: the grid fills the pane below the chart with BTC first, the pane's legend counts the markets that moved with it, and the signal card appears at the top right under the High tag. Rest the pointer on a cell to read its pair.
- At the editor's Console prompt, type
outputsto read the newest value of every output: the average, its tone, the strong and served counts and the window. Every output is written on the live bar, so the newest row is the whole story.
Concepts used
- Data sources for
ohlcv.close,ohlcv.volume, themissing: "nan"policy and how the chart counts sources - Multi-source and aggregation for pinning another market by
exchangeandsymbol - Cards, frames and panels for frames, the
fb_*builder,panel.heatmap, its palette scale,caption,highlightandsummary, and the panel colour words aparam.colorcan drive - HUD cards for
render.hud,offsetandsafe_area - Looks for
look: "signal", what it draws, and a look bound to aparam.choice - Blocks and tiles for the headline
tile.pill, its ladder with its fallbackcolor, andtile.rows - The Style page for the Look row that switches the look without code
- Drawing objects for
handles.label, the knockout style and thedraw.labelhandle - Strings and text for the
sb_*builders and the string slots