Session OI Levels
Where open interest was built and unwound in each day, as a profile anchored to the day's own time span.
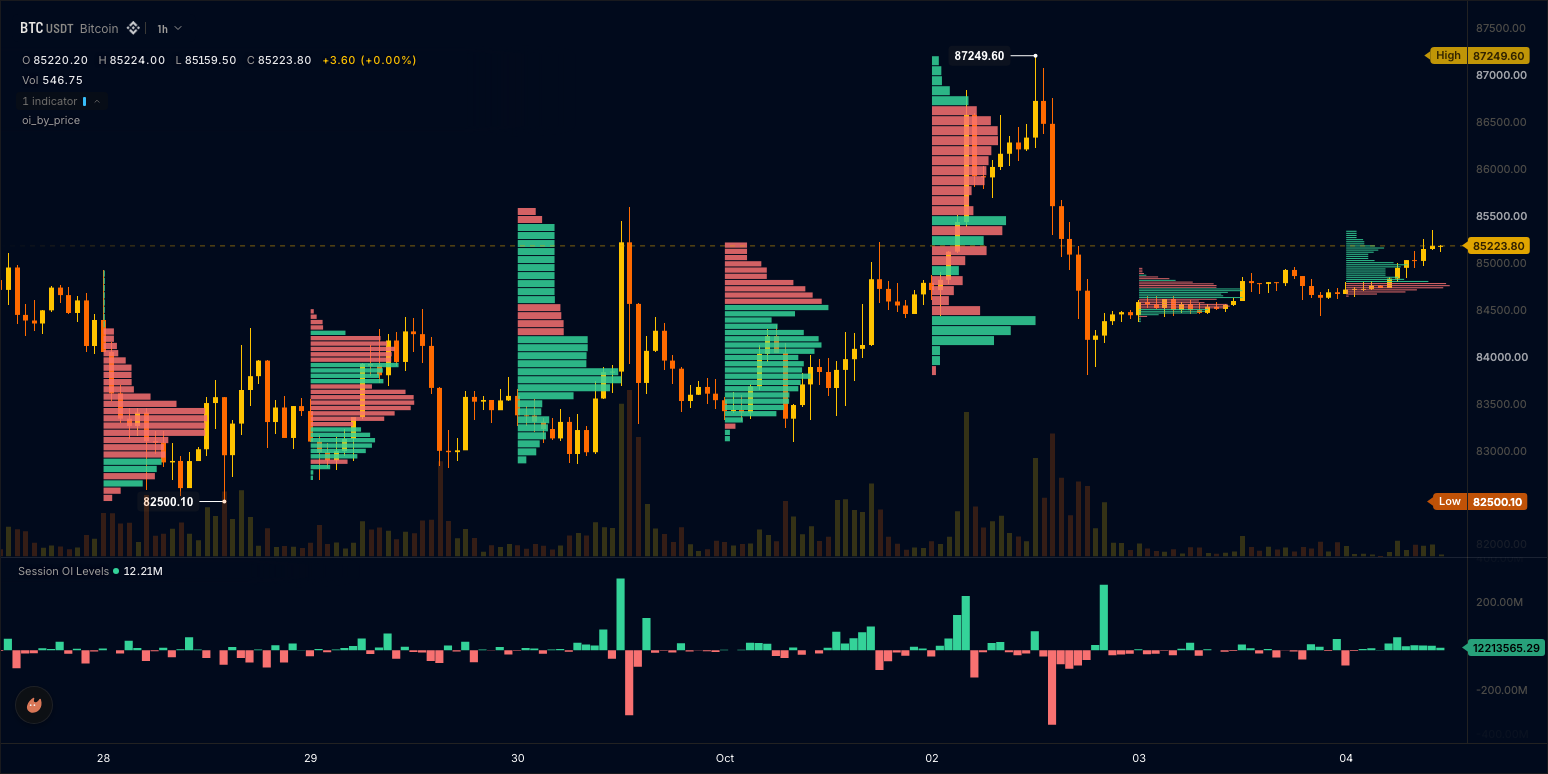
Each bar's change in open interest is spread over the price rows its range covered, so a row grows where positions were opened or closed while price traded there: green where they were opened on balance, red where they were closed, slate where nothing moved. Every day gets its own profile, its rows scaled to that day's biggest and drawn from the day's first bar, and hovering a row reads the open interest moved there. Under the chart, the bar's open-interest change as a histogram. The trader sees the prices the positioning was decided at, day by day.
The parts are an oi.close feed input beside the chart's candles (Data sources), a frame of time spans feeding plot.levels with span: "time" (Drawing primitives), one histogram output under the chart (Plotting), and a label handle for the one sentence shown on a market without open interest (Drawing objects). This is also the session-oi-levels template: the Session OI Levels card under On price in the editor's starter list, and it compiles as written.
The wrun indicator
// Session OI Levels: where open interest was built and unwound in each day, as a profile anchored to the day's own
// time span. Each bar's change in open interest is spread over the price rows its range covered, so a row grows where
// positions were opened (green) or closed (red) while price traded there; every day gets its own profile, its rows
// scaled to that day's biggest row and drawn by the chart from the day's first bar. The bar's open-interest change
// rides along as a histogram under the chart.

section("Sessions"); // the dialog's one section
param.int("sessions", 10, { min: 2, max: 30, label: "Days shown", description: "Days drawn, the newest last" });
param.int("rows", 32, { min: 8, max: 64, label: "Rows per day", description: "Price rows per day" });
input("close", ohlcv.close); // the primary input: the chart's own candles define the grid
input("oi", oi.close, { missing: "nan" }); // open interest at the bar's close; a bar without a reading, or a market without open interest, reads NaN
output("oi_change", histogram, lower, { color_by: "oi_tone", colors: ["#f87171", "#34d399"], description: "Open interest change on the bar" }); // green where positions were opened, red where they were closed
output("oi_tone", none, overlay, { description: "1 while open interest rose on the bar, 0 while it fell" }); // data-only: the histogram's colour index
const oi_spans = frame("oi_spans", { max_bytes: 65536 }); // one span per day: its start and end, a price per row, the open interest moved on the row, a colour per row
plot.levels({ name: "oi_by_price", frame: oi_spans, dock: "left", span: "time", width_frac: 0.5, labels: false, color: "#38bdf8", opacity: 0.85, format: "si", hover: true }); // each day's profile grows from the day's first bar; hover a row for the open interest moved there
string("note", { max_bytes: 40 }); // the one sentence shown when the market has no open interest
handles.label({ anchor: "top_right", align: "right", color: "#94a3b8", size: 12, style: "plain", safe_area: true }); // that sentence: plain slate words at the pane's top right, clear of the chart's buttons

const MAX_BARS = 8192; const MAX_ROWS = 64; const MAX_DAYS = 30; // the bar ring (8192 bars is 28 days of 5m bars) and the finished days kept, for the largest settings
const barT = new StaticArray<f64>(MAX_BARS); const barLo = new StaticArray<f64>(MAX_BARS); const barHi = new StaticArray<f64>(MAX_BARS); const barOi = new StaticArray<f64>(MAX_BARS); // each ring bar's open time, price span and open-interest change
const dayStart = new StaticArray<f64>(MAX_DAYS + 1); const dayLo = new StaticArray<f64>(MAX_DAYS + 1); const dayStep = new StaticArray<f64>(MAX_DAYS + 1); // each folded day's span start (NaN: it draws nothing), bottom and row height; slot MAX_DAYS is the open day
const dayNet = new StaticArray<f64>((MAX_DAYS + 1) * MAX_ROWS); const dayMoved = new StaticArray<f64>((MAX_DAYS + 1) * MAX_ROWS); // per day and row: the net open-interest change, and the open interest moved, built or unwound
const note = draw.label(0); // the one slate sentence; a handle allocates once at module load
let sessions = 10; let rows = 32; // the params, read in onStart()
let seq = -1; let openSeq = 0; let openDay: i64 = -1; let doneHead = -1; let doneCount = 0; // the bars counted (bar s sits in ring slot s % MAX_BARS), the open day and its first bar, the finished days' ring: its newest slot and the days in it
let prevOi: f64 = NaN; // the last open-interest reading
let t: f64 = NaN; // this bar's open time

function dayOf(time: f64): i64 { return i64(Math.floor(time / 86400.0)); } // the UTC day number of an open time
function priceDecimals(step: f64): i32 { // enough decimals that the rounded row prices stay evenly spaced (the docked grid is contiguous only within 0.1% of its step)
  const d = i32(Math.ceil(Math.log(2000.0 / step) / Math.LN10)); return d < 2 ? 2 : d > 9 ? 9 : d;
}

// ── One day's profile: its bars folded into `rows` price rows across the day's span, kept in a day slot ──
function spread(a: f64, b: f64, amount: f64, gridLo: f64, width: f64, base: i32): void { // [a, b]'s open-interest change over the rows it overlaps, in proportion
  let first = i32(Math.floor((a - gridLo) / width)); let last = i32(Math.floor((b - gridLo) / width));
  if (first < 0) first = 0; if (last > rows - 1) last = rows - 1; if (first > rows - 1) first = rows - 1; if (last < 0) last = 0;
  if (first >= last || b - a <= 0.0) { dayNet[base + first] += amount; dayMoved[base + first] += Math.abs(amount); return; } // one row, or a bar thinner than the grid
  for (let k = first; k <= last; k += 1) {
    const cellLo = gridLo + f64(k) * width; const cellHi = cellLo + width;
    const overlap = Math.min(b, cellHi) - Math.max(a, cellLo);
    if (overlap > 0.0) { const share = (amount * overlap) / (b - a); dayNet[base + k] += share; dayMoved[base + k] += Math.abs(share); }
  }
}
function foldDay(from: i32, to: i32, slot: i32): void { // the bars from..to (counted, oldest first) are one day: its rows into day slot `slot`
  if (to - from >= MAX_BARS) from = to - MAX_BARS + 1; // bars older than the ring are gone
  let lo = Infinity; let hi = -Infinity;
  for (let s = from; s <= to; s += 1) { const i = s % MAX_BARS; if (barLo[i] < lo) lo = barLo[i]; if (barHi[i] > hi) hi = barHi[i]; }
  dayStart[slot] = NaN;
  if (!(hi > lo)) return; // a day with no price span
  const rowHeight = (hi - lo) / f64(rows); const base = slot * MAX_ROWS;
  for (let r = 0; r < rows; r += 1) { dayNet[base + r] = 0.0; dayMoved[base + r] = 0.0; }
  let moved = 0.0;
  for (let s = from; s <= to; s += 1) {
    const i = s % MAX_BARS; const change = barOi[i];
    if (isNaN(change) || change == 0.0) continue;
    spread(barLo[i], barHi[i], change, lo, rowHeight, base); moved += Math.abs(change);
  }
  if (moved <= 0.0) return; // a day with no open-interest change
  dayStart[slot] = f64(dayOf(barT[from % MAX_BARS])) * 86400.0; dayLo[slot] = lo; dayStep[slot] = rowHeight; // the span: the UTC day the bars belong to, in epoch seconds
}
function writeDay(slot: i32, first: bool): bool { // one folded day appended to the frame as a span; false when the day draws nothing
  const start = dayStart[slot]; if (isNaN(start)) return false;
  const lo = dayLo[slot]; const rowHeight = dayStep[slot]; const base = slot * MAX_ROWS; const decimals = priceDecimals(rowHeight);
  if (!first) fb_text(",");
  fb_text("{\"start\":"); fb_num(start); fb_text(",\"end\":"); fb_num(start + 86400.0);
  fb_text(",\"prices\":["); // row centres, strictly increasing
  for (let r = 0; r < rows; r += 1) { if (r > 0) fb_text(","); fb_f64(lo + (f64(r) + 0.5) * rowHeight, decimals); }
  fb_text("],\"values\":["); // the open interest moved on the row (0 where nothing moved, so the grid stays whole)
  for (let r = 0; r < rows; r += 1) { if (r > 0) fb_text(","); fb_f64(dayMoved[base + r], 0); }
  fb_text("],\"colors\":["); // green where positions were opened on balance, red where they were closed, slate where nothing moved
  for (let r = 0; r < rows; r += 1) { if (r > 0) fb_text(","); const net = dayNet[base + r]; fb_text(net > 0.0 ? "\"#34d399\"" : net < 0.0 ? "\"#f87171\"" : "\"#64748b\""); }
  fb_text("]}");
  return true;
}
function writeSpans(): void { // the newest `sessions` days, oldest first, as one spans frame: the finished days as folded when they ended, the open day folded now
  foldDay(openSeq, seq, MAX_DAYS); // only the open day changes on a new bar or a live tick, so it is the one day folded again
  fb_clear(); fb_text("{\"spans\":[");
  let written = 0; const kept = doneCount < sessions - 1 ? doneCount : sessions - 1;
  for (let k = kept - 1; k >= 0; k -= 1) if (writeDay((doneHead + MAX_DAYS - k) % MAX_DAYS, written == 0)) written += 1;
  if (writeDay(MAX_DAYS, written == 0)) written += 1;
  fb_text("]}");
  if (written > 0) writeFrameBuffer(oi_spans); // an unwritten frame leaves the profiles absent; an empty spans list would be refused
}

// onStart() runs once before the first bar: read the params.
function onStart(): void { sessions = i32(p_sessions()); rows = i32(p_rows()); }
// onBar() runs once per bar: the bar's open-interest change against the last reading, the bar into the ring, a finished
// day folded once where the UTC day changes, the change as a number on every bar, and the day profiles on the live bar only.
function onBar(): void {
  t = bar.time(); const oiNow = in_oi(); const lo = bar.low(); const hi = bar.high();
  const change = isNaN(oiNow) || isNaN(prevOi) ? NaN : oiNow - prevOi; // unknown until two readings exist
  if (!isNaN(oiNow)) prevOi = oiNow;
  if (bar.isLast() && isNaN(prevOi)) { sb_clear(); sb_text("No open interest on this market"); note.set(16.0, 12.0).text(str_note_sb); } // no reading on any bar (spot, FX): one sentence, not an empty pane
  if (isNaN(t) || !(hi >= lo)) return; // a bar with no span draws nothing and is not counted
  const day = dayOf(t);
  if (day != openDay) { // a new UTC day: the day before is finished, folded once into the finished ring and kept as it ended
    if (openDay >= 0) { doneHead = (doneHead + 1) % MAX_DAYS; if (doneCount < MAX_DAYS) doneCount += 1; foldDay(openSeq, seq, doneHead); }
    openDay = day; openSeq = seq + 1;
  }
  seq += 1; const slot = seq % MAX_BARS; barT[slot] = t; barLo[slot] = lo; barHi[slot] = hi; barOi[slot] = change;
  out_oi_change(change);
  out_oi_tone(isNaN(change) ? NaN : change >= 0.0 ? 1.0 : 0.0);
  if (bar.isLast()) writeSpans();
}How it works
The change, not the level. input("oi", oi.close, { missing: "nan" }) reads open interest at each bar's close; the bar's change is the difference from the last reading (NaN until two readings exist, and on a market without open interest). oi_change is that number as a histogram under the chart, green while open interest rose and red while it fell.
Rows per day. Every bar lands in a ring with its open time, its high and low and its change. Where the UTC day changes, foldDay folds the day that just ended once: it finds the day's price span, splits it into rows (32) rows, and spreads each bar's change over the rows its range overlapped, in proportion; a row keeps the open interest moved on it (built or unwound, always positive: the bar's length) and the net change (its colour), and the folded day waits in a ring of 30 finished days. On the live bar only the open day is folded again, so a live tick costs one day's bars, never every day's. A day with no span or no change is left out.
One span per day. frame("oi_spans") carries { "spans": [{ "start", "end", "prices", "values", "colors" }, ...] }, one entry per day with its bounds in epoch seconds (the newest sessions (10) days: the finished ones as they were folded, then the open day), and feeds plot.levels({ span: "time" }): the chart draws every span's rows from the day's first bar, growing right across width_frac (0.5) of the day's width, each day scaled to its own biggest row. hover: true with format: "si" reads a row's open interest as 1.2M in the hover card. The frame is built with the generated fb_* writer, so the live bar allocates nothing.
Where it runs
Perpetual futures with an open-interest feed: Binance Futures, Hyperliquid and the other venues that serve oi (Data sources lists them). A day is folded from the ring of the newest 8192 bars when it ends, and the ring holds a whole day down to 11-second bars, so a 1m chart shows its sessions days whole, as far back as the chart has loaded, like a 5m one.
When data is missing
Spot, stocks, FX and prediction markets carry no open interest: every bar's change reads NaN, the histogram stays empty and no profile is drawn (nothing moved), and one line of words shows at the top right of the chart, No open interest on this market, in plain slate: the note label handle, written on the live bar while no bar has brought a reading, pinned to the pane's top right corner, right-aligned and safe_area: true, so it clears the chart's own buttons. A bar without a reading keeps the last one, so the next reading's change covers both bars. The first bar of a run has no change.
Customize it
- More days, finer rows.
sessionsup to 30 androwsup to 64 (64 rows across 30 days is 1920 rows, inside the frame's 65536 bytes). - Grow from the right.
dock: "right"grows each day's rows from the day's last bar instead. - Rows with labels.
labels: trueprints each row's value beside it (format: "si"keeps them short);thickness_pxcaps the rows on a coarse grid.
Run it
- In the editor's Explorer, press the Templates icon ("Browse starter templates") and pick Session OI Levels under On price.
- Press Run on a perpetual chart such as BTCUSDT on Binance Futures at 15m: a profile grows inside each of the last ten days and the open-interest change appears under the chart.
- Hover a row for the open interest moved there; at the editor's Console prompt, type
oi_changeto read the newest bar's change.
Concepts used
- Data sources for the
oifeed and themissing: "nan"policy - Drawing primitives for frames,
plot.levelsand thespan: "time"frame shape - Plotting for the histogram output and its colour index