Typed inputs tour
Every kind of setting the dialog can draw but text, on one small channel indicator: an average of a picked price field with percent bands, an offset in a picked unit, a reference close on a picked timeframe, a ratio against a picked market, a floor line and a session filter over picked weekdays.
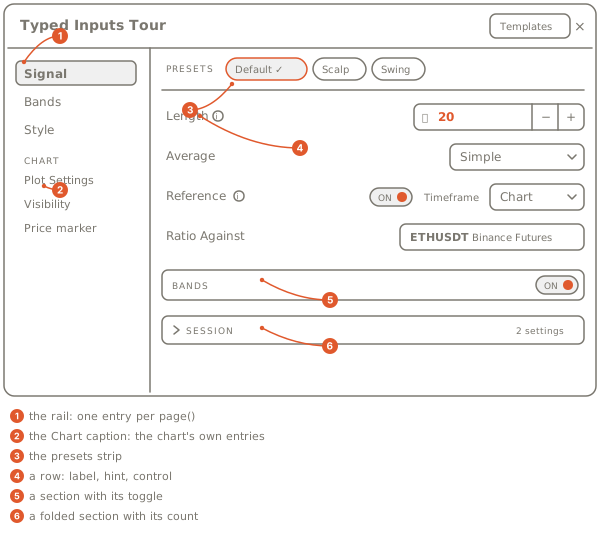
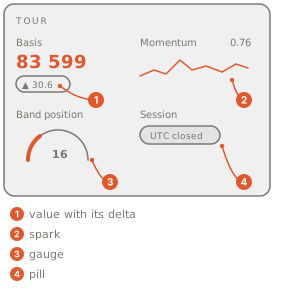
The dialog has two pages, Signal and Bands, a folded section and a section that carries its own toggle, two presets, and a Style page the chart adds by itself. On the chart, the basis line carries a hover card of four block kinds, a two-column HUD card of four tiles sits at the top left under the legend, clear of the newest candles, momentum and the ratio each draw in a pane of their own below the chart, and the legend reads the length setting after the indicator's name with the session's words beside it.
The parts are fourteen of the fifteen setting kinds and the layout words (Setting kinds, Pages, sections, dividers, notes), the "@name" bindings that paint the basis line and pin two inputs, the session and unit helpers inSession and unitToPrice (Sessions and units), the block kit behind the hover card and the HUD (HUD and hover cards), and the Sma, Ema, Atr and Roc helpers (TA library). Every setting is read once in onStart() and kept in a module variable. This is also the typed-inputs-tour template: the Typed inputs tour card under Starters in the editor's starter list, and it compiles as written.
The wrun indicator
// Typed inputs tour: every kind of setting the dialog can draw, on one small channel Indicator. Read the declarations top to bottom, then the two functions.
// Each setting is declared by its kind, so the dialog knows the control to draw; the page, section, divider and note words lay the rows out in this order.

page("Signal"); // the dialog's first page: the rows declared below land on it, in this order
param.int("length", 20, { min: 2, max: 500, label: "Length in bars", hint: "Bars in the average" }); // a whole number: p_length() reads it in onStart()
param.choice("kind", ["Simple", "Exponential"], "Simple", { label: "Average" }); // one of two choices: p_kind() reads the index, 0 for Simple
param.source("src", ohlcv.close, { label: "Source" }); // the price field the average reads, picked in the dialog: in_src() reads it per bar
param.bool("show_reference", true, { label: "Reference", row: "reference", hint: "The close on the timeframe picked beside it" }); // a toggle; rows naming the same row word share one line of the dialog
param.timeframe("htf", "chart", { label: "Timeframe", row: "reference", when: "show_reference" }); // a timeframe pick on that line ("chart" follows the chart until a coarser one is picked), dimmed while the toggle it names is off ...
input("close_htf", ohlcv.close, { interval: "@htf" }); // ... and bound to this input by name: the host fetches the picked timeframe
param.symbol("pair", "BINANCE_FUTURES:ETHUSDT", { label: "Ratio against" }); // a market pick ...
input("close_pair", ohlcv.close, { symbol: "@pair" }); // ... bound to this input the same way
param.list("lookbacks", [5.0, 20.0], { max: 4, label: "Momentum lookbacks in bars" }); // a growable list of numbers, four at most: p_lookbacks() reads the filled slots
param.time("since", "2024-01-01 00:00", { label: "Start", hint: "Earlier bars stay empty" }); // a point in time, pickable on the chart: p_since() reads epoch seconds
param.price("floor", 0.0, { label: "Floor price", hint: "0 draws no floor" }); // a price level, pickable on the chart
section("Session", { collapsed: true }); // a folded section: its header shows the row count
param.session("rth", "09:30-16:00", { tz: "America/New_York", label: "Active hours" }); // a window and its zone: start, end and zone readers
param.multi("days", ["Mon", "Tue", "Wed", "Thu", "Fri", "Sat", "Sun"], ["Mon", "Tue", "Wed", "Thu", "Fri"], { label: "Active days" }); // any number of picks: p_days() reads a bitmask
page("Bands"); // the second page
const showBands = param.bool("show_bands", true, { label: "Show bands" }); // a toggle, bound to a const so the section below can carry it in its header
section("Bands", { toggle: showBands }); // the section's header carries the toggle
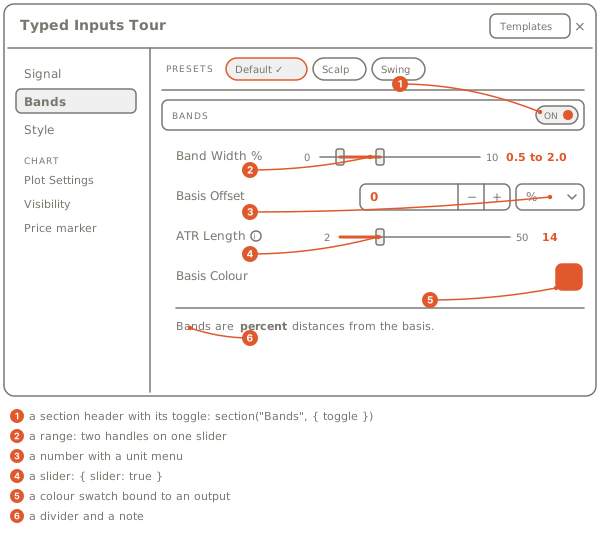
param.range("band_pct", [0.5, 2.0], { min: 0, max: 10, step: 0.1, label: "Band width in percent" }); // a low..high pair on one slider: p_band_pct_lo() and p_band_pct_hi()
param.number("offset", 0.0, { min: -100, max: 100, unit: ["price", "ticks", "%", "atr"], unit_default: "%", label: "Basis offset" }); // a number with a unit picker: p_offset_unit() reads the unit's code
param.int("atr_length", 14, { min: 2, max: 50, slider: true, label: "ATR length", hint: "The ATR an atr-unit offset scales by" }); // a bounded whole number, drawn as a slider
param.color("basis_color", "#2962ff", { label: "Basis colour" }); // a colour, painted onto the basis line below by name
divider(); // a rule between rows
note("Bands are **percent** distances from the basis: the low end below it, the high end above it."); // a line of words between rows
market.tick_size(); // the host writes the market's tick size into a hidden setting: p_market_tick_size() reads it in onStart()
const basisLine = output("basis", line, overlay, { color: "@basis_color", label: "Basis", format: "price", tooltip: "{{label}} {{value:price}}" }); // the colour setting paints this line; label, format and tooltip shape its legend entry; the handle names it below
output("upper", line, overlay, { color: "#26a69a", label: "Upper band", format: "price" });
output("lower", line, overlay, { color: "#ef5350", label: "Lower band", format: "price" });
output("reference", line, overlay, { color: "#94a3b8", width: 1, line_style: "dashed", label: "Reference", format: "price" }); // the close on the picked timeframe: the chart's own until a coarser one is picked, then stepped
output("floor", line, overlay, { color: "#f59e0b", label: "Floor", format: "price", legend: false }); // the picked price, kept out of the legend
pane("momentum", { height_frac: 0.15 }); // a pane of its own below the chart, so the momentum never shares an axis with the ratio
output("momentum", line, lower, { pane: "momentum", color: "#8b5cf6", label: "Momentum", format: "0.00", tooltip: "{{label}} {{value:0.00}} %" }); // the average rate of change over the listed lookbacks, in the pane declared above
output("ratio", line, lower, { color: "#0ea5e9", label: "Ratio", format: "0.000" }); // the close over the picked market's close, in the default lower pane
output("basis_chg", none); // data-only: the basis change per bar, the delta a tile shows beside the value
output("band_pos", none); // data-only: where the close sits in the band, 0 at the lower band, 100 at the upper
output("state", none); // data-only: 0 outside the session, 1 inside and under the basis, 2 inside and over it
string("session", { max_bytes: 32 }); // the words the legend and the HUD show: the zone and whether the session is open
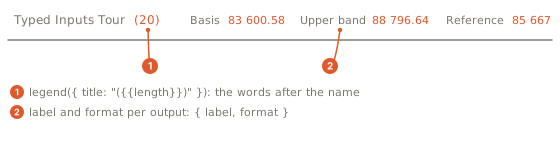
legend({ title: "({{length}})" }); // the words after the Indicator's name in the legend: a setting read by name
render.legend("session_entry", { text: "session", color_by: "state", colors: ["#94a3b8", "#ef5350", "#26a69a"] }); // a text entry in the legend, coloured by the state ladder
render.hud("tour", { position: "top_left", safe_area: true, title: "Tour", columns: 2, tiles: [tile.value("Basis", "basis", { format: "price", delta: "basis_chg" }), tile.spark("Momentum", "momentum", { bars: 32 }), tile.gauge("Band position", "band_pos", { min: 0, max: 100, format: "int" }), tile.pill("Session", "session", { color_by: "state", colors: ["#94a3b8", "#ef5350", "#26a69a"] })] }); // a card of four tiles pinned under the legend, clear of the newest candles
hover(basisLine, [block.value("Value", "basis", { format: "price", delta: "basis_chg" }), block.rows([["Upper", "upper", "price"], ["Lower", "lower", "price"], ["Reference", "reference", "price"]]), block.meter("Band position", "band_pos", { min: 0, max: 100, marks: [50] }), block.chips("session")]); // the card the basis shows on hover, titled by the line's label: four block kinds
presets({ Scalp: { length: 9, kind: "Exponential", band_pct_lo: 0.2, band_pct_hi: 1, show_reference: false }, Swing: { length: 50, kind: "Simple", band_pct_lo: 1, band_pct_hi: 3, show_reference: true } }); // named settings sets the dialog offers as chips

let basisSma = new Sma(20); // the two averages; onStart() rebuilds both at the chosen length and the kind picks one
let basisEma = new Ema(20);
let atr = new Atr(14); // the ATR an atr-unit offset scales by, rebuilt in onStart() at its own length
let rocs: Roc[] = []; // one rate of change per listed lookback, built in onStart()
let useEma = false; let bandsOn = true; let referenceOn = true; // the settings, read once in onStart() and kept here
let lowPct = 0.5; let highPct = 2.0; let offset = 0.0; let offsetUnit = 0; let tick = 0.0;
let since = 0.0; let floorPrice = 0.0; let dayMask = 0.0; let sessionStart = 570.0; let sessionEnd = 960.0; let zone = 0;
let basis: f64 = NaN; // the basis, kept between bars: each bar measures its change against the last one

// onStart() runs once before the first bar: every setting is read here, through its generated reader, and kept in module state.
function onStart(): void {
  const n = i32(p_length()); basisSma = new Sma(n); basisEma = new Ema(n); useEma = p_kind() == 1.0;
  bandsOn = pb_show_bands(); referenceOn = pb_show_reference(); lowPct = p_band_pct_lo(); highPct = p_band_pct_hi();
  offset = p_offset(); offsetUnit = i32(p_offset_unit()); atr = new Atr(i32(p_atr_length()));
  tick = p_market_tick_size(); // 0 where a host has no tick size: the helper then leaves a ticks value as it is
  since = p_since(); floorPrice = p_floor(); dayMask = p_days(); sessionStart = p_rth_start(); sessionEnd = p_rth_end();
  zone = i32(p_rth_tz()); if (zone < 0 || zone >= SESSION_TZ_LABELS.length) zone = 0;
  const lookbacks = p_lookbacks(); rocs = []; for (let i = 0; i < lookbacks.length; i += 1) rocs.push(new Roc(i32(lookbacks[i])));
}
// onBar() runs once per bar: read the bar, fold it into the averages, place it in the session; then write every output and the legend's words.
function onBar(): void {
  const t = bar.time(); const close = in_src(); const reference = in_close_htf(); const pair = in_close_pair(); // the bar's open in epoch seconds, the picked price field and the two pinned closes
  const prevBasis = basis;
  const sma = basisSma.update(close); const ema = basisEma.update(close); basis = useEma ? ema : sma;
  const atrValue = atr.update(bar.high(), bar.low(), close); // the bar's high and low feed the ATR an atr-unit offset scales by
  if (isFinite(basis)) basis += unitToPrice(offset, offsetUnit, close, tick, atrValue); // the offset in the unit the dialog picked, as a price distance
  const ratio = isFinite(pair) && pair != 0.0 ? close / pair : NaN;
  let sum = 0.0; let count = 0;
  for (let i = 0; i < rocs.length; i += 1) { const r = rocs[i].update(close); if (isFinite(r)) { sum += r; count += 1; } }
  const momentum = count > 0 ? sum / f64(count) : NaN;
  const weekday = i32((Math.floor(t / 86400.0) + 3.0) % 7.0); // 0 = Monday, from the bar's UTC day: the bit the days setting is tested by
  const active = inSession(t, sessionStart, sessionEnd, zone) && multiHas(dayMask, weekday); // the window in its zone, daylight saving included
  const started = t >= since;
  if (!isFinite(basis) || !started) return; // nothing to draw yet (before Start, or while the average warms up): every output stays NaN on this bar
  const upper = basis * (1.0 + highPct / 100.0); const lowerBand = basis * (1.0 - lowPct / 100.0);
  out_basis(basis); out_basis_chg(basis - prevBasis);
  out_upper(bandsOn ? upper : NaN); out_lower(bandsOn ? lowerBand : NaN); // a hidden line is NaN: nothing is drawn
  out_reference(referenceOn ? reference : NaN); out_floor(floorPrice > 0.0 ? floorPrice : NaN);
  out_momentum(momentum); out_ratio(ratio);
  const span = upper - lowerBand;
  out_band_pos(span > 0.0 ? Math.min(100.0, Math.max(0.0, ((close - lowerBand) / span) * 100.0)) : NaN);
  out_state(active ? (close > basis ? 2.0 : 1.0) : 0.0);
  sb_clear(); sb_text(SESSION_TZ_LABELS[zone]); sb_text(active ? " open" : " closed"); str_session_sb(); // "New York open", coloured by the state ladder
}How it works
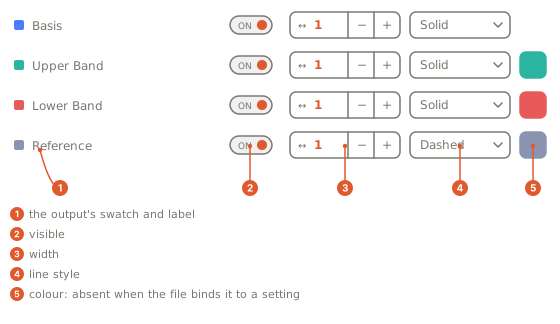
Every setting is declared by its kind, and onStart() reads each one once through its reader and keeps it in a module variable (Setting kinds). The source, timeframe and symbol picks have no reader: the chart applies them, and "@htf" and "@pair" pin the two inputs (Picks, lanes, the cap). color: "@basis_color" paints the basis line from the color setting (The Style page). The unit code and the session's three parts are integers; unitToPrice and inSession turn them into a price distance and an in-session test per bar (Sessions and units). basis_chg, band_pos and state are data-only outputs. pane("momentum", { height_frac: 0.15 }) gives momentum a pane of its own, so a ratio near 30 never flattens a momentum near 1 on a shared axis; the ratio keeps the default lower pane (Plotting). The hover card is titled by the basis line's label, so its first block reads Value rather than repeating Basis. Every tile and block reads the newest row, so a value written per bar is how a delta or a regime reaches the HUD card, the hover card and the legend's color ladder (HUD and hover cards, Legend).
Settings
The dialog lays the rows out in source order: Signal and Bands on the rail, the folded Session section with its row count, the Bands section carrying its toggle, and Scalp and Swing as chips after Default. Each row is the control its kind names, shaped by row, when, hint, slider and unit. The Style page adds a row per drawn output; the basis line's color is the basis_color setting's row instead. What each control looks like and why: Setting kinds, Options on a setting, Pages, sections, dividers, notes, Presets, The Style page.
Where it runs
Every market with candles, on any interval: the timeframe defaults to the chart's own. The source, timeframe and symbol picks are applied by the chart only when the indicator runs in your browser; on OpenMarket's servers the three keep their defaults and there is no Style page (Picks, lanes, the cap). The legend, the HUD and the hover card are drawn where the indicator runs in the browser.
When data is missing
A hidden line is NaN and draws nothing: the bands while Show bands is off, the reference while Reference is off, the floor while Floor price is 0. Bars before Start return from onBar() before any output is written, so they stay empty. The ratio is NaN where the picked market has no close for the bar, and momentum stays NaN until the first lookback is warm. Where a host has no tick size the hidden setting reads 0 and unitToPrice leaves a ticks value as it is; an ATR of 0 does the same for an atr-unit offset.
Customize it
- Pick a preset. Scalp sets the length to 9, the average to Exponential, the band to 0.2 and 1 percent and hides the reference; Swing sets 50, Simple, 1 and 3 percent with the reference on. A range is set through its parts,
band_pct_loandband_pct_hi(Presets). - Another reference. Pick a coarser timeframe in the Timeframe menu and the reference line steps at that timeframe's closes; pick another market with Ratio against and the ratio pane follows it.
- Add a setting. Declare it with its kind after the page it should land on and read it in
onStart(), or name the page and section with{ group: "Signal/Session" }(Pages, sections, dividers, notes). - Move the card.
positiononrender.hudis one of the nine anchors:top_left,top_center,top_right,middle_left,middle_center,middle_right,bottom_left,bottom_center,bottom_right.
Run it
- In the editor's Explorer, press the Templates icon ("Browse starter templates") and pick Typed inputs tour under Starters.
- Press Run: the basis and its bands draw on price with the dashed reference, momentum and the ratio draw in two panes below, the legend reads
(20)after the name, and the Tour card appears at the top left, under the legend. - Open the indicator's settings on the chart. Signal and Bands sit on the rail above the Chart caption, the presets strip offers Default, Scalp and Swing, and every row is the control its kind names. Switch Average to Exponential and the indicator reruns over the loaded bars without recompiling.
- At the editor's Console prompt, type
outputsto read the newest value of every output, the three data-only ones included.
Concepts used
- Setting kinds for the fifteen kinds, their controls and their readers
- Options on a setting for
row,when,hint,sliderandunit - Pages, sections, dividers, notes and Presets for the layout words and the chips
- The Style page for the rows the dialog adds and the
"@name"binding - Sessions and units for
inSession, the zone table andunitToPrice - Picks, lanes, the cap for what the chart applies in the browser
- HUD and hover cards and Legend for the three surfaces
- TA library for
Sma,Ema,AtrandRoc