Yield curve
The US Treasury par curve as it prints today, against a week ago and a month ago, in a pane below the chart: the nine tenors evenly spaced across, 1M to 30Y, so the front end reads as wide as the long end, yield in percent on the y axis, today's curve in teal and wider under a halo, the week curve in sky, the month curve in dashed slate, each tenor a dot. Today's 2Y and 10Y points are called out on the curve with their yields, and the 2s10s spread (10Y minus 2Y) sits in a chip on the pane's title row, teal while the curve is normal and rose while it is inverted, and as the headline of a broadsheet card at the top right (newsprint, serif type, small caps, dot leaders) with the 10Y and 3M yields under it. The legend names the curves the way the settings do (Today, Week curve, Month curve), and the pane's caption says how far back the week and month curves really are. The trader reads whether the curve is steep, flat or inverted at the front (a negative 2s10s is an inverted curve), and which way it moved over the week and the month, beside the coin's price.
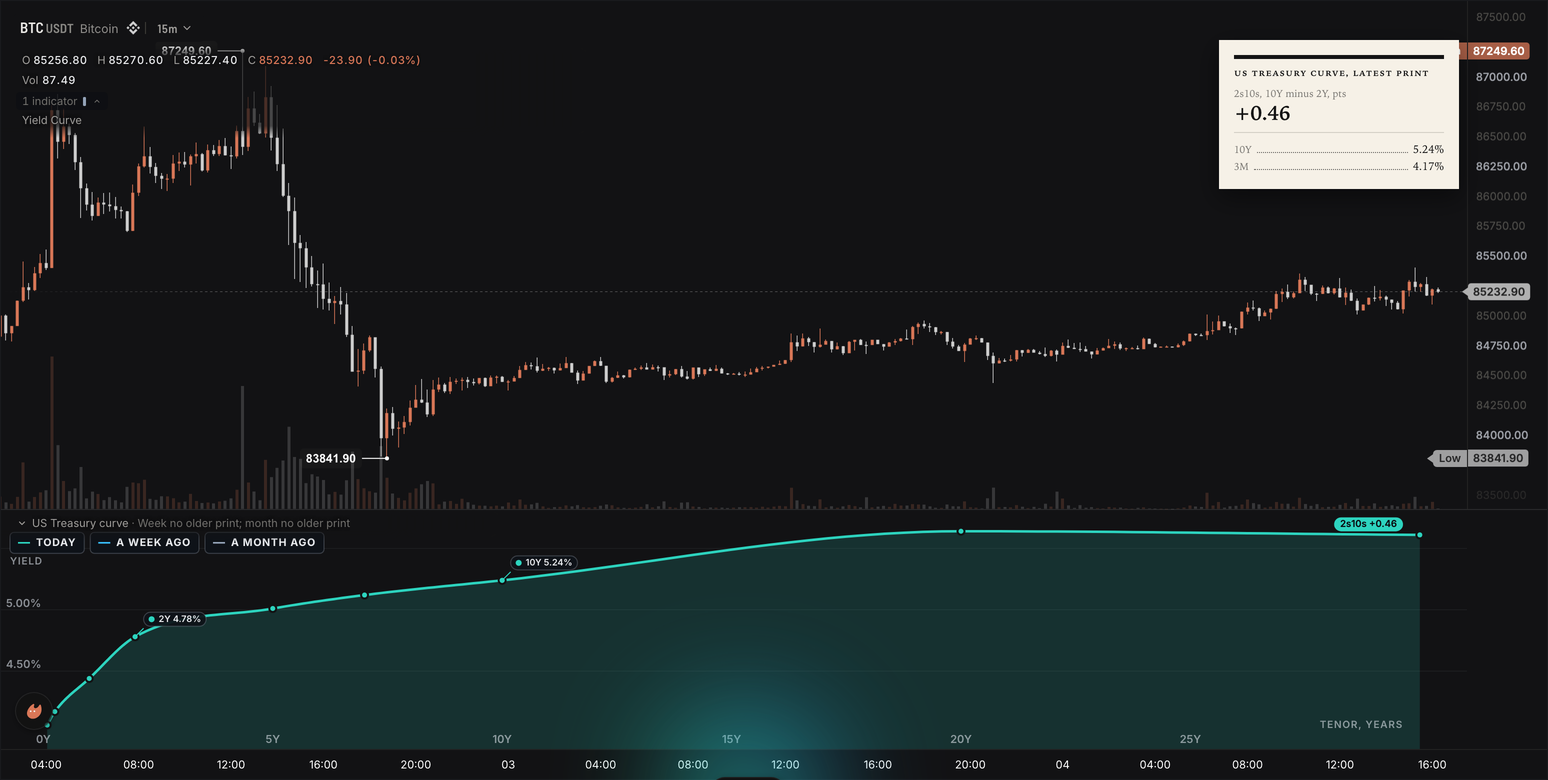
The parts are nine economic.value inputs pinned to FRED's daily series DGS1MO through DGS30 on the default carry policy (Data sources), two param.int day settings turned into bars by chart.interval_sec() (Sessions and units), a frame feeding a panel.line on a category axis with three series, two point callouts, a badge, a caption and a value axis set per run (Cards, frames and panels), a render.hud card of a headline tile.pill and a tile.rows in the broadsheet look (HUD cards), and a render.label at the top centre for the one sentence (Plotting). This is also the yield-curve template: the Yield Curve card under Beyond the time axis in the editor's starter list, and it compiles as written.
The wrun indicator
// Yield Curve: the US Treasury par curve as it prints today against a week ago and a month ago, the tenors evenly spaced
// across a pane below the chart, today's 2Y and 10Y points called out, the 2s10s spread (10Y minus 2Y) named in a
// chip on the pane and on a broadsheet card at the top right with the 10Y and 3M yields under it. The trader sees
// whether the curve is steep, flat or inverted at the front, and which way it moved over the week and the month,
// beside the coin's price. The yields are FRED's daily constant-maturity series (DGS1MO to DGS30), in percent, on the
// default carry policy: every bar reads the newest print at or before its day, the chart's first bar included (the
// chart also fetches the prints from before its window), so a 1m chart that opens in the middle of a day still has
// today's curve. A new print first shows on the first bar of its day; the week and month curves read the newest print
// at or before their day.

param.int("week", 7, { min: 1, max: 60, label: "Week curve, days back", description: "Days back for the week curve, the second line" });
param.int("month", 30, { min: 2, max: 365, label: "Month curve, days back", description: "Days back for the month curve, the third line" });
chart.interval_sec(); // the bar interval in seconds, written by the chart: days become bars without reading the clock
input("close", ohlcv.close); // the primary input: the chart's own candles define the grid the daily prints land on
input("y1m", economic.value, { publisher: "FRED", series: "DGS1MO", description: "1-month Treasury yield, percent" });
input("y3m", economic.value, { publisher: "FRED", series: "DGS3MO", description: "3-month Treasury yield, percent" });
input("y1", economic.value, { publisher: "FRED", series: "DGS1", description: "1-year Treasury yield, percent" });
input("y2", economic.value, { publisher: "FRED", series: "DGS2", description: "2-year Treasury yield, percent" });
input("y5", economic.value, { publisher: "FRED", series: "DGS5", description: "5-year Treasury yield, percent" });
input("y7", economic.value, { publisher: "FRED", series: "DGS7", description: "7-year Treasury yield, percent" });
input("y10", economic.value, { publisher: "FRED", series: "DGS10", description: "10-year Treasury yield, percent" });
input("y20", economic.value, { publisher: "FRED", series: "DGS20", description: "20-year Treasury yield, percent" });
input("y30", economic.value, { publisher: "FRED", series: "DGS30", description: "30-year Treasury yield, percent" });
output("spread", none, overlay, { description: "2s10s: the 10Y yield minus the 2Y yield in percentage points, below zero while the curve is inverted" });
string("spread_text", { max_bytes: 16 }); // "+0.12", the card's headline, or "no print"
string("y10_text", { max_bytes: 16 }); // "4.12%", or "no print"
string("y3m_text", { max_bytes: 16 });
string("note", { max_bytes: 96 }); // the one slate sentence, with its way out, while no tenor has a print on this chart
const curveRows = frame("curve_rows", { max_bytes: 4096 }); // nine rows: [tenor, today, the week curve, the month curve], null for a tenor without a print
// The curve: three smooth lines over the tenors, evenly spaced so the front end reads as wide as the long end, today in
// teal and wider under the halo, the week curve in sky, the month curve in dashed slate, each tenor a dot; the 2Y and
// 10Y callouts, the 2s10s chip, the value axis with headroom under the chip and the caption with each curve's real
// distance ride the frame.
panel.line({ name: "curve", title: "US Treasury curve", x: "category", place: "below", frame: curveRows, chrome: "grid", smooth: true, points: true, glow: true, hover_card: true, legend_style: "chips", x_title: "Tenor", y_title: "Yield", format: "%", decimals: 2, height_frac: 0.32, series: [{ name: "Today", color: "#2dd4bf", width: 2.5 }, { name: "Week curve", color: "#38bdf8", width: 1.5 }, { name: "Month curve", color: "#94a3b8", width: 1.5, line_style: "dashed" }] });
// The card, in the broadsheet look (newsprint, serif type, small caps, dot leaders; the Style page's Look row switches
// it, classic included): the 2s10s spread as the headline, then the 10Y and the 3M yields.
render.hud("yields", { position: "top_right", look: "broadsheet", title: "US Treasury curve, latest print", columns: 1, width: 240, safe_area: true, tiles: [
  tile.pill("2s10s, 10Y minus 2Y, pts", "spread_text", { headline: true }),
  tile.rows([["10Y", "y10_text"], ["3M", "y3m_text"]]),
] });
// The sentence, only while no tenor has a print: top centre, clear of the card, and drawn whole (a corner label is
// centred on its anchor, so at a right-hand corner half of a long sentence would run past the pane edge).
render.label("note_label", { position: "top_center", text: "note", color: "#94a3b8", style: "knockout", offset: [0, 8] });

const TENORS = 9;
const TENOR_NAMES: StaticArray<string> = ["1M", "3M", "1Y", "2Y", "5Y", "7Y", "10Y", "20Y", "30Y"]; // the x keys, in order
const OBS = 256; // prints kept per tenor: the value and the bar it first showed on; a print equal to the newest kept one is not kept again
const NO_PRINT = "no print"; // a card value without a print: words, never the dash an unwritten slot shows
const obsBar = new StaticArray<i32>(TENORS * OBS);
const obsVal = new StaticArray<f64>(TENORS * OBS);
const obsHead = new StaticArray<i32>(TENORS); // the newest kept slot per tenor, -1 before the first print
const obsCount = new StaticArray<i32>(TENORS);
const today = new StaticArray<f64>(TENORS); // the live bar's three curves, NaN for a tenor without a print
const weekAgo = new StaticArray<f64>(TENORS);
const monthAgo = new StaticArray<f64>(TENORS);
const todaySlot = new StaticArray<i32>(TENORS); // the kept print each curve read per tenor, -1 for none
const weekSlot = new StaticArray<i32>(TENORS);
const monthSlot = new StaticArray<i32>(TENORS);
let barIndex = -1; // bars since the oldest loaded one
let intervalSec = 900.0; // settings, read in onStart()
let weekBars = 672;
let monthBars = 2880;
let weekFallback = 0; // how the week and month curves were found on the live bar: 0 at their day, 1 the oldest print loaded, 2 none
let monthFallback = 0;
let weekDup = false; // the week curve repeats today's print for every tenor (no older print loaded): it is not drawn twice
let monthDup = false; // the month curve repeats the week's
let weekDays = 7.0; // the real distance of each curve in days, for the caption
let monthDays = 30.0;

function onStart(): void {
  intervalSec = p_chart_interval_sec();
  if (intervalSec <= 0.0) intervalSec = 900.0; // interval unknown: count as a 15-minute chart
  weekBars = i32(Math.round((f64(p_week()) * 86400.0) / intervalSec));
  monthBars = i32(Math.round((f64(p_month()) * 86400.0) / intervalSec));
  if (weekBars < 1) weekBars = 1;
  if (monthBars <= weekBars) monthBars = weekBars + 1;
  for (let k = 0; k < TENORS; k += 1) {
    obsHead[k] = -1;
    obsCount[k] = 0;
  }
}

// Keep this bar's print of tenor k, unless it repeats the newest kept one: every bar of a day reads the day's print and
// a weekend bar Friday's, so a print is kept once, on the bar it first shows on.
function keep(k: i32, v: f64): void {
  const h = obsHead[k];
  if (h >= 0 && obsVal[k * OBS + h] == v) return;
  const next = (h + 1) % OBS;
  obsBar[k * OBS + next] = barIndex;
  obsVal[k * OBS + next] = v;
  obsHead[k] = next;
  if (obsCount[k] < OBS) obsCount[k] += 1;
}
// The newest kept print of tenor k at or before bar 'at': its slot, or -1 when every kept print landed later.
function slotAtOrBefore(k: i32, at: i32): i32 {
  const n = obsCount[k];
  const h = obsHead[k];
  for (let j = 0; j < n; j += 1) {
    const s = (h + OBS - j) % OBS;
    if (obsBar[k * OBS + s] <= at) return s;
  }
  return -1;
}
function oldestSlot(k: i32): i32 {
  const n = obsCount[k];
  return n == 0 ? -1 : (obsHead[k] + OBS - (n - 1)) % OBS;
}
function daysBack(bar: i32): f64 {
  return (f64(barIndex - bar) * intervalSec) / 86400.0;
}
// One curve 'back' bars behind the live bar into 'into': a tenor's print at or before that bar, else the oldest print
// loaded (fallback 1), else NaN (fallback 2). Returns the fallback of the curve as a whole, records the slot each tenor
// read and leaves the curve's real distance in days.
function curveAt(back: i32, into: StaticArray<f64>, slots: StaticArray<i32>): i32 {
  const at = barIndex - back;
  let fallback = 2;
  let oldestBar = -1;
  for (let k = 0; k < TENORS; k += 1) {
    let s = slotAtOrBefore(k, at);
    if (s >= 0) {
      into[k] = obsVal[k * OBS + s];
      slots[k] = s;
      fallback = 0;
      continue;
    }
    s = oldestSlot(k);
    slots[k] = s;
    if (s < 0) {
      into[k] = NaN;
      continue;
    }
    into[k] = obsVal[k * OBS + s];
    if (fallback == 2) fallback = 1;
    if (obsBar[k * OBS + s] > oldestBar) oldestBar = obsBar[k * OBS + s];
  }
  if (fallback == 1 && oldestBar >= 0) {
    if (into == weekAgo) weekDays = daysBack(oldestBar);
    else monthDays = daysBack(oldestBar);
  }
  return fallback;
}
// True when curve 'a' read the same kept print as curve 'b' at every tenor: the same line twice.
function sameCurve(a: StaticArray<i32>, b: StaticArray<i32>): bool {
  for (let k = 0; k < TENORS; k += 1) if (a[k] != b[k]) return false;
  return true;
}
let lo: f64 = Infinity; // the drawn curves' lowest and highest yield on the live bar
let hi: f64 = -Infinity;
function widen(v: f64): void { if (!isNaN(v)) { if (v < lo) lo = v; if (v > hi) hi = v; } }
function fbPct(v: f64): void { // a yield as "4.12%" inside a JSON string the caller opened
  fb_f64(v, 2);
  fb_text("%");
}
function fbCallout(tenor: string, v: f64, color: string): void { // a callout on today's curve at a tenor, named and valued
  fb_text('{"x":');
  fb_str(tenor);
  fb_text(',"valign":"point","series":"Today","badge":true,"label":"');
  fb_text(tenor);
  fb_text(" ");
  fbPct(v);
  fb_text('","color":"');
  fb_text(color);
  fb_text('"}');
}
function fbDays(d: f64): void {
  fb_int(i32(Math.round(d)));
  fb_text("d back");
}
function fbCurveNote(fallback: i32, dup: bool, same: string, days: f64): void { // "7d back", "oldest, 16d back", "same as today" or "no older print"
  if (fallback == 2 || (dup && fallback == 1)) { // nothing older than the newer curve is loaded
    fb_text("no older print");
    return;
  }
  if (dup) { fb_text("same as "); fb_text(same); return; } // read at its day, the very prints of the newer curve: drawn once, named here
  if (fallback == 1) fb_text("oldest, ");
  fbDays(days);
}
// The card's three values, each written only when it is known, else "no print": every slot is written, so no tile
// ever shows the dash an unwritten slot reads as.
function writeCard(spread: f64, y10: f64, y3m: f64): void {
  sb_clear();
  if (isNaN(spread)) sb_text(NO_PRINT);
  else {
    if (spread >= 0.0) sb_text("+");
    sb_f64(spread, 2);
  }
  str_spread_text_sb();
  sb_clear();
  if (isNaN(y10)) sb_text(NO_PRINT); else { sb_f64(y10, 2); sb_text("%"); }
  str_y10_text_sb();
  sb_clear();
  if (isNaN(y3m)) sb_text(NO_PRINT); else { sb_f64(y3m, 2); sb_text("%"); }
  str_y3m_text_sb();
}

// onBar() runs once per bar: keep each tenor's print where it first shows; on the live bar read today's curve, the
// week's and the month's, write the card's slots and the pane's frame. Nothing is drawn per bar.
function onBar(): void {
  barIndex += 1;
  // Under carry a tenor reads NaN only before its series' first print, so a NaN is skipped, never kept.
  const v1m = in_y1m(); if (!isNaN(v1m)) keep(0, v1m);
  const v3m = in_y3m(); if (!isNaN(v3m)) keep(1, v3m);
  const v1 = in_y1(); if (!isNaN(v1)) keep(2, v1);
  const v2 = in_y2(); if (!isNaN(v2)) keep(3, v2);
  const v5 = in_y5(); if (!isNaN(v5)) keep(4, v5);
  const v7 = in_y7(); if (!isNaN(v7)) keep(5, v7);
  const v10 = in_y10(); if (!isNaN(v10)) keep(6, v10);
  const v20 = in_y20(); if (!isNaN(v20)) keep(7, v20);
  const v30 = in_y30(); if (!isNaN(v30)) keep(8, v30);
  if (!bar.isLast()) return;
  let printed = 0;
  for (let k = 0; k < TENORS; k += 1) {
    const h = obsHead[k];
    todaySlot[k] = h;
    today[k] = h < 0 ? NaN : obsVal[k * OBS + h];
    if (h >= 0) printed += 1;
  }
  if (printed == 0) { // no tenor has a print on this chart yet: the one sentence with its way out, the card in words
    str_note("No Treasury prints reached this chart yet: open the 1h chart or pan back a day");
    writeCard(NaN, NaN, NaN);
    return;
  }
  str_note(""); // the sentence is absent while a print stands (an empty text draws no label)
  weekDays = f64(weekBars) * intervalSec / 86400.0;
  monthDays = f64(monthBars) * intervalSec / 86400.0;
  weekFallback = curveAt(weekBars, weekAgo, weekSlot);
  monthFallback = curveAt(monthBars, monthAgo, monthSlot);
  weekDup = sameCurve(weekSlot, todaySlot);
  monthDup = sameCurve(monthSlot, weekSlot);
  const spread = today[6] - today[3]; // 2s10s, NaN while 2Y or 10Y has no print
  out_spread(spread);
  writeCard(spread, today[6], today[1]);
  fb_clear();
  fb_text('{"rows":[');
  for (let k = 0; k < TENORS; k += 1) {
    fb_text(k == 0 ? "[" : ",[");
    fb_str(TENOR_NAMES[k]);
    fb_text(",");
    fb_f64(today[k], 2);
    fb_text(",");
    fb_f64(weekDup ? NaN : weekAgo[k], 2);
    fb_text(",");
    fb_f64(monthDup ? NaN : monthAgo[k], 2);
    fb_text("]");
  }
  fb_text('],"markers":[');
  let callouts = 0;
  if (!isNaN(today[3])) { fbCallout("2Y", today[3], "#2dd4bf"); callouts += 1; }
  if (!isNaN(today[6])) { if (callouts > 0) fb_text(","); fbCallout("10Y", today[6], "#2dd4bf"); }
  fb_text("]");
  lo = Infinity; // the value axis: the drawn curves' range, with headroom above it so the chip never sits on a line
  hi = -Infinity;
  for (let k = 0; k < TENORS; k += 1) { widen(today[k]); if (!weekDup) widen(weekAgo[k]); if (!monthDup) widen(monthAgo[k]); }
  if (hi >= lo) { const pad = Math.max(0.05, (hi - lo) * 0.1); fb_text(',"y_min":'); fb_f64(lo - pad, 2); fb_text(',"y_max":'); fb_f64(hi + 3.0 * pad, 2); }
  if (!isNaN(spread)) {
    fb_text(',"badge":{"text":"2s10s ');
    if (spread >= 0.0) fb_text("+");
    fb_f64(spread, 2);
    fb_text('","color":"');
    fb_text(spread < 0.0 ? "#fb7185" : "#2dd4bf");
    fb_text('"}');
  }
  fb_text(',"caption":"Week '); // at most 64 characters: how far back each curve really is
  fbCurveNote(weekFallback, weekDup, "today", weekDays);
  fb_text("; month ");
  fbCurveNote(monthFallback, monthDup, "week", monthDays);
  fb_text('"}');
  writeFrameBuffer(FRAME_CURVE_ROWS);
}
How it works
Nine pins are the inputs. input("y10", economic.value, { publisher: "FRED", series: "DGS10" }) and its eight twins (DGS1MO, DGS3MO, DGS1, DGS2, DGS5, DGS7, DGS20, DGS30) read FRED's daily constant-maturity yields in percent; the chart's own close is the first input, so the daily prints land on the chart's bars. Under the default carry policy every bar reads the newest print at or before its day, the window's first bar included (the chart also fetches the prints from before its window), so a 1m chart that opens in the middle of a day still has today's curve; a new print first shows on the first bar of its day. A tenor reads NaN only before its series' first print, and onBar() skips a NaN.
Prints ride a ring, not bars. Each tenor keeps its last 256 distinct prints with the bar each landed on (obsVal and obsBar, a head and a count per tenor). keep() skips a print equal to the newest kept one, so the later bars of a day and a weekend bar (each carrying the newest print) never count as a new observation: a print is kept once, on the bar it first shows on (the window's first bar for the print that stood before the window), and the ring covers 256 prints on any interval. A week ago is slotAtOrBefore(): the newest kept print at or before the bar weekBars behind the live bar. When every kept print landed later, curveAt() falls back to the oldest print loaded and records the curve's real distance in days from the bar it read; sameCurve() then tells whether the week curve read the same prints as today's, or the month the same as the week's, in which case that curve is written as null instead of being drawn twice (its legend chip stays).
Days become bars through the chart's interval. week (7) and month (30) are days. chart.interval_sec() is a hidden setting the chart fills with the bar interval in seconds, read in onStart() through p_chart_interval_sec(), so weekBars is 672 on a 15m chart, 168 on 1h and 7 on 1d, with monthBars 2880, 720 and 30; an unknown interval (0) counts as 15m, and the month is kept at least one bar beyond the week.
One frame is the curve. On the live bar only, the frame builder (fb_clear(), fb_text(), fb_str() and fb_f64(), sent with writeFrameBuffer(FRAME_CURVE_ROWS)) writes curve_rows: nine rows of [tenor, today, week curve, month curve] keyed by the tenor's name from TENOR_NAMES ("1M" to "30Y"), two markers with valign: "point" pinned to the Today series at x "2Y" and x "10Y" (the 2Y and 10Y callouts, each a badge printing its yield), a badge reading "2s10s +0.46" in teal or rose by the spread's sign, a y_min and y_max around the drawn curves with three times the margin above them as below, so the chip on the title row never sits on the long end, and a caption of at most 64 characters ("Week 7d back; month oldest, 12d back"). panel.line({ name: "curve", x: "category", place: "below", ... }) draws the frame below the chart, every tenor the same width, with smooth, points and glow on, legend_style: "chips" and format: "%"; today's series is wider (2.5 against 1.5) and the month curve carries line_style: "dashed".
The card reads three slots and one output. spread is the only output, data-only, the 10Y minus the 2Y in percentage points on the live bar; spread_text ("+0.46"), y10_text and y3m_text ("5.24%") are string slots built with sb_clear() and sb_f64() and sent with str_spread_text_sb() and its twins. writeCard() writes all three on the live bar, each as a number when it is known and as "no print" when it is not, so no tile ever shows the dash an unwritten slot reads as. The render.hud card sits at top_right in one column, 240 px wide, with safe_area: true so it starts under the pane action bar and clear of the price-axis tags; its headline tile.pill reads spread_text and its tile.rows the 10Y and 3M slots. The broadsheet look draws the pill as text on newsprint and the rows with dot leaders, and the Style page's Look row switches the look without code.
The sentence is a positioned label. render.label("note_label", { position: "top_center", text: "note", color: "#94a3b8", style: "knockout", offset: [0, 8] }) prints the note slot in slate on a knockout at the top centre of the price pane, clear of the card and the legend. The slot is written on the live bar: the sentence while no tenor has a print, and empty otherwise (an empty text draws no label), so the label is absent while the yields are served; on that path the card's three slots read "no print". Nothing is drawn per bar: the ring fills on every bar, and the pane, the card and the output are written on the live bar alone.
Where it runs
Every chart the economic lane serves. The yields do not depend on the chart's market, so the same curve draws beside a crypto perpetual (BTCUSDT on Binance Futures at 1m, 15m and 1h) and beside gold (XAU/USD at 15m and 1h), and on a 1d chart the day settings read as bars one to one. How many curves the pane draws depends on how many days the chart has loaded: a 1m chart holds a few hours, so it draws today's curve and its caption reads "no older print" for the week and the month; a 15m chart holds about four days, so the week curve falls back to the oldest print loaded ("Week oldest, 4d back") and the month, which would read the same print, is not drawn twice; a 1h chart holds about twelve days, enough for the week curve at its day and the month curve at the oldest print. No market refuses the run by name.
When data is missing
If FRED answers nothing for one of the nine series, the chart stops the run with its own message that the economic series data is unavailable: on the default carry policy an empty series has nothing to carry. If no tenor has a print on this chart, one sentence sits at the top centre of the price pane, "No Treasury prints reached this chart yet: open the 1h chart or pan back a day", the card's three values read "no print", and the curve pane is not opened: the frame and the spread output are not written on that bar. A single tenor without a print is written null in its row (no dot) and its callout is left out; while the 2Y or the 10Y has none, the spread reads NaN, the chip is left off the pane and the card's headline reads "no print". The card never shows a dash: each of its values is a number when known, else "no print". When the loaded history is shorter than a week or a month, the curve falls back to the oldest print loaded and the caption says how far back that is ("month oldest, 12d back"); when that oldest print is today's at every tenor, the curve is not drawn (its legend chip stays) and its caption part reads "no older print", the usual state on a 1m chart. A curve read at its day that finds the same prints as the newer one (a 3-day week curve on a Monday reads Friday's print, today's newest) is drawn once too, and its caption part reads "same as today" ("same as week" for the month curve).
Customize it
- Further back.
week(Week curve, days back: 7 days, 1 to 60) andmonth(Month curve, days back: 30 days, 2 to 365) set how far back the week and month curves read; the chart's interval turns the days into bars, so the same numbers read right on 1m, 15m, 1h and 1d charts, and the month is kept at least one bar beyond the week. - Another spread. The 2s10s is
today[6] - today[3], the 10Y and 2Y slots of the tenor list (TENOR_NAMESruns 1M, 3M, 1Y, 2Y, 5Y, 7Y, 10Y, 20Y, 30Y). For the 5s30s readtoday[8] - today[4], and move the twofbCallout()calls to "5Y" and "30Y" with their slots so the callouts follow the spread. - Tenor in years. A category axis gives every tenor the same width. For a true maturity scale, write each row's years (0.083 to 30) with
fb_num()in place of its name, give the callouts their years asx, and declarex: "number"withx_format: "auto",x_decimals: 0andx_unit: "Y"; 1M to 2Y then pack into the first few percent of the axis. - Change the look. The card is made in the broadsheet look (newsprint paper, serif type, small caps in the title, dot leaders in the rows); the Look row on the indicator's Style page switches it without code, "As made" first and classic among the twelve, which is the second look this example was shot in (The Style page, Looks).
Run it
- In the editor's Explorer, press the Templates icon ("Browse starter templates") and pick Yield Curve under Beyond the time axis.
- Press Run on any chart, such as BTCUSDT on Binance Futures at 1h: the curve pane opens below the chart with its chips, callouts and caption, and the broadsheet card appears at the top right of the price pane.
- At the editor's Console prompt, type
last 20 spreadto read the 2s10s in percentage points: it is written on the live bar only, so only the last row carries a number.
Concepts used
- Data sources for the
economicsource, itspublisherandserieswords, and the defaultcarrypolicy on a daily series - Sessions and units for
chart.interval_sec()and the other facts the chart fills before the first bar - Cards, frames and panels for frames and the
fb_*builder,panel.lineon a category axis, point callouts, the badge, the caption and a per-run value axis - HUD cards for
render.hud, its anchors,widthandsafe_area - Looks for the broadsheet look's paper, type and dot leaders
- Blocks and tiles for the headline
tile.pillandtile.rows - The Style page for the Look row that switches the look without code
- Plotting for the
render.labelplaced byposition