Trend alignment
Three averages on the price pane: the chart's own EMA (sky) beside the 1h EMA (violet) and the 4h EMA (teal), the higher-timeframe ones drawn as steps that move only when their candle closes.
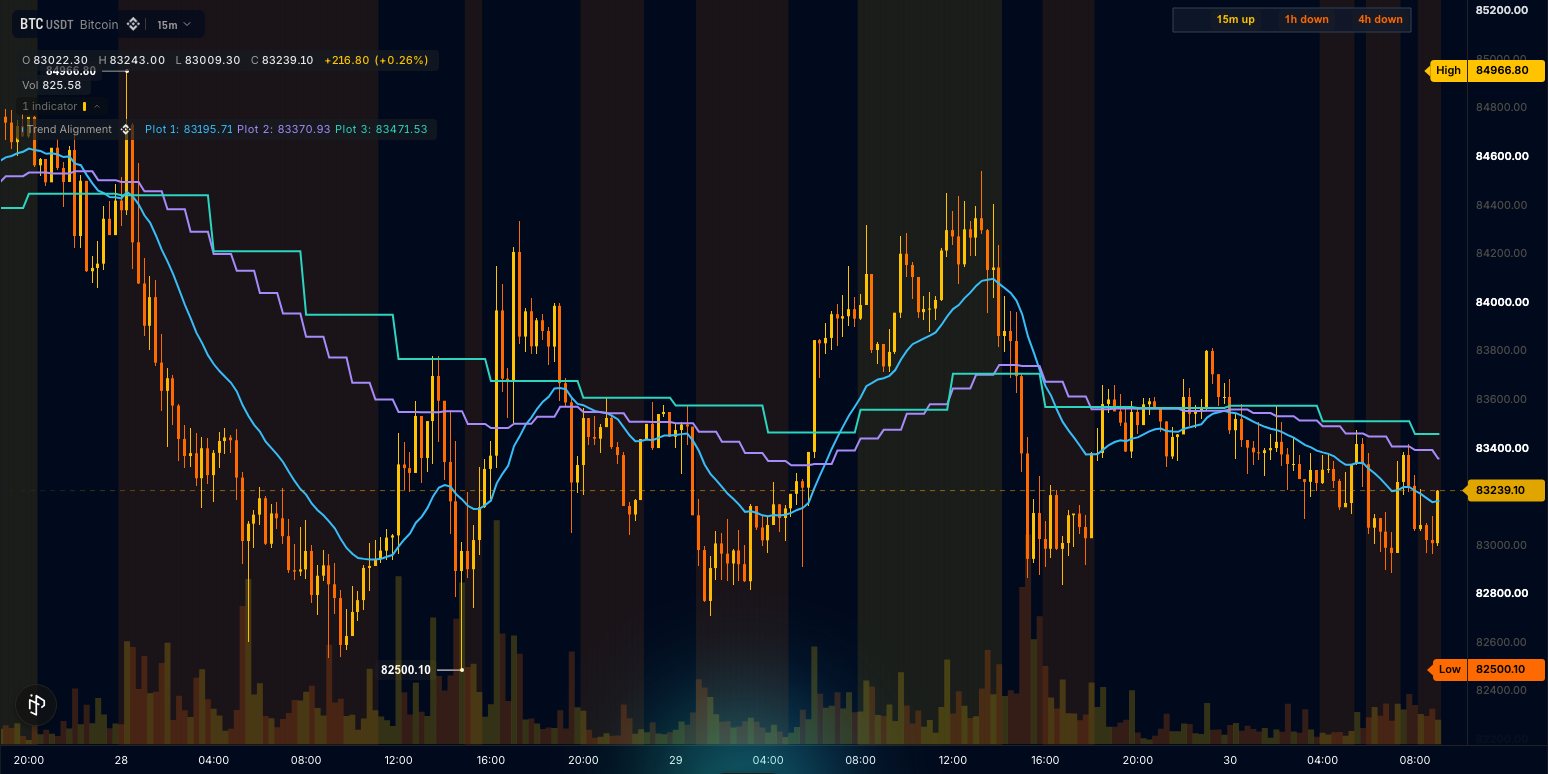
The background tints amber while price and both higher timeframes point up, orange while all three point down, and stays clear when they disagree; a new state has to hold for two bars before the tint flips, so there are no one-bar stripes. A three-cell strip at the top-right reads the state in words: "15m up 1h up 4h down", each cell in its own tone.
The parts are two candles streams of closed 1h and 4h candles with the history to seed their averages (Multi-timeframe), a render.bgcolor tint gated and coloured by a data-only output (Styling), and a strip of anchored box and label handles at the top-right corner (Drawing objects). This is also the trend-alignment template: the Trend Alignment card under On price in the editor's starter list, and it compiles as written.
The wrun indicator
// Trend Alignment: the chart's EMA beside the 1h and 4h EMAs as stepped lines; the background tints only while price and both higher
// timeframes agree (amber up, orange down, held two bars before it flips); a three-cell strip at the top-right reads "15m up  1h up  4h down".

param.int("ema_chart", 21, { min: 2, max: 200, label: "Chart EMA", row: "chart", description: "EMA length on the chart's own bars" }); // each length shares a dialog line with its line's colour: rows naming the same row word sit side by side
param.color("chart_color", "#38bdf8", { label: "Chart line", row: "chart" }); // a colour setting, painted onto the output below by name
param.int("ema_1h", 21, { min: 2, max: 200, label: "1h EMA", row: "1h", description: "EMA length on 1h closes" });
param.color("color_1h", "#a78bfa", { label: "1h line", row: "1h" });
param.int("ema_4h", 9, { min: 2, max: 200, label: "4h EMA", row: "4h", description: "EMA length on 4h closes" });
param.color("color_4h", "#2dd4bf", { label: "4h line", row: "4h" });
input("close", ohlcv.close); // the chart's own close: the primary grid
input("h1", candles.cells, { interval: "1h", bars: 200 }); // the closed 1h candles: the first bar carries the 200 before it, so the 1h EMA is warm from the first bar; each later bar the ones that closed since
input("h4", candles.cells, { interval: "4h", bars: 200 }); // the same for 4h
const chartLine = output("ema_chart", line, overlay, { color: "@chart_color", width: 2, label: "Chart EMA", format: "price", description: "EMA on the chart's bars" }); // the colour setting paints it; the handle names it for the hover card
output("ema_1h", line, overlay, { color: "@color_1h", width: 2, label: "1h EMA", format: "price", description: "EMA on 1h closes; steps once per hour" });
output("ema_4h", line, overlay, { color: "@color_4h", width: 2, label: "4h EMA", format: "price", description: "EMA on 4h closes; steps once per four hours" });
output("aligned", none, overlay, { description: "+1 while all three point up, -1 while all three point down, 0 mixed; a new state must hold two bars" }); // data-only, for the Console
hover(chartLine, [block.value("Chart EMA", "ema_chart", { format: "price" }), block.rows([["1h EMA", "ema_1h", "price"], ["4h EMA", "ema_4h", "price"], ["Aligned", "aligned", "int"]])]); // the card the chart EMA opens under the cursor: its value, then the other two averages and the state
render.bgcolor("alignment", { where: "aligned", color_by: "aligned", colors: ["#f868001a", "#f8c0001a"] }); // alpha 0.10; -1 clamps to colors[0] (orange), +1 reads colors[1] (amber); 0 draws nothing
string("cell", { max_bytes: 80 }); // one bounded slot every strip cell is written through
handles.box({ anchor: "top_right", color: "#0f172a", borderColor: "#334155", opacity: 0.85, borderWidth: 1 }); // the strip's backdrop, in pane pixels from the top-right corner
handles.label({ anchor: "top_right", align: "right", color: "#e2e8f0", size: 11 }); // the strip's cells, right-aligned in pane pixels

const AMBER: i32 = rgba(248, 192, 0, 255); const ORANGE: i32 = rgba(248, 104, 0, 255); const SLATE: i32 = rgba(148, 163, 184, 255);
const CELL_W = 74.0; const RIGHT = 56.0; // cell width in pixels; the strip stays clear of the price-axis tags (about 46 px into the pane)
const backdrop = draw.box(0); // handle objects allocate once
const cells: LabelHandle[] = [draw.label(1), draw.label(2), draw.label(3)]; // chart, 1h, 4h
const words = draw.label(4); // the one line of words on an hourly or coarser chart

let emaChart = new Ema(21); let avg1h = new Ema(21); let avg4h = new Ema(9); // each higher-timeframe average folds one closed candle at a time: NaN until it has folded its length
let ema1h: f64 = NaN; let ema4h: f64 = NaN; let close1h: f64 = NaN; let close4h: f64 = NaN; // the two averages and the newest closed 1h and 4h closes
let t: f64 = NaN; let prevT: f64 = NaN; let width: f64 = NaN; let foldedClose: f64 = NaN; // fold()'s second answer: the newest close it folded
let candidate = 0; let candidateRun = 0; let held = 0; // the alignment state, and the state waiting two bars to take over

function direction(price: f64, average: f64): i32 { return isNaN(price) || isNaN(average) ? 0 : price > average ? 1 : price < average ? -1 : 0; }
// The chart interval in words from the bar width: 15m, 1h, 4h, 1d.
function sbInterval(): void {
  if (width < 3600.0) { sb_int(i64(Math.round(width / 60.0))); sb_text("m"); }
  else if (width < 86400.0) { sb_int(i64(Math.round(width / 3600.0))); sb_text("h"); }
  else { sb_int(i64(Math.round(width / 86400.0))); sb_text("d"); }
}
function sbDirection(dir: i32, known: bool): void { sb_text(!known ? " -" : dir > 0 ? " up" : dir < 0 ? " down" : " flat"); } // "-" while the average warms
// Fold a block of closed candles into an average, oldest first: returns the average after the newest (the one before when the block is empty) and leaves that candle's close in foldedClose.
function fold(block: StaticArray<f64>, cells: i32, avg: Ema, value: f64, close: f64): f64 {
  const n = cells < block.length ? cells : block.length; // -1 (no candle yet) and 0 fold nothing
  let v = value; foldedClose = close;
  for (let i = 0; i + 6 <= n; i += 6) { const c = unchecked(block[i + 4]); if (!isFinite(c)) continue; v = avg.update(c); foldedClose = c; } // [offset_ms, open, high, low, close, volume] per candle
  return v;
}
function tone(dir: i32): i32 { return dir > 0 ? AMBER : dir < 0 ? ORANGE : SLATE; }
// onStart() runs once before the first bar: read the settings.
function onStart(): void {
  emaChart = new Ema(i32(p_ema_chart())); avg1h = new Ema(i32(p_ema_1h())); avg4h = new Ema(i32(p_ema_4h()));
}
// onBar() runs once per bar: feed the chart EMA every bar, fold the 1h and 4h candles that closed by this bar into their averages, read the
// three directions, then write the lines and the state; on the live bar only, redraw the strip.
function onBar(): void {
  prevT = t; t = bar.time(); const close = bar.close();
  if (!isNaN(prevT) && t > prevT && (isNaN(width) || t - prevT < width)) width = t - prevT;
  const fast = emaChart.update(close);
  ema1h = fold(in_h1_view(), in_h1_cells(), avg1h, ema1h, close1h); close1h = foldedClose; // a candle arrives on the bar whose close is at or after its own, so each average steps once per candle
  ema4h = fold(in_h4_view(), in_h4_cells(), avg4h, ema4h, close4h); close4h = foldedClose;
  const dirChart = direction(close, fast); const dir1h = direction(close1h, ema1h); const dir4h = direction(close4h, ema4h); // +1 above its average, -1 below, 0 unknown
  const next = dirChart != 0 && dirChart == dir1h && dir1h == dir4h ? dirChart : 0;
  if (next == candidate) candidateRun += 1; else { candidate = next; candidateRun = 1; }
  if (candidateRun >= 2) held = candidate; // a state has to hold two bars before the tint flips: no one-bar stripes
  if (isNaN(fast)) return;
  out_ema_chart(fast); out_ema_1h(ema1h); out_ema_4h(ema4h); out_aligned(f64(held));
  if (bar.isLast()) {
    backdrop.set(RIGHT + 3.0 * CELL_W + 16.0, 12.0, RIGHT, 36.0); // pixels from the top-right corner: left, top, right, bottom
    sb_clear(); sbInterval(); sbDirection(dirChart, true); cells[0].set(RIGHT + 8.0 + 2.0 * CELL_W, 24.0).text(str_cell_sb).color(tone(dirChart)).align(ALIGN_RIGHT);
    sb_clear(); sb_text("1h"); sbDirection(dir1h, !isNaN(ema1h)); cells[1].set(RIGHT + 8.0 + CELL_W, 24.0).text(str_cell_sb).color(tone(dir1h)).align(ALIGN_RIGHT);
    sb_clear(); sb_text("4h"); sbDirection(dir4h, !isNaN(ema4h)); cells[2].set(RIGHT + 8.0, 24.0).text(str_cell_sb).color(tone(dir4h)).align(ALIGN_RIGHT);
    if (width >= 3600.0) { sb_clear(); sb_text(width > 3600.0 ? "Made for charts finer than 1h" : "Made for charts finer than 1h: here the 1h average is the chart's own"); words.set(RIGHT, 50.0).text(str_cell_sb).color(SLATE).align(ALIGN_RIGHT); }
  }
}How it works
Closed candles step the averages. input("h1", candles.cells, { interval: "1h", bars: 200 }) and its 4h twin are streams of closed candles: the first bar carries the 200 that closed before it, and every later bar carries the candles that closed since, on the bar whose close is at or after the candle's own. fold() feeds each candle's close, oldest first, to a kit Ema of the setting's length, so each higher-timeframe EMA steps once per closed candle and is flat in between, and it is already warm on the chart's first bar: on a 1m chart the 1h EMA (21) has folded about 190 hourly closes before the first minute, so it reads the same value as an EMA over the market's whole history. An Ema is NaN until it has folded its length (its first value is the average of those closes), so a length deeper than the history served draws nothing rather than a guess, and the strip reads "-" for that timeframe. The chart's own EMA (ema_chart, 21) reads the bar's close.
Agreement is a number. aligned is +1 while the close sits above all three averages and every average points up, -1 while all three point down, 0 otherwise; a new state must hold two bars before it is written, which is what keeps one-bar stripes off the chart. It is data-only: the tint reads it, and so does the editor's Console prompt.
The tint reads the number. render.bgcolor("alignment", { where: "aligned", color_by: "aligned", colors: [orange, amber] }) gates on the output and picks its colour from it: -1 clamps to the first entry, +1 reads the second, 0 draws nothing.
The strip is three cells. A backdrop box and three right-aligned labels are anchored to the pane's top-right corner in pixels; each cell is written through the one bounded slot on the live bar and names the chart interval from the bar spacing.
Where it runs
Crypto and prediction markets on charts finer than 1h, such as 1m, 5m, 15m or 30m: the chart fetches each stream on its own, 200 closed candles deep, so the averages are right from the first bar on every one of them. On a 1h chart the 1h stream holds the chart's own candles; a chart coarser than 1h still runs, reading every 1h candle inside each of its bars, and says the example is made for finer charts. OpenMarket's alerts engine does not read candles streams yet, so an alert on this indicator is refused when you save it (Alerts).
When data is missing
On an hourly chart the 1h average is the chart's own, so the example adds one slate line of words under the strip ("Made for charts finer than 1h: here the 1h average is the chart's own") and keeps the lines and the tint; on a coarser chart the line reads "Made for charts finer than 1h". Where a market's history is shorter than an average's length, that average stays empty and its strip cell reads "-".
Customize it
- Other timeframes. Change the two
intervalwords (declaration literals, not settings) and the strip's two labels; raisebarsfor an average longer than 200 candles. - Slower flips. Raise the two-bar hold where
alignedis written to demand a longer agreement. - Lines only. Delete the
render.bgcolorline to keep the three averages and the strip without the tint.
Run it
- In the editor's Explorer, press the Templates icon ("Browse starter templates") and pick Trend Alignment under On price.
- Press Run on a chart finer than 1h, such as 15m: the three averages draw, the background tints while they agree, and the strip reads the state.
- At the editor's Console prompt, type
last 20 alignedto read the state of the last 20 bars.
Concepts used
- Multi-timeframe for the
candlesstream, itsbarsdepth and when a candle arrives - Styling for
render.bgcolor, gates and colour ladders - Drawing objects for anchored box and label handles in pane pixels