Trend candles
The chart's own candles tinted by where the close sits against two moving averages.
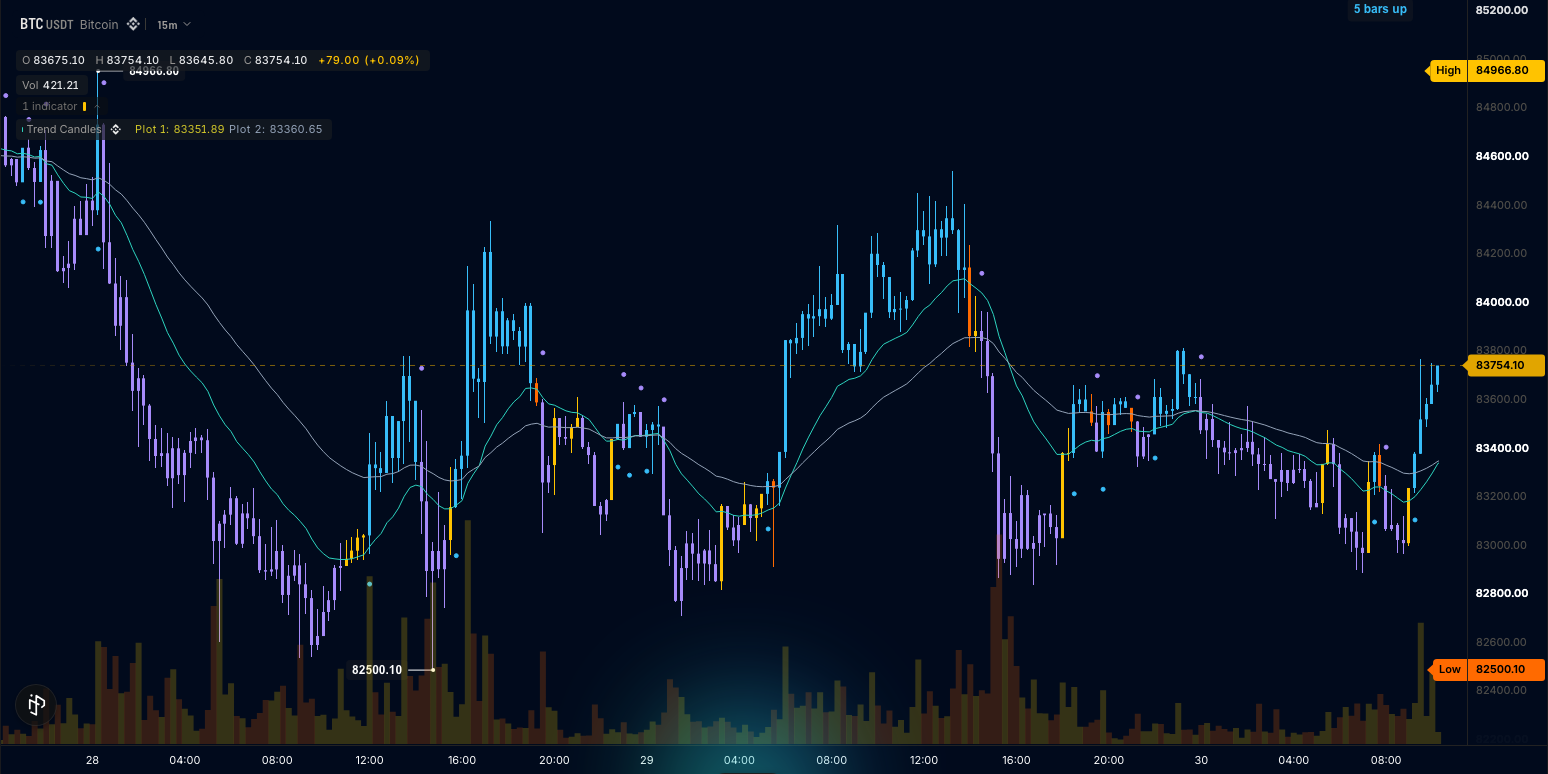
Above both averages the candle turns sky, below both it turns violet, between them it keeps the chart's own amber and orange. The two averages are thin lines (fast teal, slow slate). A dot marks each bar where the close crossed from one side of both averages to the other: under the bar for a flip up (sky), over it for a flip down (violet); crossing into the gap between the lines and back to the same side is not a flip. A counter at the top right reads how long the current state has held: "12 bars up", "7 bars down", "3 bars between".
The parts are render.barcolor, the per-bar candle tint gated and coloured by two data-only outputs (Styling), two shape outputs for the flip dots, and one label handle anchored to the top-right corner for the counter (Drawing objects). This is also the trend-candles template: the Trend Candles card under On price in the editor's starter list, and it compiles as written.
The wrun indicator
// Trend Candles: the chart's own candles tinted by where the close sits against two moving averages. Above both,
// the candle turns sky; below both, violet; between them it keeps the chart's own colours. The two averages are drawn
// as thin lines (fast teal, slow slate), a dot marks each bar where the trend flipped from one side to the other
// (under the bar for a flip up, over it for a flip down), and a counter at the top right reads how long the current
// state has held ("12 bars up").

param.int("fast_len", 21, { min: 2, max: 200, label: "Fast EMA", row: "lengths", description: "Fast EMA length in bars" }); // two whole numbers on one dialog line
param.int("slow_len", 50, { min: 2, max: 400, label: "Slow EMA", row: "lengths", description: "Slow EMA length in bars" });
param.color("up_color", "#38bdf8", { label: "Up tint", row: "tints" }); // two colour settings on one line: each paints the dot and the candle tint of its side below, by name
param.color("down_color", "#a78bfa", { label: "Down tint", row: "tints" });
const fastLine = output("fast_ema", line, overlay, { color: "#2dd4bf", width: 1, label: "Fast EMA", format: "price", description: "EMA of the close over fast_len bars" }); // the handle names it for the hover card
output("slow_ema", line, overlay, { color: "#94a3b8", width: 1, label: "Slow EMA", format: "price", description: "EMA of the close over slow_len bars" });
output("trend", none, overlay, { description: "+1 above both averages, -1 below both, 0 between" });
output("tinted", none, overlay, { description: "1 when the candle is tinted (above or below both averages): the tint's gate" });
output("tint", none, overlay, { description: "1 above both averages (sky), 0 below both (violet): the tint's colour index" });
output("run", none, overlay, { description: "Bars the current state has held" });
output("flip_up", shape, overlay, { color: "@up_color", description: "A dot under the bar where the trend turned up" }); // the up tint setting paints it
output("flip_down", shape, overlay, { color: "@down_color", description: "A dot over the bar where the trend turned down" });
string("text", { max_bytes: 24 }); // the counter's one line
handles.label({ anchor: "top_right", align: "right", size: 12 }); // the counter, in pane pixels from the chart's top-right corner
render.barcolor("trend_tint", { where: "tinted", color_by: "tint", colors: ["@down_color", "@up_color"] }); // the bar's own candle, body and wick, in the two tint settings
hover(fastLine, [block.value("Fast EMA", "fast_ema", { format: "price" }), block.rows([["Slow EMA", "slow_ema", "price"], ["Trend", "trend", "int"], ["Run", "run", "int"]])]); // the card the fast average opens under the cursor

const SLATE = rgba(148, 163, 184, 255);
const counter = draw.label(0);

let fastLen = 21; // settings, read in onStart()
let slowLen = 50;
let upInk = rgba(56, 189, 248, 255); // the two tint settings: the counter reads in the side's tint
let downInk = rgba(167, 139, 250, 255);
let fastEma = new Ema(21); // rebuilt in onStart()
let slowEma = new Ema(50);
let trend = 0; // +1 above both, -1 below both, 0 between
let lastTinted = 0; // the last side the close was on (+1 or -1): a flip is a change of side
let run = 0; // bars the current state has held
let rangeAvg: f64 = NaN; // a running mean of high - low: the dot's distance from the bar

function onStart(): void {
  fastLen = i32(p_fast_len());
  slowLen = i32(p_slow_len());
  fastEma = new Ema(fastLen);
  slowEma = new Ema(slowLen);
  upInk = fromPacked(p_up_color());
  downInk = fromPacked(p_down_color());
}

// onBar() runs once per bar: feed both averages, place the close against them, count the run, catch a flip;
// then write the averages, the state and the dots on every bar, and the counter on the live bar only.
function onBar(): void {
  const close = bar.close();
  const high = bar.high();
  const low = bar.low();
  const fast = fastEma.update(close);
  const slow = slowEma.update(close);
  const range = high - low;
  rangeAvg = isNaN(rangeAvg) ? range : rangeAvg + (range - rangeAvg) * 0.1;
  let flipUpY: f64 = NaN; // this bar's dots, NaN when the side held
  let flipDownY: f64 = NaN;
  if (isNaN(fast) || isNaN(slow)) return; // warm-up rows draw nothing
  const next = close > fast && close > slow ? 1 : close < fast && close < slow ? -1 : 0;
  run = next == trend ? run + 1 : 1;
  trend = next;
  if (trend != 0 && trend != lastTinted) { // the close crossed to the other side of both averages
    if (lastTinted != 0) {
      if (trend > 0) flipUpY = low - rangeAvg * 0.6;
      else flipDownY = high + rangeAvg * 0.6;
    }
    lastTinted = trend;
  }
  out_fast_ema(fast);
  out_slow_ema(slow);
  out_trend(f64(trend));
  out_tinted(trend != 0 ? 1.0 : 0.0);
  out_tint(trend > 0 ? 1.0 : 0.0);
  out_run(f64(run));
  out_flip_up(flipUpY);
  out_flip_down(flipDownY);
  if (bar.isLast()) {
    sb_clear();
    sb_int(run);
    sb_text(run == 1 ? " bar " : " bars ");
    sb_text(trend > 0 ? "up" : trend < 0 ? "down" : "between");
    counter.set(60, 14).text(str_text_sb).align(ALIGN_RIGHT).color(trend > 0 ? upInk : trend < 0 ? downInk : SLATE); // inward past the price-axis tags, in the side's tint
  }
}How it works
Two averages, three states. fast_len (21) and slow_len (50) are the EMA lengths; trend is +1 while the close sits above both averages, -1 below both, 0 between. It is data-only; the editor's Console prompt reads it after a Run.
The candle reads two numbers. render.barcolor("trend_tint", { where: "tinted", color_by: "tint", colors: [violet, sky] }) tints the bar's own candle, body and wick: tinted (1 above or below both averages) is the gate, tint (1 above, 0 below) picks the colour. Between the lines the gate is 0 and the candle keeps the chart's own colours.
A flip is a change of side. flip_up carries the bar's low on a bar where trend went from -1 to +1 (a sky dot under the bar), flip_down the bar's high on the way back (a violet dot over it); both are NaN elsewhere. Crossing into the gap and back to the same side is not a flip.
The counter is a slot. run counts the bars the current state has held; on the live bar it is written through the one bounded slot ("12 bars up") to a label anchored at the top-right corner in pixels. It reads in the side's tint: onStart() turns the Up tint and Down tint settings into colours with fromPacked(p_up_color()) and fromPacked(p_down_color()), so a changed tint recolours the candles, the dots and the counter together (slate between the averages).
Where it runs
Every market with candles: crypto, stocks, FX and prediction markets. CME markets are the exception: the editor's Run is paused there, and a community indicator cannot read CME data.
When data is missing
The first slow_len bars are warm-up and draw nothing; a bar without a close keeps the chart's own colours.
Customize it
- Other averages. Swap
EmaforSmafrom the TA library; the lengths stay settings. - A one-line filter. Drop the slow average and the "between" state to tint by one line.
- Tint the wick only.
render.barcolorcolours body and wick together; for the body alone, draw the tint as arender.bgcolorband instead.
Run it
- In the editor's Explorer, press the Templates icon ("Browse starter templates") and pick Trend Candles under On price.
- Press Run: the candles take the tint, and the counter appears at the top right.
- At the editor's Console prompt, type
last 20 trendto read the state of the last 20 bars.
Concepts used
- Styling for
render.barcolor, gates and colour ladders - Plotting for
shapeoutputs that draw only where they are finite - Drawing objects for the anchored label and the text slot