Open Interest Profile
The current month's open interest change by price (or the day's, or the week's), docked on the price axis as a two-sided column: a row grows green to the right where positions were opened on balance while price traded there, and red to the left where they were closed.
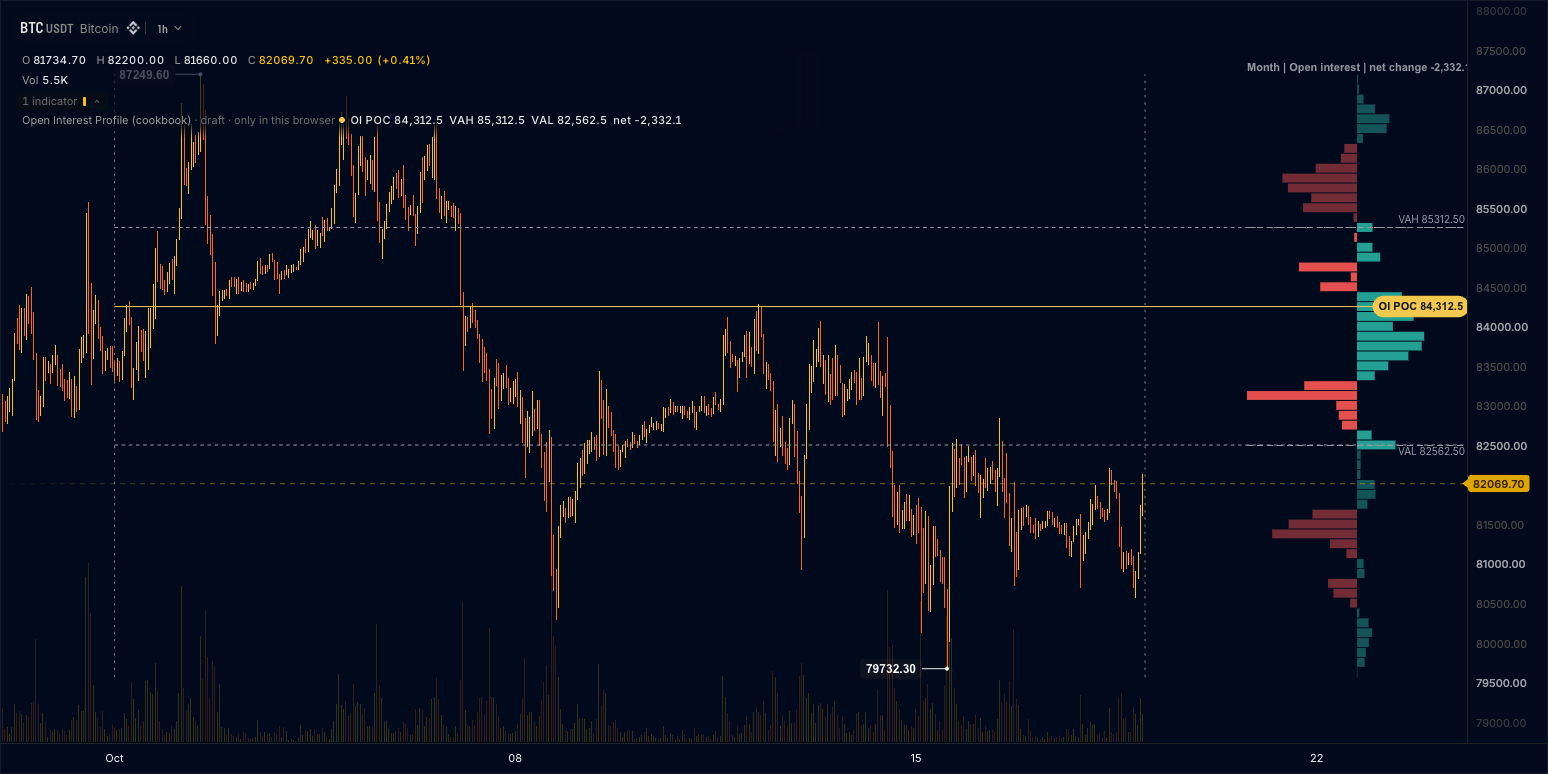
The OI POC, the row that added the most open interest, is drawn in amber from the period's first bar through to the axis with its tag on the axis ("OI POC 83,754.2"), and the value area's high and low are dashed in slate with their tags on the axis side of the column. Two dotted markers bound the period, a header line above the column reads it ("Month | Open interest | net change +12,841"), and the legend reads all four. Every chart finer than a week draws the same profile, built hour by hour, so a 1m chart and a 4h chart show the same rows.
The parts are two hourly streams, oi_candles.cells (each closed hour's open interest) and volume_profile_candles.cells (each closed hour's volume by price), a month deep (Data sources, Multi-timeframe), the chart's own oi.close and volume_profile.cells for the forming hour, a frame feeding plot.levels docked right with baseline: "center" and tag_place: "axis" (Cards, frames and panels), line and label handles for the levels, the POC tag, the markers and the header (Drawing objects), and a legend entry that reads them (Legend). This is also the open-interest-profile template: the Open Interest Profile card under Beyond the time axis in the editor's starter list, and it compiles as written.
The wrun indicator
// Open Interest Profile: the current period's net open-interest change by price, docked on the price axis as a
// two-sided column. Every closed hour of the period comes from two hourly streams: its open-interest change is spread
// over that hour's volume-by-price rows in proportion to the volume traded on each row, so a row grows green where
// positions were opened on balance and red where they were closed. The forming hour comes from the chart's own bars.
// The OI POC is the row that added the most open interest (a period that added none draws no POC); the value area
// grows from it over the net open interest added. Dotted markers bound the period and a header line reads its net
// change. Every chart finer than a week reads the same hourly profile; on a weekly or coarser chart the streams stand
// down and each bar is spread over its own rows.

section("Profile");
param.choice("period", ["Day", "Week", "Month"], "Month"); // the calendar period the profile covers, UTC
param.int("ticks", 25, { min: 1, max: 500, label: "Ticks per row", description: "Price ticks one row spans: the market's block size times this" });
param.number("value_area", 70, { min: 50, max: 95, label: "Value area in percent", description: "Value area as a percent of the period's net open interest added" });
param.choice("positive_side", ["Right", "Left"], "Right"); // which way the green rows grow from the column's centre
input("close", ohlcv.close); // the primary input: the chart's own candles define the grid
input("oi", oi.close, { currency: "Coin", missing: "nan", description: "Open interest at the bar's close, in the venue's own units" });
input("oi_open", oi.open, { currency: "Coin", missing: "nan", description: "Open interest at the bar's open: the first change on a weekly or coarser chart" });
input("profile", volume_profile.cells, { max_cells: 8192, ticks_per_bar: "@ticks", description: "This bar's volume by price row: the forming hour's rows" });
input("oi_h", oi_candles.cells, { interval: "1h", bars: 744, chart_interval_below: "1w", description: "The closed hours' open interest, a month deep" }); // [offset_ms, open, high, low, close] per hour, coins or contracts
input("vp_h", volume_profile_candles.cells, { interval: "1h", bars: 744, max_cells: 32768, ticks_per_bar: "@ticks", chart_interval_below: "1w", description: "The closed hours' volume by price row, a month deep" }); // [offset_ms, low, high, buy, sell] per row of each hour: rows per hour times 744
output("poc", none, overlay, { description: "OI POC: the row that added the most open interest" });
output("vah", none, overlay, { description: "Value area high of the net open interest added" });
output("val", none, overlay, { description: "Value area low of the net open interest added" });
output("net", none, overlay, { description: "The period's net open-interest change, in the venue's own units" });
string("tag", { max_bytes: 64 }); // one bounded slot the header is written through
string("poc_tag", { max_bytes: 32 }); // the OI POC tag's words
string("readout", { max_bytes: 96 }); // the levels in one line of words, for the legend
handles.line({ width: 1, line_style: "dashed", extend: "right" }); // POC, VAH and VAL from the period's first bar through to the axis; the two period markers
handles.label({ anchor: "right", align: "left", size: 11, color: "#9598A1", style: "plain" }); // the header line and the OI POC tag: x in pixels from the right edge, y in price
chart.interval_sec(); // the chart's bar interval in seconds, written by the chart: a week or more stands the streams down
const oi_rows = frame("oi_rows", { max_bytes: 65536 }); // the docked column: one row per price row of the period, signed net change, a colour per row
plot.levels({ name: "oi_profile", frame: oi_rows, dock: "right", baseline: "center", width_px: 220, labels: false, color: "#26A69A", opacity: 0.95, thickness_px: 40, value_area_color: "#9598A1", value_area_width: 1, value_area_line_style: "dashed", value_area_labels: true, poc: false, tag_place: "axis", hover: true, format: "si" }); // the POC is a line and a tag of its own, drawn only when a row added open interest
render.legend("level_readout", { text: "readout", color: "#F2C94C" }); // OI POC, VAH, VAL and the net in the legend

const MAX_KEYS = 16384; const HALF_KEYS = 8192; const MAX_ROWS = 512; // the row ledger (keys are row indices on the zero-based price grid) and the frame's row cap
const WAIT_OI = 1024; const WAIT_VP = 64; const WAIT_VP_ROWS = 4096; // the hours one stream carried before the other: open-interest changes, and volume hours with their rows
const net = new StaticArray<f64>(MAX_KEYS); // the period's net open-interest change per row key
const pend = new StaticArray<f64>(MAX_KEYS); // the forming hour's volume per row key: the chart's bars since the last one that opened on the hour, less the closed hours carried since
const rowNet = new StaticArray<f64>(MAX_ROWS); const rowKey = new StaticArray<i32>(MAX_ROWS); // the rows written: net per row and the first grid key each row covers
const oiOpen = new StaticArray<f64>(WAIT_OI); const oiChange = new StaticArray<f64>(WAIT_OI); // waiting open-interest hours: open (epoch seconds) and change
const vpOpen = new StaticArray<f64>(WAIT_VP); const vpFrom = new StaticArray<i32>(WAIT_VP); const vpTo = new StaticArray<i32>(WAIT_VP); // waiting volume hours: open and their rows' cells in vpRows
const vpRows = new StaticArray<f64>(WAIT_VP_ROWS * 4); // the waiting hours' rows, [low, high, buy, sell] each
const lines: LineHandle[] = [draw.line(0), draw.line(1), draw.line(2), draw.line(3), draw.line(4)]; // POC, VAH, VAL, period start marker, period end marker
const header = draw.label(5); // the header line above the column
const pocTag = draw.label(6); // the OI POC tag on the axis side
let period = 2; let ticks = 25; let valueArea = 0.7; let positiveRight = true; // the params, read in onStart()
let intervalSec: f64 = NaN; // the chart's bar interval in seconds, NaN when the chart does not say
let streamed = true; // the hourly streams carry the period (a chart finer than a week)
let rowH: f64 = NaN; let rowG: i64 = 0; let rowD = 0; // the row height in price (the market's block size times the ticks setting), and the gcd of every row edge seen until it is fixed, in units of 10^-rowD
let rowBase = 0; let based = false; // key - rowBase indexes net and pend, centred on the first key seen
let minKey = 0; let maxKey = -1; let pendMin = 0; let pendMax = -1; // the keys the period and the forming hour touched
let periodStart: f64 = NaN; // the current period's first second (UTC)
let prevOi: f64 = NaN; // the newest closed hour's open interest the stream carried (the previous bar's, once the streams stand down)
let lastVp: f64 = NaN; // the newest closed hour the volume stream carried, its open in epoch seconds
let syncT: f64 = NaN; // the open of the last chart bar that opened on the hour: pend starts there
let oiWait = 0; let vpWait = 0; let vpUsed = 0; // the hours waiting in each store, and the cells vpRows holds
let t: f64 = NaN; // this bar's open time
let poc: f64 = NaN; let vah: f64 = NaN; let val: f64 = NaN; let netTotal: f64 = 0.0; // the period's levels and net
let rowCount = 0; let merge = 1; let pocRow = 0; let lowRow = 0; let highRow = 0; // the rows written, the grid keys one row merges, the POC and value-area rows

// ── Calendar math (proleptic Gregorian, UTC) ──
let cy: i64 = 1970; let cm: i64 = 1;
function civilFromDays(days: i64): void { // days since 1970-01-01 -> year and month
  const z = days + 719468; const era = (z >= 0 ? z : z - 146096) / 146097; const doe = z - era * 146097;
  const yoe = (doe - doe / 1460 + doe / 36524 - doe / 146096) / 365; const y = yoe + era * 400;
  const doy = doe - (365 * yoe + yoe / 4 - yoe / 100); const mp = (5 * doy + 2) / 153; const m = mp < 10 ? mp + 3 : mp - 9;
  cy = m <= 2 ? y + 1 : y; cm = m;
}
function daysFromCivil(y0: i64, m: i64, d: i64): i64 { // year, month, day -> days since 1970-01-01
  const y = m <= 2 ? y0 - 1 : y0; const era = (y >= 0 ? y : y - 399) / 400; const yoe = y - era * 400;
  const doy = (153 * (m > 2 ? m - 3 : m + 9) + 2) / 5 + d - 1; const doe = yoe * 365 + yoe / 4 - yoe / 100 + doy;
  return era * 146097 + doe - 719468;
}
function periodStartOf(time: f64): f64 { // the first second of the Day, Monday week or calendar month holding time
  const days = i64(Math.floor(time / 86400.0));
  if (period == 0) return f64(days) * 86400.0;
  if (period == 1) return f64(days - (days + 3) % 7) * 86400.0; // 1970-01-01 was a Thursday
  civilFromDays(days); return f64(daysFromCivil(cy, cm, 1)) * 86400.0;
}

// ── Text helpers ──
function sbGrouped(n: i64): void { // 84210 -> 84,210
  if (n >= 1000) { sbGrouped(n / 1000); sb_text(","); const r = n % 1000; if (r < 100) sb_text("0"); if (r < 10) sb_text("0"); sb_int(r); } else sb_int(n);
}
function sbPrice(v: f64): void { // 83,754.2 / 2,431.55 / 12.345 / 0.13797 / 0.000012345: under 1, five significant digits (at most the 9 decimals text takes)
  if (v >= 1000.0) { const whole = Math.floor(v); sbGrouped(i64(whole)); sb_text("."); sb_int(i64(Math.round((v - whole) * 10.0)) % 10); }
  else if (v >= 100.0) sb_f64(v, 2); else if (v >= 1.0) sb_f64(v, 3); else if (!(v > 0.0)) sb_f64(v, 5); else { const d = i32(Math.ceil(-Math.log(v) / Math.LN10)) + 4; sb_f64(v, d < 5 ? 5 : d > 9 ? 9 : d); }
}
function sbSignedGrouped(v: f64): void { // +12,841 / -1,035.5
  sb_text(v < 0.0 ? "-" : "+"); const a = Math.abs(v);
  if (a >= 10000.0) sbGrouped(i64(Math.round(a))); else { const whole = Math.floor(a); sbGrouped(i64(whole)); sb_text("."); sb_int(i64(Math.round((a - whole) * 10.0)) % 10); }
}
function priceDecimals(step: f64): i32 { // enough decimals that the rounded row prices stay evenly spaced (the docked grid is contiguous only within 0.1% of its step), at most the 9 the frame's text takes
  const d = i32(Math.ceil(Math.log(2000.0 / step) / Math.LN10)); return d < 2 ? 2 : d > 9 ? 9 : d;
}

// ── The period ledger ──
function gcd(a: i64, b: i64): i64 { let x = a < 0 ? -a : a; let y = b < 0 ? -b : b; while (y != 0) { const r = x % y; x = y; y = r; } return x; }
function decimalsOf(v: f64): i32 { // the decimals a served price needs: the least d (0..12) at which v * 10^d is a whole number, to the double's precision (0 for no price)
  let x = Math.abs(v); if (!(x > 0.0 && x < Infinity)) return 0;
  for (let d = 0; d < 12; d += 1) { const r = Math.round(x); if (r != 0.0 && Math.abs(x - r) <= 1e-12 * x) return d; x *= 10.0; } return 12;
}
function foldEdges(cells: StaticArray<f64>, n: i32, stride: i32, col: i32): void { // every served row edge is a multiple of the market's block size (a row is clipped to the levels that traded, so one row's height is not the grid): the gcd of many edges is the block, counted in the decimals the edges need (a fixed unit rounds a fine market's edges to nothing) and kept below 2^53
  let d = rowD; let top = 0.0;
  for (let i = 0; i + stride <= n; i += stride) { for (let e = 0; e < 2; e += 1) { const v = Math.abs(cells[i + col + e]); const k = decimalsOf(v); if (k > d) d = k; if (v > top && v < Infinity) top = v; } }
  if (top > 0.0) { const cap = i32(Math.floor(Math.log(9.0e15 / top) / Math.LN10)); if (d > cap) d = cap > rowD ? cap : rowD; }
  while (rowD < d) { rowG *= 10; rowD += 1; } // the gcd so far, in the finer unit
  const unit = Math.pow(10.0, f64(rowD));
  for (let i = 0; i + stride <= n; i += stride) { rowG = gcd(rowG, i64(Math.round(cells[i + col] * unit))); rowG = gcd(rowG, i64(Math.round(cells[i + col + 1] * unit))); }
}
function learnRow(cells: StaticArray<f64>, n: i32): void { // the row height: the block size times the ticks setting (the built-in's rule), one gcd over the month-deep stream's edges and the chart's, fixed on the first row the stream reaches (the first bar once the streams stand down; the last bar if the stream never arrives)
  const m = streamed ? in_vp_h_cells() : 0;
  if (m >= 5) foldEdges(in_vp_h_view(), m, 5, 1);
  foldEdges(cells, n, 4, 0);
  if (rowG > 0 && (m >= 5 || !streamed || bar.isLast())) rowH = (f64(rowG) / Math.pow(10.0, f64(rowD))) * f64(ticks);
}
function keyOf(low: f64, high: f64): i32 { return i32(Math.floor((low + high) * 0.5 / rowH + 1e-6)); } // the zero-based grid row the row's centre sits in (a clipped edge row still lands in its own; a price on a grid line, the base buckets' rows, lands in the row it opens, whatever the double's last digit)
function at(key: i32): i32 { // where a key sits in the ledger, -1 outside its reach (an absurd print); the first key centres the ledger on itself
  if (!based) { rowBase = key - HALF_KEYS; based = true; }
  const i = key - rowBase; return i >= 0 && i < MAX_KEYS ? i : -1;
}
function addNet(key: i32, amount: f64): void { const i = at(key); if (i < 0) return; if (maxKey < minKey) { minKey = key; maxKey = key; } if (key < minKey) minKey = key; if (key > maxKey) maxKey = key; net[i] += amount; }
function addPendRow(key: i32, volume: f64): void { const i = at(key); if (i < 0) return; if (pendMax < pendMin) { pendMin = key; pendMax = key; } if (key < pendMin) pendMin = key; if (key > pendMax) pendMax = key; pend[i] += volume; }
function resetPeriod(start: f64): void { periodStart = start; for (let k = minKey; k <= maxKey; k += 1) { const i = at(k); if (i >= 0) net[i] = 0.0; } minKey = 0; maxKey = -1; }
function clearPend(): void { for (let k = pendMin; k <= pendMax; k += 1) { const i = at(k); if (i >= 0) pend[i] = 0.0; } pendMin = 0; pendMax = -1; }
function pos(v: f64): f64 { return v > 0.0 ? v : 0.0; }
function startPeriodAt(time: f64): bool { // the period holding time: a later one empties the ledger; false for an earlier one
  const start = periodStartOf(time);
  if (isNaN(periodStart) || start > periodStart) { resetPeriod(start); return true; }
  return start == periodStart;
}
function spread(change: f64, cells: StaticArray<f64>, from: i32, to: i32, stride: i32, col: i32): void { // one span's change over its rows by traded volume (the built-in's rule)
  if (isNaN(change) || change == 0.0 || isNaN(rowH)) return;
  let total = 0.0; for (let i = from; i + stride <= to; i += stride) total += pos(cells[i + col + 2]) + pos(cells[i + col + 3]);
  if (total <= 0.0) return;
  for (let i = from; i + stride <= to; i += stride) {
    const vol = pos(cells[i + col + 2]) + pos(cells[i + col + 3]); if (vol > 0.0) addNet(keyOf(cells[i + col], cells[i + col + 1]), (change * vol) / total);
  }
}
function addPend(cells: StaticArray<f64>, from: i32, to: i32, stride: i32, col: i32, sign: f64): void { // rows into the forming hour's volume (sign -1: a closed hour's rows out of it)
  if (isNaN(rowH)) return;
  for (let i = from; i + stride <= to; i += stride) addPendRow(keyOf(cells[i + col], cells[i + col + 1]), sign * (pos(cells[i + col + 2]) + pos(cells[i + col + 3])));
}

// ── The two streams, paired by the hour ──
function foldHour(open: f64, change: f64, cells: StaticArray<f64>, from: i32, to: i32, stride: i32, col: i32): void { if (startPeriodAt(open)) spread(change, cells, from, to, stride, col); }
function findOi(open: f64): i32 { for (let k = 0; k < oiWait; k += 1) if (oiOpen[k] == open) return k; return -1; }
function dropOi(e: i32): void { for (let k = e; k + 1 < oiWait; k += 1) { oiOpen[k] = oiOpen[k + 1]; oiChange[k] = oiChange[k + 1]; } oiWait -= 1; }
function waitOi(open: f64, change: f64): void { if (oiWait == WAIT_OI) dropOi(0); oiOpen[oiWait] = open; oiChange[oiWait] = change; oiWait += 1; } // the oldest drops when the store is full
function findVp(open: f64): i32 { for (let k = 0; k < vpWait; k += 1) if (vpOpen[k] == open) return k; return -1; }
function dropVp(e: i32): void { // one waiting volume hour out, the gap its rows leave closed
  const from = vpFrom[e]; const width = vpTo[e] - from;
  for (let i = from; i + width < vpUsed; i += 1) vpRows[i] = vpRows[i + width];
  vpUsed -= width;
  for (let k = e; k + 1 < vpWait; k += 1) { vpOpen[k] = vpOpen[k + 1]; vpFrom[k] = vpFrom[k + 1] - width; vpTo[k] = vpTo[k + 1] - width; }
  vpWait -= 1;
}
function waitVp(open: f64, v: StaticArray<f64>, from: i32, to: i32): void { // a volume hour whose open interest has not arrived: its rows wait (the oldest drop when the store is full)
  const width = ((to - from) / 5) * 4; if (width > WAIT_VP_ROWS * 4) return;
  while (vpWait > 0 && (vpWait == WAIT_VP || vpUsed + width > WAIT_VP_ROWS * 4)) dropVp(0);
  vpOpen[vpWait] = open; vpFrom[vpWait] = vpUsed;
  for (let i = from; i + 5 <= to; i += 5) { vpRows[vpUsed] = v[i + 1]; vpRows[vpUsed + 1] = v[i + 2]; vpRows[vpUsed + 2] = v[i + 3]; vpRows[vpUsed + 3] = v[i + 4]; vpUsed += 4; }
  vpTo[vpWait] = vpUsed; vpWait += 1;
}
function readHours(): void { // this row's closed hours: the two streams are separate lanes, so an hour folds once both have carried it, on whichever rows they arrive
  const n = in_oi_h_cells();
  if (n >= 5) {
    const c = in_oi_h_view();
    for (let i = 0; i + 5 <= n; i += 5) {
      const close = c[i + 4]; let change: f64 = NaN;
      if (!isNaN(close)) { change = !isNaN(prevOi) ? close - prevOi : close - c[i + 1]; prevOi = close; } // the built-in's rule: against the previous hour's close, the first one within its hour
      const open = t + c[i] / 1000.0; const w = findVp(open);
      if (w >= 0) { foldHour(open, change, vpRows, vpFrom[w], vpTo[w], 4, 0); dropVp(w); } else waitOi(open, change);
    }
  }
  const m = in_vp_h_cells(); if (m < 5) return;
  const v = in_vp_h_view();
  for (let i = 0; i + 5 <= m; ) { // one hour at a time: its rows share the hour's offset
    const off = v[i]; let j = i; while (j + 5 <= m && v[j] == off) j += 5;
    const open = t + off / 1000.0;
    if (open >= syncT) addPend(v, i, j, 5, 1, -1.0); // a closed hour the chart's bars in pend hold: out of the forming hour
    if (!(lastVp >= open)) lastVp = open;
    const w = findOi(open);
    if (w >= 0) { foldHour(open, oiChange[w], v, i, j, 5, 1); dropOi(w); } else waitVp(open, v, i, j);
    i = j;
  }
}
function foldForming(change: f64): void { // the forming hour's change over its volume rows (on the last bar only: the next tick rolls it back)
  if (isNaN(change) || change == 0.0) return;
  let total = 0.0; for (let k = pendMin; k <= pendMax; k += 1) { const i = at(k); if (i >= 0) total += pos(pend[i]); }
  if (total <= 0.0) return;
  for (let k = pendMin; k <= pendMax; k += 1) { const i = at(k); if (i >= 0 && pend[i] > 0.0) addNet(k, (change * pend[i]) / total); }
}
function weight(r: i32): f64 { return pos(rowNet[r]); } // the level weight: net open interest added (the built-in's 'net-positive' basis)
function nearestWeightUp(from: i32): i32 { for (let i = from + 1; i < rowCount; i += 1) if (weight(i) > 0.0) return i - from; return 0x7fffffff; }
function nearestWeightDown(from: i32): i32 { for (let i = from - 1; i >= 0; i -= 1) if (weight(i) > 0.0) return from - i; return 0x7fffffff; }
function buildRows(): bool { // the ledger's keys as at most 512 rows (grid keys merged in groups of merge when the period spans more), then POC and the value area
  if (maxKey < minKey || isNaN(rowH)) return false;
  merge = (maxKey - minKey + MAX_ROWS) / MAX_ROWS; if (merge < 1) merge = 1;
  let firstKey = i32(Math.floor(f64(minKey) / f64(merge))) * merge; // merged rows stay on a grid of merge keys from zero
  while ((maxKey - firstKey) / merge >= MAX_ROWS) { merge += 1; firstKey = i32(Math.floor(f64(minKey) / f64(merge))) * merge; } // rounding the first key down can add a row: widen until the aligned range fits
  rowCount = 0; netTotal = 0.0;
  for (let k = firstKey; k <= maxKey && rowCount < MAX_ROWS; k += merge) {
    let sum = 0.0; for (let j = 0; j < merge; j += 1) { const i = at(k + j); if (i >= 0) sum += net[i]; }
    rowNet[rowCount] = sum; rowKey[rowCount] = k; netTotal += sum; rowCount += 1;
  }
  if (rowCount < 1) return false;
  pocRow = -1; let best = 0.0; for (let r = 0; r < rowCount; r += 1) { const w = weight(r); if (w > best) { best = w; pocRow = r; } } // the first largest row (the built-in's profilePocIndex)
  if (pocRow < 0) { poc = NaN; vah = NaN; val = NaN; return true; } // no row added open interest: rows only, and no POC
  let total = 0.0; for (let r = 0; r < rowCount; r += 1) total += weight(r);
  const target = total * valueArea; lowRow = pocRow; highRow = pocRow; let inside = weight(pocRow);
  while (inside < target && (highRow < rowCount - 1 || lowRow > 0)) { // the built-in's expandValueArea: toward the heavier neighbour, ties up, a zero-vs-zero tie toward the nearer weight
    const canUp = highRow < rowCount - 1; const canDown = lowRow > 0;
    const up = canUp ? weight(highRow + 1) : 0.0; const down = canDown ? weight(lowRow - 1) : 0.0;
    let stepUp = false;
    if (canUp && canDown && up == 0.0 && down == 0.0) {
      const du = nearestWeightUp(highRow); const dd = nearestWeightDown(lowRow);
      if (du == dd) { const wu = du == 0x7fffffff ? 0.0 : weight(highRow + du); const wd = dd == 0x7fffffff ? 0.0 : weight(lowRow - dd); stepUp = wu >= wd; } else stepUp = du < dd;
    } else stepUp = up >= down && canUp;
    if (stepUp && canUp) { highRow += 1; inside += up; } else if (canDown) { lowRow -= 1; inside += down; } else if (canUp) { highRow += 1; inside += up; }
  }
  poc = (f64(rowKey[pocRow]) + 0.5 * f64(merge)) * rowH; vah = (f64(rowKey[highRow]) + 0.5 * f64(merge)) * rowH; val = (f64(rowKey[lowRow]) + 0.5 * f64(merge)) * rowH; // row centres (the built-in's line convention)
  return true;
}
function writeRows(): void { // the frame: row centres ascending, each row's own band, the signed net per row, a colour per row, and the value area when it spans two rows or more
  const rowWidth = rowH * f64(merge); const decimals = priceDecimals(rowWidth); const sign = positiveRight ? 1.0 : -1.0;
  fb_clear(); fb_text("{\"prices\":[");
  for (let r = 0; r < rowCount; r += 1) { if (r > 0) fb_text(","); fb_f64((f64(rowKey[r]) + 0.5 * f64(merge)) * rowH, decimals); }
  fb_text("],\"lows\":[");
  for (let r = 0; r < rowCount; r += 1) { if (r > 0) fb_text(","); fb_f64(f64(rowKey[r]) * rowH, decimals); }
  fb_text("],\"highs\":[");
  for (let r = 0; r < rowCount; r += 1) { if (r > 0) fb_text(","); fb_f64(f64(rowKey[r] + merge) * rowH, decimals); }
  fb_text("],\"values\":[");
  for (let r = 0; r < rowCount; r += 1) { if (r > 0) fb_text(","); fb_f64(rowNet[r] * sign, 4); }
  fb_text("],\"colors\":[");
  for (let r = 0; r < rowCount; r += 1) { if (r > 0) fb_text(","); const v = rowNet[r]; fb_text(v > 0.0 ? "\"#26A69A\"" : v < 0.0 ? "\"#EF5350\"" : "\"#64748b\""); }
  fb_text("]");
  if (pocRow >= 0 && highRow > lowRow) { fb_text(",\"value_area\":["); fb_f64(val, decimals); fb_text(","); fb_f64(vah, decimals); fb_text("]"); } // a one-row value area is the POC's own row: no band
  fb_text("}");
  writeFrameBuffer(oi_rows);
}
function drawLevels(): void { // the POC and its tag, the value area's two lines, from the period's first bar through to the axis; the two period markers, the header line
  const end = t + (isNaN(intervalSec) ? 0.0 : intervalSec);
  const rowWidth = rowH * f64(merge); const top = f64(rowKey[rowCount - 1] + merge) * rowH; const bottom = f64(rowKey[0]) * rowH;
  if (pocRow >= 0) { // only when a row added open interest (the dock draws no POC of its own, so a period of closes marks nothing)
    lines[0].set(periodStart, poc, end, poc).color(rgba(242, 201, 76, 255)).width(1.0).style(LineStyle.Solid).extend(Extend.Right);
    sb_clear(); sb_text("OI POC "); sbPrice(poc);
    pocTag.set(4.0, poc).text(str_poc_tag_sb).color(rgba(19, 23, 34, 255)).fill(rgba(242, 201, 76, 255)).style(LabelStyle.Pill).align(ALIGN_RIGHT);
  } else { lines[0].delete(); pocTag.delete(); }
  if (pocRow >= 0 && highRow > lowRow) { // a value area of two rows or more; one row is the POC's own
    lines[1].set(periodStart, vah, end, vah).color(rgba(149, 152, 161, 255)).width(1.0).style(LineStyle.Dashed).extend(Extend.Right);
    lines[2].set(periodStart, val, end, val).color(rgba(149, 152, 161, 255)).width(1.0).style(LineStyle.Dashed).extend(Extend.Right);
  } else { lines[1].delete(); lines[2].delete(); }
  lines[3].set(periodStart, bottom, periodStart, top).color(rgba(149, 152, 161, 200)).width(1.0).style(LineStyle.Dotted).extend(Extend.None);
  lines[4].set(end, bottom, end, top).color(rgba(149, 152, 161, 200)).width(1.0).style(LineStyle.Dotted).extend(Extend.None);
  sb_clear(); sb_text(period == 0 ? "Day" : period == 1 ? "Week" : "Month"); sb_text(" | Open interest | net change "); sbSignedGrouped(netTotal);
  header.set(220.0, top + rowWidth * 0.6).text(str_tag_sb).color(rgba(149, 152, 161, 255));
}

// onStart() runs once before the first bar: read the params; a weekly or coarser chart stands the streams down.
function onStart(): void {
  period = i32(p_period()); ticks = i32(p_ticks()); valueArea = p_value_area() / 100.0; positiveRight = p_positive_side() == 0.0;
  intervalSec = p_chart_interval_sec() > 0.0 ? p_chart_interval_sec() : NaN; // 0 when the chart did not fill it
  streamed = isNaN(intervalSec) || intervalSec < 604800.0;
}
// onBar() runs once per bar, oldest first. Finer than a week: the closed hours this row carries go into the period's
// ledger once both streams have them, and the forming hour's volume is the chart's own bars since the last one that
// opened on the hour less the closed hours carried since; on the last bar the forming hour's change (the bar's open
// interest less the newest closed hour's) is spread over it. A weekly or coarser chart spreads each bar's change over
// that bar's own rows. On the last bar: the rows, the levels, the markers, the header.
function onBar(): void {
  t = bar.time(); if (isNaN(t)) return;
  const n = in_profile_cells(); const cells = in_profile_view(); const oiNow = in_oi();
  if (isNaN(rowH)) learnRow(cells, n);
  if (!streamed) { // a weekly or coarser chart: the bar's change against the previous bar's close, else within the bar
    let change: f64 = NaN;
    if (!isNaN(oiNow)) { change = !isNaN(prevOi) ? oiNow - prevOi : oiNow - in_oi_open(); prevOi = oiNow; }
    if (startPeriodAt(t)) spread(change, cells, 0, n, 4, 0);
  } else {
    if (t == Math.floor(t / 3600.0) * 3600.0) { clearPend(); syncT = t; } // a bar that opens on the hour: every hour before it has closed, so the forming hour's volume starts here (a 45m bar straddles hours: pend keeps the bars back to the last one on the hour)
    addPend(cells, 0, n, 4, 0, 1.0);
    readHours();
    if (bar.isLast() && !isNaN(oiNow) && !isNaN(prevOi) && !isNaN(syncT) && startPeriodAt(isNaN(lastVp) ? t : Math.max(t, lastVp + 3600.0))) foldForming(oiNow - prevOi);
  }
  if (!bar.isLast()) return;
  if (!buildRows()) return;
  out_poc(poc); out_vah(vah); out_val(val); out_net(netTotal);
  writeRows(); drawLevels();
  sb_clear();
  if (pocRow >= 0) { sb_text("OI POC "); sbPrice(poc); sb_text("  VAH "); sbPrice(vah); sb_text("  VAL "); sbPrice(val); } else sb_text("No open interest added");
  sb_text("  net "); sbSignedGrouped(netTotal); str_readout_sb();
}
How it works
An hour at a time. input("oi_h", oi_candles.cells, { interval: "1h", bars: 744 }) hands the first bar every hour that has closed in the last 744 (a month: the backlog), then each later bar the hours that closed with it, one [offset_ms, open, high, low, close] tuple per hour in the venue's own units (coins or contracts, the stream's default). vp_h hands the same hours' volume by price, one [offset_ms, low, high, buy, sell] tuple per price row, the rows of an hour sharing its offset_ms and ascending by price. An hour's change is its close less the previous hour's (the first hour's, within its own hour), spread over that hour's rows in proportion to the volume traded on each: the chart's built-in Open Interest Profile rule. The two streams are separate lanes, so an hour can reach the run on different bars for each: its change and its rows wait for each other, and the hour folds once both have arrived.
The forming hour. The streams carry closed hours only, so the forming hour comes from the chart's own bars: their volume_profile.cells summed since the last bar that opened on the hour, less the closed hours the volume stream carried since. On a 15m chart that is the bars of the current hour; on a 4h chart, the live bar less the hours it already closed; on a 45m chart, whose bars straddle hours, the bars back to the last one that opened on the hour less the hours that closed since. Its change is the chart's own oi.close, read with currency: "Coin" (the stream's units), less the newest closed hour's close. It is folded on the live bar only, so every tick folds it again from the closed state.
Rows, POC and value area. A row spans ticks (25) of the market's price levels: the market's block size times the setting. The block size is the greatest common divisor of the row edges served, counted in as many decimals as those prices carry (so a market priced under 0.0001 learns its grid too), learned once on the first bar the volume stream reaches, from the month of hourly rows it carries and that bar's own rows together (one sparse bar alone would read a multiple of it). The period's rows are merged into at most 512: each merged row holds the same number of grid rows, counted from the grid's zero, and the count is the least that holds the period's range once its first row is rounded down to that grid. The OI POC is the first row with the most open interest added; the value area grows from it toward the heavier neighbour until it holds value_area (70) percent of the open interest added. When one row alone holds that share, the value area is the POC's own row: no band, no VAH or VAL line, and vah and val read the POC's price. A period that added no open interest on any row has no POC, and nothing marks one. poc, vah, val and net are data-only outputs, written on the live bar.
The column. frame("oi_rows") carries the rows (prices, each row's own low and high, the signed net, a colour per row) and the value_area when it spans two rows or more. It feeds plot.levels({ dock: "right", baseline: "center", width_px: 220, poc: false, tag_place: "axis" }): a column 220 pixels wide with zero at its centre, positives to the right (positive_side "Left" flips them), the VAH and VAL tags on the axis side. The level draws no POC of its own (poc: false): with no explicit POC a centred column would mark its largest row, an outflow in a period that added nothing. The POC line and its "OI POC" tag are a line handle and a label handle instead, drawn only when a row added open interest. The chart keeps the column's width free at the right edge, so the newest candles stop before it.
Where it runs
Perpetual futures with open interest and a volume profile: Binance Futures, Hyperliquid and the other venues that serve both. Every chart finer than a week reads the same hourly profile. On a weekly or coarser chart, chart_interval_below: "1w" stands the two streams down (nothing is fetched for them) and each bar's change is spread over that bar's own rows instead. vp_h declares max_cells: 32768, room for 744 hours of about 44 rows each; a market whose hours span more rows stops the run with wrun_cell_block_too_large, so raise ticks (fewer, wider rows) or max_cells.
When data is missing
Spot, stocks and FX carry no open interest: every change reads NaN, nothing is folded and no column is drawn. An hour the open interest stream carries without volume rows moves no row (its change is dropped, as the built-in drops it), and the next hour's change is still measured from it. Before the first closed hour reaches the run, the first change is measured within its own hour.
Customize it
- A day or a week.
periodDay or Week profiles the current UTC day or Monday week; the streams still read a month. - Wider rows.
ticksup to 500 rows of the market's price levels. - Flip the sides.
positive_sideLeft grows the green rows to the left. - A wider value area.
value_areaup to 95 percent. - Tags at the inner end.
tag_place: "inner"moves the VAH and VAL tags back to the column's inner end; the POC tag is a label, placed by its ownsetcall.
Run it
- In the editor's Explorer, press the Templates icon ("Browse starter templates") and pick Open Interest Profile under Beyond the time axis.
- Press Run on a perpetual chart such as BTCUSDT on Binance Futures at 1m: the column docks on the right, the three levels draw from the month's first bar with their tags on the axis side, and the header reads the month's net change. Switch the chart to 1h or 4h: the same rows.
- At the editor's Console prompt, type
poc,vah,valandnetto read the levels and the net change on the newest bar.
Concepts used
- Data sources for the
oi_candlesandvolume_profile_candlesstreams andoi'scurrency - Multi-timeframe for streams,
barsandchart_interval_below - Cards, frames and panels for frames,
plot.levelsdocked two-sided andtag_place - Drawing objects for line and label handles extended to the axis