Volume profile and value area
The last 96 bars' volume profile docked on the price axis, the point of control row amber, the value area rows sky, the rest slate.
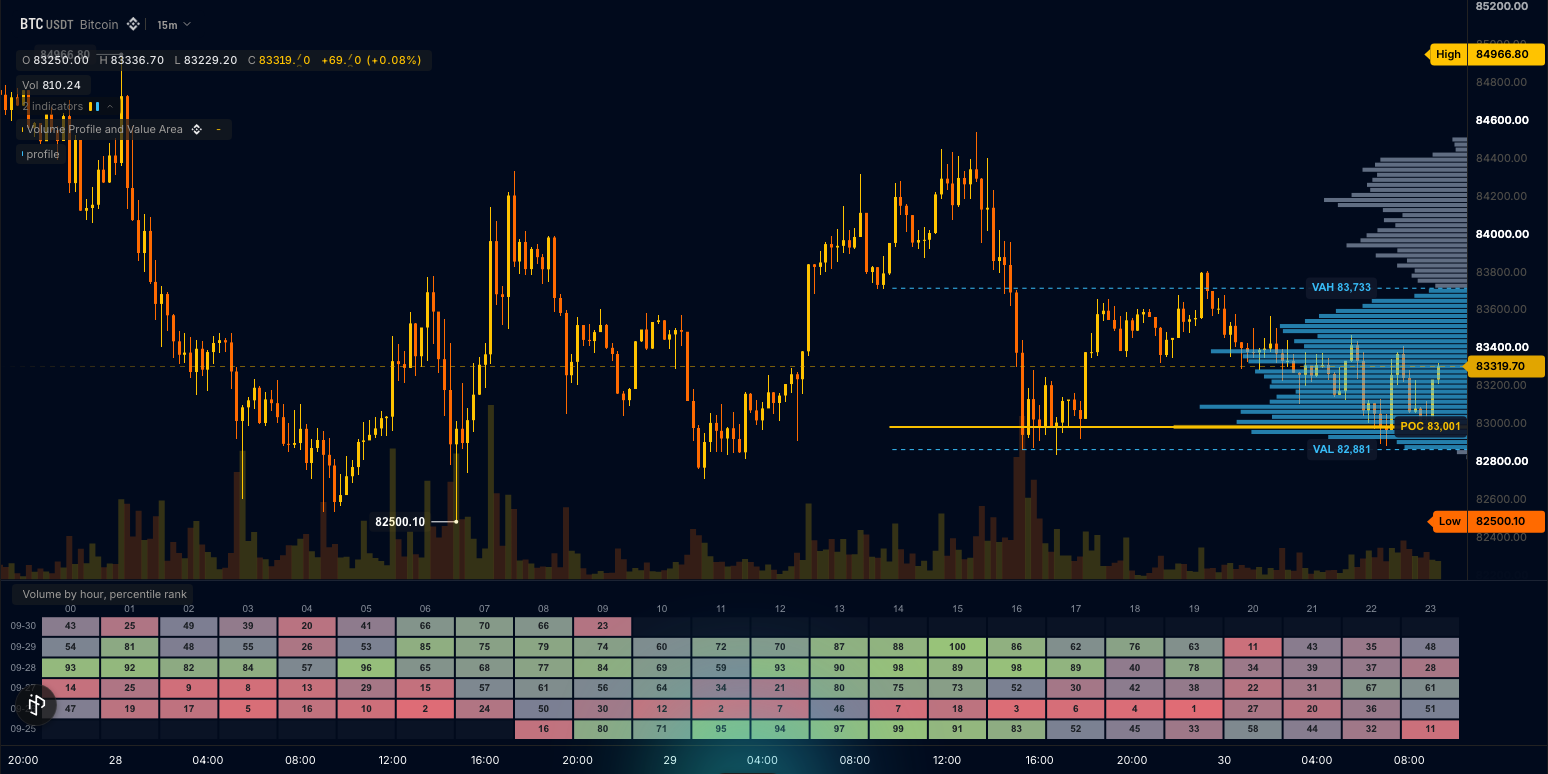
The rows never go finer than the market's own price levels, each level's volume is spread over the rows it covers, and a level the candle never touched is ignored, so the profile reads as a profile everywhere. POC, VAH and VAL are drawn as lines across the window they were measured on, through to the axis (POC solid amber, VAH and VAL dashed sky), each with a price tag at the axis, and the legend reads all three ("POC 84,798 VAH 85,987 VAL 83,288"), so a level the window measured below or above the candles in view still has a readout. Below the chart, a heatmap of volume by UTC hour for the last seven days, newest day on top, each cell the hour's percentile rank among the grid's hours, so the heavy hours jump out and the quiet ones fade.
The parts are a celled volume_profile.cells input read as a block in onBar() (Volume profile), a frame feeding plot.levels docked on the price axis and a second frame feeding panel.heatmap below the chart (Cards, frames and panels), line and label handles for the three levels and their tags (Drawing objects), and a legend entry that reads them (Legend). This is also the volume-profile-value-area template: the Volume Profile and Value Area card under Beyond the time axis in the editor's starter list, and it compiles as written.
The wrun indicator
// Volume Profile and Value Area: the last `window` bars' volume profile docked on the price axis with the point of
// control and the value area lit, POC / VAH / VAL as lines on price with price tags at the axis, and an hour-by-day
// volume heatmap below the chart. The trader sees where volume was accepted and where price sits against it.

section("Profile"); // the dialog's first section: the docked profile's settings
param.int("window", 96, { min: 10, max: 500, label: "Window in bars", description: "Bars in the rolling profile" });
param.number("value_area", 70, { min: 50, max: 95, label: "Value area in percent", description: "Value area as a percent of the window's volume" });
param.int("rows", 64, { min: 16, max: 128, label: "Profile rows", description: "Price rows in the docked profile" });
section("Heatmap"); // the second section: the panel under the chart
param.int("heat_days", 7, { min: 2, max: 14, label: "Heatmap days", description: "Days shown in the volume heatmap" });
input("close", ohlcv.close); // the primary input: the chart's own candles define the grid
input("profile", volume_profile.cells, { max_cells: 8192, description: "This bar's volume by price level" }); // [low, high, buy, sell] per level; measured on Binance Futures BTCUSDT: about 280 levels per 15m bar, 860 per 1h bar
output("poc", none, overlay, { description: "Point of control of the rolling profile" }); // data-only: the live level is drawn as a line across its window
output("vah", none, overlay, { description: "Value area high" });
output("val", none, overlay, { description: "Value area low" });
string("tag", { max_bytes: 40 }); // one bounded slot the three price tags are written through, one at a time
string("readout", { max_bytes: 64 }); // the three levels in one line of words, for the legend
handles.line({ color: "#38bdf8", width: 1, lineStyle: "dashed", extend: "right" }); // POC, VAH and VAL across the window they were measured on, through to the axis
handles.label({ anchor: "right", align: "right", size: 11, color: "#e2e8f0" }); // price tags: x in pixels from the right edge, y in price
const profile_rows = frame("profile_rows", { max_bytes: 8192 }); // the docked profile: one row per price bin
const heat_rows = frame("heat_rows", { max_bytes: 16384 }); // the heatmap: one cell per hour and day
plot.levels({ name: "profile", frame: profile_rows, dock: "right", width_frac: 0.2, labels: false, color: "#38bdf8" });
panel.heatmap({ name: "volume_heat", title: "Volume by hour, percentile rank", x: "category", place: "below", frame: heat_rows });
render.legend("level_readout", { text: "readout", color: "#38bdf8" }); // POC, VAH and VAL in the legend: readable when a level sits off the price pane

const MAX_WINDOW = 500; const BINS = 48; const MAX_ROWS = 128; const MAX_DAYS = 14; const HOURS = 24; // ring sizes for the largest settings
const barLo = new StaticArray<f64>(MAX_WINDOW); const barHi = new StaticArray<f64>(MAX_WINDOW); const barT = new StaticArray<f64>(MAX_WINDOW); // each ring bar's price span and open time
const barBins = new StaticArray<f64>(MAX_WINDOW * BINS); // each ring bar's volume in BINS equal bins across its span
const rowVol = new StaticArray<f64>(MAX_ROWS); // the window profile: volume per price row
const heat = new StaticArray<f64>(MAX_DAYS * HOURS); const heatBars = new StaticArray<i32>(MAX_DAYS * HOURS); // volume and bar count per day and hour
const jsonBytes = new StaticArray<u8>(16384); let jsonUsed = 0; // the frame JSON, appended as UTF-8 bytes
const tags: LabelHandle[] = [draw.label(0), draw.label(1), draw.label(2)]; const levelLines: LineHandle[] = [draw.line(3), draw.line(4), draw.line(5)]; // POC, VAH, VAL price tags and the same three levels as lines; handle objects allocate once, ids one space across kinds
let window = 96; let valueArea = 0.7; let rows = 64; let heatDays = 7; // the params, read in onStart()
let head = -1; let count = 0; // the ring: head is the newest bar, count the bars in use
let dayBase: i64 = -1; // the day number (days since the epoch) of the heatmap's oldest row
let t: f64 = NaN; let poc: f64 = NaN; let vah: f64 = NaN; let val: f64 = NaN; // this bar's open time and the window's three levels
let levelHeight: f64 = Infinity; // the market's price level height, the smallest [low, high] span seen: the row grid never goes finer
let rowCount = 64; // rows in use this bar: the setting, or fewer on a market whose levels are coarser than the setting would ask
let probLike = true; // every close so far sits in 0..1 on a 0.001 grid: a prediction market, whose prices read as percent
let winLo: f64 = NaN; let rowHeight: f64 = NaN; let pocRow = 0; let lowRow = 0; let highRow = 0; // the window profile's geometry

// ── JSON bytes: append text and numbers without allocating; one string is made per frame write ──
function jbByte(b: u32): void { if (jsonUsed < jsonBytes.length) { jsonBytes[jsonUsed] = <u8>b; jsonUsed += 1; } }
function jbText(s: String): void {
  const n = String.UTF8.byteLength(s);
  if (jsonUsed + n <= jsonBytes.length) jsonUsed += i32(String.UTF8.encodeUnsafe(changetype<usize>(s), s.length, changetype<usize>(jsonBytes) + jsonUsed));
}
function jbUint(v: u64): void { if (v >= 10) jbUint(v / 10); jbByte(0x30 + <u32>(v % 10)); }
function jbNum(v: f64, decimals: i32): void { // a fixed-point number, or null when not finite
  if (!isFinite(v)) { jbText("null"); return; }
  let x = v; if (x < 0.0) { jbByte(0x2d); x = -x; }
  let scale = 1.0; for (let i = 0; i < decimals; i += 1) scale *= 10.0;
  const scaled = Math.round(x * scale); const whole = Math.floor(scaled / scale); const frac = scaled - whole * scale;
  jbUint(<u64>whole);
  if (decimals > 0) { jbByte(0x2e); let f = <u64>frac; let digits = 1; let probe = f; while (probe >= 10) { probe /= 10; digits += 1; } for (let i = digits; i < decimals; i += 1) jbByte(0x30); jbUint(f); }
}
function jbFlush(slot: i32): void { writeFrame(slot, String.UTF8.decodeUnsafe(changetype<usize>(jsonBytes), jsonUsed)); jsonUsed = 0; }

// ── Text helpers for the price tags ──
function sbGrouped(n: i64): void { // 84210 -> 84,210
  if (n >= 1000) { sbGrouped(n / 1000); sb_text(","); const r = n % 1000; if (r < 100) sb_text("0"); if (r < 10) sb_text("0"); sb_int(r); } else sb_int(n);
}
function sbPrice(v: f64): void { // decimals follow the price's size: 84,210 / 2,431.55 / 12.345 / 0.13797; a prediction market's price reads as percent
  if (probLike) { sb_f64(v * 100.0, 1); sb_text("%"); } else if (v >= 1000.0) sbGrouped(i64(Math.round(v))); else if (v >= 100.0) sb_f64(v, 2); else if (v >= 1.0) sb_f64(v, 3); else sb_f64(v, 5);
}
function priceDecimals(step: f64): i32 { // enough decimals that the rounded row prices stay evenly spaced (the docked grid is contiguous only within 0.1% of its step)
  const d = i32(Math.ceil(Math.log(2000.0 / step) / Math.LN10)); return d < 2 ? 2 : d > 9 ? 9 : d;
}

// ── The heatmap: volume per UTC hour and day, the last heat_days days ──
function shiftHeat(by: i32): void { // a new day arrived: drop the oldest rows
  if (by >= heatDays) { for (let i = 0; i < MAX_DAYS * HOURS; i += 1) { heat[i] = 0.0; heatBars[i] = 0; } return; }
  for (let r = 0; r < heatDays; r += 1) for (let h = 0; h < HOURS; h += 1) {
    const from = r + by; heat[r * HOURS + h] = from < heatDays ? heat[from * HOURS + h] : 0.0; heatBars[r * HOURS + h] = from < heatDays ? heatBars[from * HOURS + h] : 0;
  }
}
function foldHeat(t: f64, volume: f64): void {
  if (isNaN(t) || isNaN(volume)) return;
  const day = i64(Math.floor(t / 86400.0)); const hour = i32(Math.floor((t - f64(day) * 86400.0) / 3600.0));
  if (dayBase < 0) dayBase = day - i64(heatDays - 1); // the first bar lands in the newest row
  if (day < dayBase) return;
  const newest = dayBase + i64(heatDays - 1);
  if (day > newest) { const by = i32(day - newest); shiftHeat(by); dayBase += i64(by); }
  const at = i32(day - dayBase) * HOURS + hour; heat[at] += volume; heatBars[at] += 1;
}
let civilMonth = 0; let civilDay = 0;
function civilFromDays(days: i64): void { // days since 1970-01-01 -> month and day of month (proleptic Gregorian)
  const z = days + 719468; const era = (z >= 0 ? z : z - 146096) / 146097; const doe = z - era * 146097;
  const yoe = (doe - doe / 1460 + doe / 36524 - doe / 146096) / 365; const doy = doe - (365 * yoe + yoe / 4 - yoe / 100);
  const mp = (5 * doy + 2) / 153; civilDay = i32(doy - (153 * mp + 2) / 5 + 1); civilMonth = i32(mp < 10 ? mp + 3 : mp - 9);
}
function jbTwoDigits(n: i32): void { if (n < 10) jbByte(0x30); jbUint(<u64>n); }
function percentile(at: i32, filled: i32): f64 { // the share of filled hours at or below this hour's volume, 0 to 100
  let below = 0; const v = heat[at];
  for (let i = 0; i < heatDays * HOURS; i += 1) if (heatBars[i] > 0 && heat[i] <= v) below += 1;
  return Math.round((100.0 * f64(below)) / f64(filled));
}
function writeHeat(): void { // [hour, day, percentile] triplets: hour on x, day on y (newest day first); the engine colours from the lowest to the highest value
  let filled = 0;
  for (let i = 0; i < heatDays * HOURS; i += 1) if (heatBars[i] > 0) filled += 1;
  if (filled == 0) return;
  let first = true;
  jbText("{\"rows\":[");
  for (let r = heatDays - 1; r >= 0; r -= 1) {
    civilFromDays(dayBase + i64(r));
    for (let h = 0; h < HOURS; h += 1) {
      const at = r * HOURS + h; if (heatBars[at] == 0) continue;
      if (!first) jbText(","); first = false;
      jbText("[\""); jbTwoDigits(h); jbText("\",\""); jbTwoDigits(civilMonth); jbText("-"); jbTwoDigits(civilDay); jbText("\","); jbNum(percentile(at, filled), 0); jbText("]");
    }
  }
  jbText("]}"); jbFlush(FRAME_HEAT_ROWS);
}

// ── The rolling profile ──
function spread(a: f64, b: f64, volume: f64, gridLo: f64, width: f64, base: i32, cells: i32, into: StaticArray<f64>): void { // [a, b]'s volume over the grid cells it overlaps, in proportion
  if (volume <= 0.0 || !(b >= a)) return;
  let first = i32(Math.floor((a - gridLo) / width)); let last = i32(Math.floor((b - gridLo) / width));
  if (first < 0) first = 0; if (last > cells - 1) last = cells - 1; if (first > cells - 1) first = cells - 1; if (last < 0) last = 0;
  if (first >= last || b - a <= 0.0) { into[base + first] += volume; return; } // one cell, or a level thinner than the grid
  for (let k = first; k <= last; k += 1) {
    const cellLo = gridLo + f64(k) * width; const cellHi = cellLo + width;
    const overlap = Math.min(b, cellHi) - Math.max(a, cellLo); if (overlap > 0.0) into[base + k] += (volume * overlap) / (b - a);
  }
}
function foldBar(candleLow: f64, candleHigh: f64): void { // this bar's cells into BINS bins across the bar's own price span, appended to the ring
  head = (head + 1) % window; if (count < window) count += 1; barT[head] = t;
  const n = in_profile_cells(); const base = head * BINS;
  for (let b = 0; b < BINS; b += 1) barBins[base + b] = 0.0;
  barLo[head] = NaN; barHi[head] = NaN;
  if (n < 4) return; // an empty block: the bar counts, its volume is unknown
  const cells = in_profile_view(); // this bar's cells in place: the first n values of the build's own buffer
  const typical = cells[(n / 8) * 4 + 1] - cells[(n / 8) * 4]; // the middle level's span: the market's level width (one stray level never sets it)
  if (typical > 0.0 && typical < levelHeight) levelHeight = typical;
  const tolerance = isFinite(levelHeight) ? levelHeight : 0.0; // a level may straddle the candle's edge by one step
  let lo = candleLow; let hi = candleHigh; // the candle's own span; the levels are read against it
  if (!(hi >= lo)) { lo = Infinity; hi = -Infinity; for (let i = 0; i + 3 < n; i += 4) { if (cells[i] < lo) lo = cells[i]; if (cells[i + 1] > hi) hi = cells[i + 1]; } } // no candle span: the cells' own
  if (!(hi >= lo)) return;
  if (hi == lo) hi = lo + Math.abs(lo) * 1e-9 + 1e-9;
  const binWidth = (hi - lo) / f64(BINS);
  for (let i = 0; i + 3 < n; i += 4) {
    const centre = (cells[i] + cells[i + 1]) * 0.5;
    if (centre < lo - tolerance || centre > hi + tolerance) continue; // a level the candle never touched: a stray print, ignored
    spread(cells[i], cells[i + 1], cells[i + 2] + cells[i + 3], lo, binWidth, base, BINS, barBins); // the level's volume over the bins it covers
  }
  barLo[head] = lo; barHi[head] = hi;
}
function buildProfile(): bool { // the ring's bars folded into `rows` price rows across the window's span; POC and value area
  let lo = Infinity; let hi = -Infinity;
  for (let k = 0; k < count; k += 1) { const i = (head + window - k) % window; if (isNaN(barLo[i])) continue; if (barLo[i] < lo) lo = barLo[i]; if (barHi[i] > hi) hi = barHi[i]; }
  if (!(hi > lo)) return false;
  rowHeight = (hi - lo) / f64(rows); // the setting's row height, or the market's level height when that is coarser (a thin-tick market)
  if (isFinite(levelHeight) && levelHeight > rowHeight) rowHeight = levelHeight;
  winLo = Math.floor(lo / rowHeight) * rowHeight; // rows sit on the level grid
  rowCount = i32(Math.ceil((hi - winLo) / rowHeight)); if (rowCount < 2) return false; if (rowCount > rows) rowCount = rows;
  lo = winLo;
  for (let r = 0; r < rowCount; r += 1) rowVol[r] = 0.0;
  let total = 0.0;
  for (let k = 0; k < count; k += 1) {
    const i = (head + window - k) % window; if (isNaN(barLo[i])) continue;
    const binWidth = (barHi[i] - barLo[i]) / f64(BINS); const base = i * BINS;
    for (let b = 0; b < BINS; b += 1) {
      const v = barBins[base + b]; if (v <= 0.0) continue;
      spread(barLo[i] + f64(b) * binWidth, barLo[i] + f64(b + 1) * binWidth, v, lo, rowHeight, 0, rowCount, rowVol); total += v; // the bin's volume over the rows it covers
    }
  }
  if (total <= 0.0) return false;
  pocRow = 0; for (let r = 1; r < rowCount; r += 1) if (rowVol[r] > rowVol[pocRow]) pocRow = r;
  lowRow = pocRow; highRow = pocRow; let inside = rowVol[pocRow]; // the value area grows from the POC toward the heavier neighbour
  while (inside < valueArea * total && (lowRow > 0 || highRow < rowCount - 1)) {
    const up = highRow < rowCount - 1 ? rowVol[highRow + 1] : -1.0; const down = lowRow > 0 ? rowVol[lowRow - 1] : -1.0;
    if (up >= down) { highRow += 1; inside += up; } else { lowRow -= 1; inside += down; }
  }
  poc = lo + (f64(pocRow) + 0.5) * rowHeight; vah = lo + f64(highRow + 1) * rowHeight; val = lo + f64(lowRow) * rowHeight;
  return true;
}
function writeProfile(): void { // prices strictly increasing (row centres), a value per row (0 where empty, so the grid stays whole), a colour per row
  const decimals = priceDecimals(rowHeight);
  jbText("{\"prices\":[");
  for (let r = 0; r < rowCount; r += 1) { if (r > 0) jbText(","); jbNum(winLo + (f64(r) + 0.5) * rowHeight, decimals); }
  jbText("],\"values\":[");
  for (let r = 0; r < rowCount; r += 1) { if (r > 0) jbText(","); jbNum(rowVol[r] > 0.0 ? rowVol[r] : 0.0, 2); }
  jbText("],\"colors\":[");
  for (let r = 0; r < rowCount; r += 1) { if (r > 0) jbText(","); jbText(r == pocRow ? "\"#f8c000\"" : r >= lowRow && r <= highRow ? "\"#38bdf8\"" : "\"#94a3b8\""); }
  jbText("]}"); jbFlush(FRAME_PROFILE_ROWS);
}
function drawLevel(which: i32, name: String, price: f64, ink: i32, from: f64): void { // the level as a line from the window's first bar to the live bar (extended to the axis) and its price tag
  levelLines[which].set(from, price, t, price).color(ink).width(which == 0 ? 2.0 : 1.0).style(which == 0 ? LineStyle.Solid : LineStyle.Dashed).extend(Extend.Right);
  sb_clear(); sb_text(name); sb_text(" "); sbPrice(price);
  tags[which].set(which == 0 ? 6.0 : 96.0, price).text(str_tag_sb).color(ink).fill(rgba(15, 23, 42, 235)); // the POC tag at the axis, VAH and VAL a step inward so close levels never overlap
}

// onStart() runs once before the first bar: read the params.
function onStart(): void { window = i32(p_window()); valueArea = p_value_area() / 100.0; rows = i32(p_rows()); heatDays = i32(p_heat_days()); memory.grow(1); } // headroom for the frame strings: the sandbox forbids growth after onStart()
// onBar() runs once per bar: fold the bar into the heatmap and the ring, rebuild the window profile; then the three levels as
// numbers on every bar, and the docked profile, the heatmap, the level lines and the tags on the live bar only.
function onBar(): void {
  t = bar.time(); const close = bar.close(); foldHeat(t, bar.volume()); foldBar(bar.low(), bar.high()); // the bar's open time, volume and span, from the chart's own candle: a level outside the span is ignored, so one bad level never stretches the profile
  if (!isNaN(close) && (close < 0.0 || close > 1.0 || Math.abs(close * 1000.0 - Math.round(close * 1000.0)) > 1e-6)) probLike = false;
  if (count < 2 || !buildProfile()) return; // no profile yet: nothing is written on this bar
  out_poc(poc); out_vah(vah); out_val(val);
  if (bar.isLast()) {
    writeProfile(); writeHeat(); sb_clear(); sb_text("POC "); sbPrice(poc); sb_text(" VAH "); sbPrice(vah); sb_text(" VAL "); sbPrice(val); str_readout_sb(); // the legend's readout
    const from = barT[(head + window - (count - 1)) % window]; // the oldest bar in the window
    drawLevel(0, "POC", poc, rgba(248, 192, 0, 255), from); drawLevel(1, "VAH", vah, rgba(56, 189, 248, 255), from); drawLevel(2, "VAL", val, rgba(56, 189, 248, 255), from);
  }
}How it works
One block per bar. input("profile", volume_profile.cells, { max_cells: 8192 }) delivers each bar's volume by price level as [low, high, buy, sell] tuples (about 280 levels per 15m bar and 860 per 1h bar on Binance Futures BTCUSDT). The rolling profile folds the last window (96) bars' blocks into rows (64) price bins between the window's low and high; a level outside the bar's own high-to-low span is ignored, so a stray print never stretches the profile, and each level's volume is spread over the bins it covers.
POC and the value area. The bin with the most volume is the point of control; the value area grows from it, bin by bin toward the heavier neighbour, until it holds value_area (70) percent of the window's volume. poc, vah and val are data-only outputs, one value per bar; on the live bar each is drawn as a line handle across the window it was measured on, extended right to the axis, with a price tag written through the one bounded slot to a right-anchored label. The price axis scales to the candles in view, not to the window the levels are measured on, so after a run-up VAL can sit below the pane with its line and tag; the same three prices are written into a second slot, readout, on the live bar, and render.legend("level_readout", { text: "readout" }) prints that line of words in the legend, in sky. On a prediction market the tags and the readout read as percent, like the axis.
Two frames, two views. frame("profile_rows") carries one row per bin and feeds plot.levels, the docked profile (the POC row amber, value-area rows sky, the rest slate); frame("heat_rows") carries one cell per hour and day for the last heat_days (7) days and feeds panel.heatmap, each cell the hour's percentile rank among the grid's hours (100 is the busiest).
Where it runs
Markets with a volume profile lane: crypto (Binance Futures, Binance spot, Hyperliquid) and Polymarket markets, where the profile shows the odds the crowd traded most. The heatmap reads best on charts finer than 1h; on 1h each cell is one bar.
When data is missing
Stocks and FX have no profile lane: the run stops with the toast Volume profile data is unavailable for '<title>' (the volume_profile source lane answered empty or was declined), so the indicator cannot compute., where <title> is the tab's title. A bar without a profile block counts toward the window with no volume; the first bar draws nothing (the profile needs two bars); hours with no bars stay empty in the heatmap.
Customize it
- A session profile. Reset the fold at a UTC boundary (the Session map window test) instead of rolling the last
windowbars. - Finer rows.
rowsup to 128; the rows never go finer than the market's own price levels. - A wider value area.
value_areaup to 95 percent.
Run it
- In the editor's Explorer, press the Templates icon ("Browse starter templates") and pick Volume Profile and Value Area under Beyond the time axis.
- Press Run on a crypto chart finer than 1h, such as BTCUSDT on Binance Futures at 15m: the profile docks on the price axis, the three levels draw with their tags, and the heatmap appears below the chart.
- At the editor's Console prompt, type
poc,vahandvalto read the three levels on the newest bar.
Concepts used
- Volume profile for the celled profile input and the block layout
- Cards, frames and panels for frames,
plot.levelsandpanel.heatmap - Drawing objects for line and label handles extended to the axis