Liquidation bursts
Long and short liquidations in USD in their own pane under the chart, one column per bar: long liquidations (forced sells) in the down colour at its foot and short liquidations (forced buys) in the up colour stacked on them, so the column is the bar's total and the legend reads each side in dollars ("Long liquidations $14.1M").
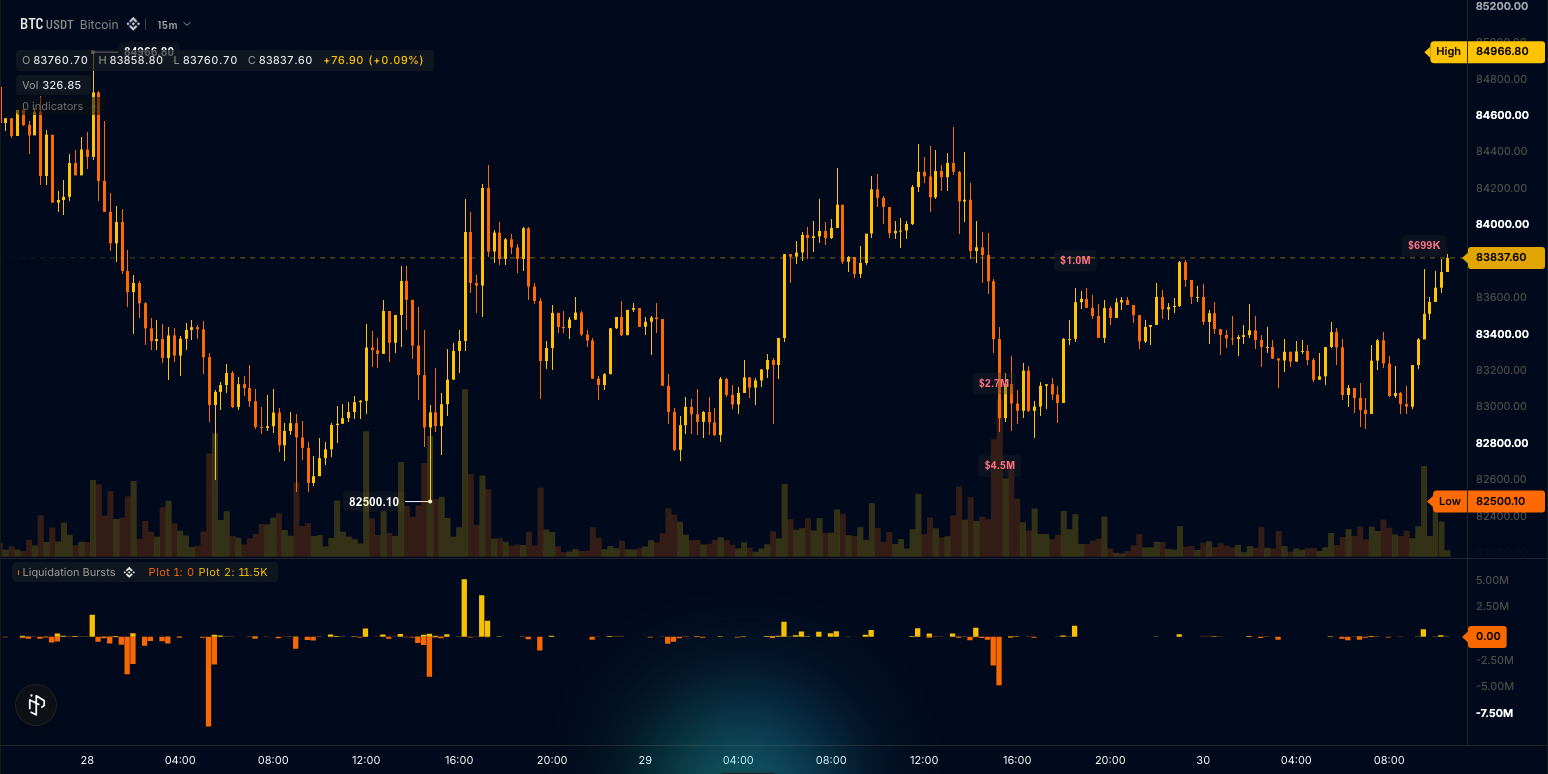
A bar whose liquidations on one side jump past the rolling norm (a z-score over the window) gets a bubble on price with its size printed on it, "12.4M" or "850K": a bubble in the down colour under the bar's low for a long flush, one in the up colour over its high for a short squeeze, its area growing with the size. One bubble per bar, the bigger side, and every burst in the window keeps its bubble.
The parts are two liquidations inputs split by side (Data sources), two histogram outputs stacked into one column, the Sma and Stdev helpers behind the z-score (TA library), and one plot.marks section for the bubbles (Marks, spans and rays). This is also the liquidation-bursts template: the Liquidation Bursts card under Order flow in the editor's starter list, and it compiles as written.
The wrun indicator
// Liquidation Bursts: long and short liquidations in USD in their own pane, one column per bar, longs (forced sells)
// in the down colour at its foot and shorts (forced buys) in the up colour stacked on them. A bar whose liquidations
// jump past the rolling norm (a z-score over the window) gets a bubble on price with the size printed on it: a long
// flush in the down colour under the bar's low, a short squeeze in the up colour over its high, the bubble's area
// growing with the size in USD from the bubble unit. The bubbles are one plot.marks section, which draws in the
// browser only, so the template cannot be published as Protected.

param.number("burst_z", 3.0, { min: 1.0, max: 8.0, step: 0.1, label: "Burst threshold in deviations", description: "A bar is a burst when its liquidations sit this many deviations above the window's mean" });
param.int("window", 96, { min: 10, max: 500, label: "Window in bars", description: "Bars the mean and deviation are taken over" });
param.number("bubble_unit", 1000000, { min: 1, max: 1000000000, label: "Bubble unit in USD", description: "A burst of this many USD or less draws the smallest bubble; the area grows with the size, up to the largest bubble at about 20 times this. $1M suits BTC perps, whose smallest bursts on a 1h chart run near $1M" });
legend({ title: "({{window}})" }); // the words after the name in the legend: the window, read by name
input("close", ohlcv.close); // the primary input: the chart's own candles define the grid every other input lines up on
input("long_liq", liquidations.liquidations, { side: "SELL", missing: "zero" }); // longs are liquidated by forced sells; a bar with none reads 0
input("short_liq", liquidations.liquidations, { side: "BUY", missing: "zero" }); // shorts are liquidated by forced buys
output("long_liqs", histogram, lower, { color: "theme.down", stack: "liqs", label: "Long liquidations", format: "usd" }); // at the foot of the column, in dollars
output("short_liqs", histogram, lower, { color: "theme.up", stack: "liqs", label: "Short liquidations", format: "usd" }); // stacked on the longs: the column is the bar's total
output("burst", none); // data-only: -1 a long flush, +1 a short squeeze, 0 none; read it in the Console or fire an alert(...) on it
plot.marks({ name: "bursts", slots: 1, size: { law: "sqrt", unit: "@bubble_unit" }, text: { mode: 2, format: "compact", min_px: 0 }, colors: ["theme.down", "theme.up"] }); // one bubble on a burst bar, its size printed on it ("12.4M"): side 0 a long flush in the down colour, 1 a short squeeze in the up colour
string("text", { max_bytes: 40 }); // the one line of words when the market has no liquidations
handles.label({ anchor: "top_right", align: "right", color: "theme.muted", size: 11 }); // the notice, in pane pixels from the top-right corner

const notice = draw.label(0); // the one handle: the notice, allocated once

let burstZ = 3.0; // settings, read in onStart()
let longMean = new Sma(96); // rebuilt in onStart()
let longDev = new Stdev(96);
let shortMean = new Sma(96);
let shortDev = new Stdev(96);
let liquidationsSeen = 0.0; // every liquidation seen: 0 means the market has none
let rangeAvg = NaN; // a running mean of high - low: the bubble's distance from the bar

function isBurst(value: f64, mean: f64, dev: f64): bool { // past the norm, with a norm to speak of
  return value > 0.0 && !isNaN(mean) && !isNaN(dev) && dev > 0.0 && value >= mean + burstZ * dev;
}

function onStart(): void {
  burstZ = p_burst_z();
  const window = i32(p_window());
  longMean = new Sma(window);
  longDev = new Stdev(window);
  shortMean = new Sma(window);
  shortDev = new Stdev(window);
}

// onBar() runs once per bar: both sides into their norms, the burst test per side, the bubble's place; then the two stacked
// histograms on every bar, a bubble on a burst bar, and the notice on the live bar only.
function onBar(): void {
  const high = bar.high();
  const low = bar.low();
  const longLiq = in_long_liq();
  const shortLiq = in_short_liq();
  liquidationsSeen += longLiq + shortLiq;
  const range = high - low;
  rangeAvg = isNaN(rangeAvg) ? range : rangeAvg + (range - rangeAvg) * 0.1;
  const longBurst = isBurst(longLiq, longMean.update(longLiq), longDev.update(longLiq));
  const shortBurst = isBurst(shortLiq, shortMean.update(shortLiq), shortDev.update(shortLiq));
  let burst = 0;
  let bubbleY = NaN;
  let bubbleUsd = NaN;
  if (longBurst && (!shortBurst || longLiq >= shortLiq)) { // one bubble per bar: the bigger side
    burst = -1;
    bubbleY = low - rangeAvg * 0.6;
    bubbleUsd = longLiq;
  } else if (shortBurst) {
    burst = 1;
    bubbleY = high + rangeAvg * 0.6;
    bubbleUsd = shortLiq;
  }
  out_long_liqs(longLiq);
  out_short_liqs(shortLiq);
  out_burst(f64(burst));
  if (burst != 0) out_bursts_mark(0, bubbleY, bubbleUsd, burst < 0 ? 0 : 1, 0, 0); // the bubble at its price with the size in USD; side 0 a flush, 1 a squeeze; no fill count; centred on the bar
  if (bar.isLast() && liquidationsSeen <= 0.0) { // the market served no liquidations at all: say so once, top right
    sb_clear();
    sb_text("No liquidations on this market");
    notice.set(16, 14).text(str_text_sb);
  }
}
How it works
A liquidation's side is the forced order's side. input("long_liq", liquidations.liquidations, { side: "SELL", missing: "zero" }) reads longs liquidated by forced sells and its BUY twin reads shorts liquidated by forced buys, the same reading the native Liquidations indicator uses for its Longs and Shorts. A bar with none reads 0. long_liqs and short_liqs share stack: "liqs": the longs fill the foot of each column in the down colour and the shorts stack on them in the up colour, both written positive and printed in dollars (format: "usd"), so the column's height is the bar's total and neither side reads negative.
A burst is a z-score. Each side's liquidations against their mean and standard deviation over window (96) bars give a z-score; a bar is a burst when the bigger side sits burst_z (3.0) deviations above the mean. burst carries -1 for a long flush, +1 for a short squeeze, 0 otherwise: a data-only signal a declared alert can fire on.
The bubble is the size. plot.marks({ name: "bursts", slots: 1, ... }) declares one batched section of one mark a bar, and the build generates out_bursts_mark(slot, price, qty, side, fills, offsetMs). On a burst bar onBar() writes slot 0: the price 0.6 of the running mean range under the bar's low for a flush or over its high for a squeeze, the size in USD as the quantity, side 0 for a flush (the first colour, the down colour) or 1 for a squeeze (the up colour), no fill count and no offset (the bubble sits on the bar's centre). The chart grows the bubble's area with the quantity over size.unit, which "@bubble_unit" binds to the Bubble unit setting: a burst of that many USD or less draws the smallest bubble and one about 20 times it the largest. The default, $1M, fits BTC perps, whose bursts on a 1h chart run from about $1M to $20M; lower it on a thinner market so its bursts do not all draw the smallest bubble. text: { mode: 2, format: "compact", min_px: 0 } prints the size on every bubble, however small ("12.4M", "850K", "920"): a caption is the number alone, with no "$". One bubble per bar, the bigger side, and every burst in the window keeps its bubble: the record rides the bar's own outputs, so there are no ids to recycle and nothing to cap. A batched section draws in the browser only: an indicator with one cannot be published as Protected for now.
Where it runs
Perps (Binance Futures, Hyperliquid). The pane's axis is in USD. The threshold is a ratio to the market's own norm, so a thin market whose bars mostly carry no liquidations marks small sizes ("413" on a quiet alt) while BTC marks millions; raise burst_z to keep only the biggest, and lower Bubble unit to grow a thin market's bubbles. It runs in your browser: the bubbles are a batched section, which an indicator published as Protected cannot carry yet.
When data is missing
Spot, prediction markets, stocks and FX have no liquidations: both histograms stay at zero and one muted line of words sits at the top right of the chart, "No liquidations on this market".
Customize it
- Fewer bubbles. Raise
burst_z; the histograms keep every bar. - A longer norm.
windowup to 500 bars smooths the mean and the deviation. - Both sides marked. Declare
slots: 2and write slot 1 for the smaller side when both burst; each slot adds three outputs. - Alert on a burst. Bind
burstto aconstand declarealert("liquidation_burst", { when: ... }): it fires on the bar a burst starts. Once the indicator is published and on a chart, the signal is in the chart's alert dialog (Alerts).
Run it
- In the editor's Explorer, press the Templates icon ("Browse starter templates") and pick Liquidation Bursts under Order flow.
- Press Run on a perp, such as BTCUSDT on Binance Futures: the stacked columns fill and the bursts get their bubbles on price.
- At the editor's Console prompt, type
last 60 burstto read the burst sign of the last 60 bars.
Concepts used
- Data sources for the
liquidationssource and its sides - TA library for
SmaandStdev - Marks, spans and rays for the
plot.markssection, its size law and its caption - Drawing objects for the notice's label handle and the text slot