Options odds cloud
Where the options market expects price to settle at the chosen expiry, drawn on the price axis as one smooth profile.
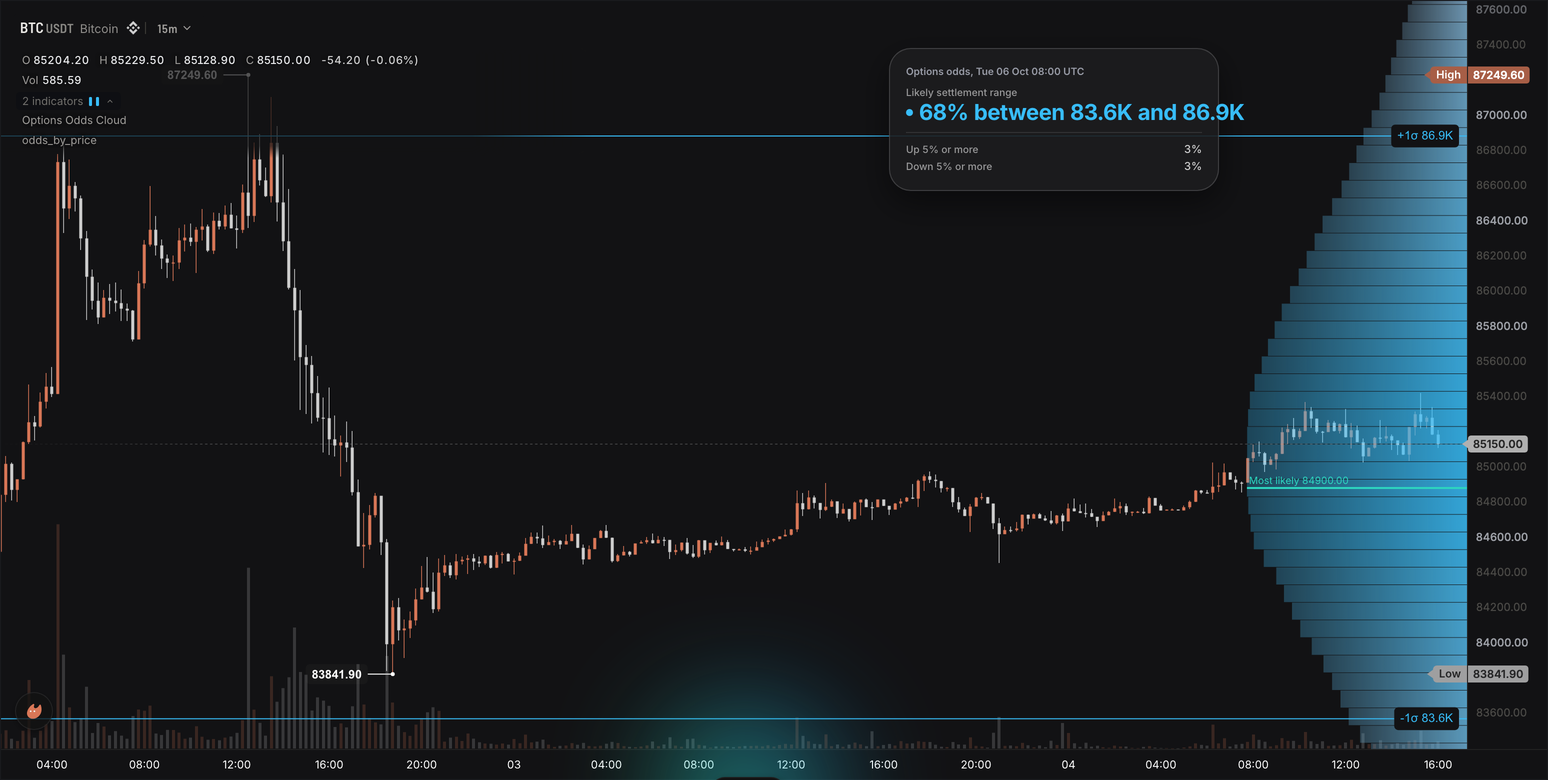
A cloud docked on the right of the price pane, one bar per price row, its length the chain's implied odds that price settles in that row: the core is sky, the tails fade to slate, every bar fades from the axis to its tip, and a teal point-of-control line marks the most likely row, with a teal tag beside the price axis naming its price at the row's own resolution ("Most likely 85.26K"). The rows follow the price scale on the chart: they span the loaded bars' low to high plus a margin, never wider than three standard deviations either side of spot, at least rows of them, so a 1m chart gets rows a few dollars apart and a 1h chart the whole bell; on a fine chart the visible slice of the bell is nearly flat, which is the odds, not a fault. Two solid sky lines run across the chart at the 16% and 84% prices, tagged "+1σ 87.0K" and "-1σ 83.7K": the middle 68% of the outcomes. Two dotted slate lines sit at the 2.5% and 97.5% prices, tagged "+2σ" and "-2σ" with their prices: the middle 95%. A card at the top left, under the legend and clear of the newest candles, in the glass look (a translucent card with round corners, dark on a dark chart and light on a light one) set in the app's own type, carries the odds and the expiry read as its title ("68% likely, Tue 06 Oct 08:00 UTC"), the band alone as its headline ("83.7K to 87.0K", labelled "Range at expiry"), then the odds of a 5% move either way ("Up 5% or more: 2%", "Down 5% or more: 2%"). Hovering a cloud row opens its own odds, to two decimals.
The parts are a celled options_chain.cells input read on the live bar (Options kit), a frame feeding plot.levels docked on the price axis with per-row colours, a gradient alpha profile and a poc line at the row the frame names, its docked tag off (Docked profiles), four declared draw.line lines and five draw.label tags in the knockout style, placed from the newest bar (Run-level drawings), and a render.hud card with look: "glass" and font_family: "ui" of a text-drawn headline pill and a rows tile over string slots (HUD cards, Looks, Blocks and tiles). This is also the options-odds-cloud template: the Options Odds Cloud card under Beyond the time axis in the editor's starter list, and it compiles as written.
The wrun indicator
// Options Odds Cloud: where the options market expects price to settle at the chosen expiry, docked on the price
// axis as one smooth profile. Each row is the chain's implied odds that price settles there: a ramp from slate tails
// to a sky core, every bar fading from its root to its tip so it reads as a cloud, the most likely row marked by a
// teal point-of-control line with a "Most likely 85.18K" knockout tag beside the price axis. The rows follow the
// price scale the trader sees: the loaded bars' high..low widened by a margin, never wider than spot times
// exp(+-3 sigma), at least 'rows' rows across it, so the cloud is as fine on a 1m chart as on a 1h chart. The 16% and
// 84% prices (the middle 68%) run across the chart as solid sky lines with knockout tags "+1σ 87.9K" / "-1σ 81.2K";
// the 2.5% and 97.5% prices are dotted slate lines tagged "+2σ" / "-2σ" (every line shows whenever the pane covers
// it). A card at the top left, under the legend, titled "68% likely" with the expiry read, carries the 68% band as
// its headline ("83.7K to 87.0K") and the odds of a 5% move either way. The chain is live only: history bars only
// widen the loaded price range; everything else is measured on the last bar, from the chain's own clock (the moment
// its greeks were priced, never the bar's open), so the odds do not depend on the chart's interval.

section("Expiry and grid");
param.int("target_days", 2, { min: 1, max: 90, label: "Days to expiry", description: "Expiry read: the listed expiry at least 12 h away whose distance in days is closest to this; a higher timeframe wants a longer horizon" });
param.int("rows", 90, { min: 60, max: 160, label: "Cloud rows", description: "Rows in the docked cloud, at least: spread over the loaded bars' price range plus the margin, within spot times exp(+-3 sigma)" });
param.int("margin", 25, { min: 0, max: 100, label: "Margin, percent", description: "How far the cloud reaches past the loaded bars' high and low, percent of that range" });
section("Look");
param.color("core_ink", "#38bdf8", { label: "Cloud core" });
param.color("tail_ink", "#94a3b8", { label: "Cloud tails" });
param.color("peak_ink", "#2dd4bf", { label: "Most likely row" });
input("close", ohlcv.close); // the chart's own close: the bar grid, and spot when the chain carries no underlying
input("chain", options_chain.cells, { max_cells: 4000, venue: "deribit", description: "The coin's Deribit options chain, one tuple per listed contract, live bar only" }); // [strike, expiry_ms, side, oi, gamma, delta, mark_iv, underlying, multiplier, vega]; side +1 call, -1 put; mark_iv in percent a year
// The readings, data-only: the card and the Console read them. Each is NaN on history bars.
output("p_up_move", none, overlay, { format: "%", description: "Odds of settling 5% or more above spot at the expiry read, percent; live bar only" });
output("p_down_move", none, overlay, { format: "%", description: "Odds of settling 5% or more below spot at the expiry read, percent" });
output("band_low", none, overlay, { format: "price", description: "The 16% price: the lower edge of the 68% band" });
output("band_high", none, overlay, { format: "price", description: "The 84% price: the upper edge of the 68% band" });
output("tail_low", none, overlay, { format: "price", description: "The 2.5% price: the lower edge of the 95% band" });
output("tail_high", none, overlay, { format: "price", description: "The 97.5% price: the upper edge of the 95% band" });
output("most_likely", none, overlay, { format: "price", description: "The grid row holding the most odds, the cloud's peak" });
output("iv_atm", none, overlay, { format: "%", description: "At-the-money implied volatility of the expiry read, percent a year" });
output("days_to_expiry", none, overlay, { format: "0.0", description: "Days from the chain's read time to the expiry read" });
output("t_first", none, overlay, { description: "The first loaded bar's open time, epoch seconds: where the lines start" });
output("t_last", none, overlay, { description: "The live bar's open time, epoch seconds: where the lines and tags end" });
string("title_text", { max_bytes: 48 }); // the card's title: the odds and the expiry read, "68% likely, Fri 10 Oct 08:00 UTC"
string("band_text", { max_bytes: 32 }); // the card's headline: the 68% band, "81.2K to 87.9K"
string("up_text", { max_bytes: 16 }); // the card's rows: "12%"
string("down_text", { max_bytes: 16 });
string("tag_band_high", { max_bytes: 24 }); // the four price tags
string("tag_band_low", { max_bytes: 24 });
string("tag_tail_high", { max_bytes: 24 });
string("tag_tail_low", { max_bytes: 24 });
string("tag_most_likely", { max_bytes: 32 }); // the cloud's peak: "Most likely 85.18K", "Most likely 85176" on rows under 10 dollars
string("notice", { max_bytes: 48 }); // the one sentence on a market without a chain
handles.label({ anchor: "top_right", align: "right", size: 11, color: "#94a3b8", style: "knockout", padding: 6, safe_area: true }); // the notice, in pane pixels from the top-right corner
const cloud_rows = frame("cloud_rows", { max_bytes: 16384 }); // the docked cloud: one row per grid price
// The cloud: one bar per grid price docked right, a tenth of the pane wide so the newest candles stay readable, each
// row in its own colour from the frame (the slate-to-sky ramp), every bar fading from its root at the axis to its tip
// (the gradient's alpha profile), the most likely row marked by the point-of-control line in teal (its tag is the
// knockout label below, beside the axis), a hover card per row printing the row's odds.
plot.levels({ name: "odds_by_price", frame: cloud_rows, dock: "right", width_frac: 0.1, labels: false, color: "@core_ink", opacity: 0.85, gradient: ["#38bdf8ff", "#38bdf859"], format: "%", decimals: 2, hover: true, poc: true, poc_color: "@peak_ink", poc_width: 2, poc_extend: "dock", poc_label: false });
// The lines across the whole pane, placed from the newest bar: the 68% band's edges solid sky, the 95% band's
// dotted slate; each shows whenever the pane covers it (an overlay never widens the price pane).
draw.line("band_high_line", { x1: "t_first", y1: "band_high", x2: "t_last", y2: "band_high", color: "#38bdf8", width: 1, line_style: "solid", extend: "both" });
draw.line("band_low_line", { x1: "t_first", y1: "band_low", x2: "t_last", y2: "band_low", color: "#38bdf8", width: 1, line_style: "solid", extend: "both" });
draw.line("tail_high_line", { x1: "t_first", y1: "tail_high", x2: "t_last", y2: "tail_high", color: "#94a3b8", width: 1, line_style: "dotted", extend: "both" });
draw.line("tail_low_line", { x1: "t_first", y1: "tail_low", x2: "t_last", y2: "tail_low", color: "#94a3b8", width: 1, line_style: "dotted", extend: "both" });
// The tags: knockout labels (a box in the chart's background colour, so a line never runs through its own text),
// right-aligned and riding beside the price axis as the chart scrolls.
draw.label("tag_band_high", { x: "t_last", y: "band_high", text: "tag_band_high", color: "#38bdf8", style: "knockout", align: "right", valign: "middle", font_weight: "medium", sticky_right: true });
draw.label("tag_band_low", { x: "t_last", y: "band_low", text: "tag_band_low", color: "#38bdf8", style: "knockout", align: "right", valign: "middle", font_weight: "medium", sticky_right: true });
draw.label("tag_tail_high", { x: "t_last", y: "tail_high", text: "tag_tail_high", color: "#94a3b8", style: "knockout", align: "right", valign: "middle", font_weight: "medium", sticky_right: true });
draw.label("tag_tail_low", { x: "t_last", y: "tail_low", text: "tag_tail_low", color: "#94a3b8", style: "knockout", align: "right", valign: "middle", font_weight: "medium", sticky_right: true });
// The most likely row's tag rides in the same column beside the price axis, never on it: a knockout in teal.
draw.label("tag_most_likely", { x: "t_last", y: "most_likely", text: "tag_most_likely", color: "#2dd4bf", style: "knockout", align: "right", valign: "middle", font_weight: "medium", sticky_right: true });
// The card, in the glass look with the app's own type (the look's rounded stack is not on every system): pinned at
// the top left under the legend, clear of the newest candles and the cloud on the right, the title carrying the odds
// and the expiry read ({{title_text}} reads the slot of that name), the 68% band alone as the headline, then the odds
// of a 5% move either way as two rows; 250 px fits the longest band ("112.3K to 118.9K") with the look's padding. The
// Style page's Look row switches it (broadsheet is the second look this card was shot in).
render.hud("odds", {
  position: "top_left",
  look: "glass",
  font_family: "ui",
  title: "{{title_text}}",
  columns: 1,
  width: 250,
  safe_area: true,
  tiles: [
    tile.pill("Range at expiry", "band_text", { headline: true, color: "#38bdf8", font_size: 24, draw: "text" }),
    tile.rows([
      ["Up 5% or more", "up_text"],
      ["Down 5% or more", "down_text"],
    ]),
  ],
});

const TUPLE = 10; // f64s per contract
const MAX_STRIKES = 512; // distinct strikes one expiry may list
const MAX_EXPIRIES = 64; // distinct live expiries
const MAX_ROWS = 512; // the levels frame's cap; the rows setting stays far under it
const HALF_DAY_MS = 43200000.0;
const DAY_MS = 86400000.0;
const YEAR_MS = 31536000000.0;
const MOVE = 0.05; // the move the card prices: 5% either way
const strikePrice = new StaticArray<f64>(MAX_STRIKES); // the strike table of the expiry read, sorted ascending
const strikeIv = new StaticArray<f64>(MAX_STRIKES); // the out-of-the-money implied volatility at each strike, a fraction a year
const expiryMs = new StaticArray<f64>(MAX_EXPIRIES); // the live expiries, sorted ascending
const rowPrice = new StaticArray<f64>(MAX_ROWS); // the cloud grid: row centres
const rowProb = new StaticArray<f64>(MAX_ROWS); // the probability of settling inside each row
const edgeAbove = new StaticArray<f64>(MAX_ROWS + 1); // P(settle above the row's lower edge), one more than the rows
const notice = draw.label(0); // the one sentence on a market without a chain; handle objects allocate once

let targetDays = 2.0; // settings, read in onStart()
let rowsWanted = 90;
let marginShare = 0.25; // the margin setting as a share of the loaded range
const coreRgb = new StaticArray<i32>(3); // the ramp's inks as r, g, b: read from the colour settings in onStart()
const tailRgb = new StaticArray<i32>(3);
let close: f64 = NaN; // this bar
let t: f64 = NaN;
let firstT: f64 = NaN; // the first bar's open time: where the lines start
let loadedHigh: f64 = -Infinity; // the loaded bars' price range: the cloud's rows follow it
let loadedLow: f64 = Infinity;
let strikeCount = 0;
let expiryCount = 0;
let expiry: f64 = NaN; // the expiry read, epoch ms
let spot: f64 = NaN; // the chain's underlying
let years: f64 = NaN; // time to expiry in years, from the chain's clock
let ivAtm: f64 = NaN; // a fraction a year
let sigmaT: f64 = NaN; // iv_atm times sqrt(T): one standard deviation of the log price
let gridLo: f64 = NaN;
let gridStep: f64 = NaN;
let gridRows = 0;
let peakRow = -1;
let q025: f64 = NaN; // the quantile prices
let q16: f64 = NaN;
let q84: f64 = NaN;
let q975: f64 = NaN;
let pUpMove: f64 = NaN; // odds of a 5% move, percent
let pDownMove: f64 = NaN;

// ── The strike table: sorted insertion, one row per strike ──
function strikeSlot(strike: f64): i32 { // the row of this strike, inserted when new; -1 when the table is full
  let lo = 0;
  let hi = strikeCount;
  while (lo < hi) {
    const mid = (lo + hi) >> 1;
    if (strikePrice[mid] < strike) lo = mid + 1;
    else hi = mid;
  }
  if (lo < strikeCount && strikePrice[lo] == strike) return lo;
  if (strikeCount >= MAX_STRIKES) return -1;
  for (let i = strikeCount; i > lo; i -= 1) {
    strikePrice[i] = strikePrice[i - 1];
    strikeIv[i] = strikeIv[i - 1];
  }
  strikePrice[lo] = strike;
  strikeIv[lo] = NaN;
  strikeCount += 1;
  return lo;
}

function noteExpiry(ms: f64): void { // sorted insertion of a distinct live expiry
  let lo = 0;
  let hi = expiryCount;
  while (lo < hi) {
    const mid = (lo + hi) >> 1;
    if (expiryMs[mid] < ms) lo = mid + 1;
    else hi = mid;
  }
  if (lo < expiryCount && expiryMs[lo] == ms) return;
  if (expiryCount >= MAX_EXPIRIES) return;
  for (let i = expiryCount; i > lo; i -= 1) expiryMs[i] = expiryMs[i - 1];
  expiryMs[lo] = ms;
  expiryCount += 1;
}

// ── The math: the smile, the normal, the odds ──
function ivAt(price: f64): f64 { // implied volatility at any price: linear between neighbouring strikes, flat beyond the ends
  if (strikeCount == 0) return NaN;
  if (price <= strikePrice[0]) return strikeIv[0];
  if (price >= strikePrice[strikeCount - 1]) return strikeIv[strikeCount - 1];
  let lo = 0;
  let hi = strikeCount - 1;
  while (hi - lo > 1) {
    const mid = (lo + hi) >> 1;
    if (strikePrice[mid] <= price) lo = mid;
    else hi = mid;
  }
  const share = (price - strikePrice[lo]) / (strikePrice[hi] - strikePrice[lo]);
  return strikeIv[lo] + (strikeIv[hi] - strikeIv[lo]) * share;
}

function normalCdf(x: f64): f64 { // the standard normal CDF through Abramowitz-Stegun 7.1.26 (error under 2e-7)
  const z = Math.abs(x) / Math.SQRT2;
  const u = 1.0 / (1.0 + 0.3275911 * z);
  const poly = u * (0.254829592 + u * (-0.284496736 + u * (1.421413741 + u * (-1.453152027 + u * 1.061405429))));
  const erf = 1.0 - poly * Math.exp(-z * z);
  return x >= 0.0 ? 0.5 * (1.0 + erf) : 0.5 * (1.0 - erf);
}

function pAbove(price: f64): f64 { // the chain's odds that price settles above this price: N(d2) with the smile's volatility at the price
  if (!(price > 0.0)) return 1.0;
  const iv = ivAt(price);
  if (!(iv > 0.0)) return NaN;
  const d2 = (Math.log(spot / price) - 0.5 * iv * iv * years) / (iv * Math.sqrt(years));
  return normalCdf(d2);
}

function priceWhereAbove(target: f64): f64 { // the price with P(above) = target, by bisection over eight standard deviations
  let lo = spot * Math.exp(-8.0 * sigmaT);
  let hi = spot * Math.exp(8.0 * sigmaT);
  for (let i = 0; i < 64; i += 1) {
    const mid = 0.5 * (lo + hi);
    if (pAbove(mid) > target) lo = mid;
    else hi = mid;
  }
  return 0.5 * (lo + hi);
}

function niceStepAtMost(raw: f64): f64 { // the largest round step at or under raw: 1, 1.5, 2, 2.5, 3, 4, 5, 6, 8 times a power of ten
  let mag = Math.pow(10.0, Math.floor(Math.log(raw) / Math.LN10));
  if (mag > raw) mag /= 10.0; // the logarithm rounded up across a power of ten
  const m = raw / mag;
  if (m >= 8.0) return 8.0 * mag;
  if (m >= 6.0) return 6.0 * mag;
  if (m >= 5.0) return 5.0 * mag;
  if (m >= 4.0) return 4.0 * mag;
  if (m >= 3.0) return 3.0 * mag;
  if (m >= 2.5) return 2.5 * mag;
  if (m >= 2.0) return 2.0 * mag;
  if (m >= 1.5) return 1.5 * mag;
  return mag;
}

function priceDecimals(step: f64): i32 { // enough decimals that the grid's row prices stay evenly spaced when parsed (the docked grid is contiguous only within 0.1% of its step)
  const d = i32(Math.ceil(Math.log(2000.0 / step) / Math.LN10));
  return d < 2 ? 2 : d > 9 ? 9 : d;
}

// ── The chain's clock: when its gammas were priced, not the bar's open ──
// The chart prices each contract's gamma by Black-Scholes from its mark IV and underlying at the moment it reads the
// chain, so the contract nearest the money (|delta| nearest 0.5), solved for the time to expiry its gamma implies,
// names that moment. A venue that serves its own greeks gives no such answer: the bar's open stands in.
function chainClockMs(cells: StaticArray<f64>, n: i32, barOpenMs: f64): f64 {
  let best = -1;
  let bestGap = 0.25; // |delta| within 0.25 of 0.5
  let nearest = Infinity; // the nearest listed expiry: the chain lists none that has passed
  for (let i = 0; i + TUPLE - 1 < n; i += TUPLE) {
    if (cells[i + 1] < nearest) nearest = cells[i + 1];
    const gap = Math.abs(Math.abs(cells[i + 5]) - 0.5);
    if (cells[i] > 0.0 && cells[i + 4] > 0.0 && cells[i + 6] > 0.0 && cells[i + 7] > 0.0 && gap < bestGap) {
      bestGap = gap;
      best = i;
    }
  }
  if (best < 0) return barOpenMs;
  const sigma = cells[best + 6] > 3.0 ? cells[best + 6] / 100.0 : cells[best + 6]; // percent a year, or a fraction
  const m = Math.log(cells[best + 7] / cells[best]);
  const q = cells[best + 4] * cells[best + 7]; // gamma times spot = pdf(d1) / u, u = sigma * sqrt(T), d1 = m / u + u / 2
  let lo = Math.sqrt(2.0 * (Math.sqrt(1.0 + m * m) - 1.0)); // where pdf(d1) / u peaks: past it the gamma falls as T grows
  let hi = 10.0;
  for (let k = 0; k < 80; k += 1) { // bisection on the falling side
    const u = 0.5 * (lo + hi);
    const d1 = m / u + 0.5 * u;
    if (Math.exp(-0.5 * d1 * d1) / (2.5066282746310002 * u) > q) lo = u;
    else hi = u;
  }
  const u = 0.5 * (lo + hi);
  const clock = cells[best + 1] - ((u * u) / (sigma * sigma)) * 31536000000.0;
  return clock > barOpenMs - 86400000.0 && clock < nearest ? clock : barOpenMs; // anything else is no reading
}

// ── The chain, measured on the live bar ──
function measureChain(n: i32): bool { // n = f64 cells in the live block; false when nothing usable is listed
  const cells = in_chain_view(); // the live chain in place: the first n values of the build's own buffer
  const nowMs = chainClockMs(cells, n, t * 1000.0); // the chain's clock: a coarse bar's open would stretch the time to expiry
  expiryCount = 0;
  for (let i = 0; i + TUPLE - 1 < n; i += TUPLE) if (cells[i + 1] >= nowMs + HALF_DAY_MS) noteExpiry(cells[i + 1]); // the expiries at least 12 h away
  if (expiryCount == 0) return false;
  let best = 0;
  let bestDistance = Infinity;
  for (let k = 0; k < expiryCount; k += 1) { // the expiry whose distance in days is closest to the setting; ties keep the earlier
    const distance = Math.abs((expiryMs[k] - nowMs) / DAY_MS - targetDays);
    if (distance < bestDistance) {
      bestDistance = distance;
      best = k;
    }
  }
  expiry = expiryMs[best];
  spot = NaN;
  for (let i = 0; i + TUPLE - 1 < n; i += TUPLE) { // spot: the chain's own underlying at that expiry
    if (cells[i + 1] == expiry && cells[i + 7] > 0.0) {
      spot = cells[i + 7];
      break;
    }
  }
  if (!(spot > 0.0)) spot = close;
  if (!(spot > 0.0)) return false;
  strikeCount = 0;
  for (let i = 0; i + TUPLE - 1 < n; i += TUPLE) { // one volatility per strike, from the out-of-the-money contract: puts below spot, calls at or above
    if (cells[i + 1] != expiry) continue;
    const strike = cells[i];
    if (!(strike > 0.0)) continue;
    const isCall = cells[i + 2] > 0.0;
    if (isCall != (strike >= spot)) continue;
    let iv = cells[i + 6];
    if (!(iv > 0.0)) continue;
    if (iv > 3.0) iv /= 100.0; // the venue serves percent a year (45.2); a fraction (0.452) passes through
    const slot = strikeSlot(strike);
    if (slot < 0) continue;
    strikeIv[slot] = iv;
  }
  if (strikeCount == 0) return false;
  years = (expiry - nowMs) / YEAR_MS;
  if (!(years > 0.0)) return false;
  ivAtm = ivAt(spot);
  if (!(ivAtm > 0.0)) return false;
  sigmaT = ivAtm * Math.sqrt(years);
  q025 = priceWhereAbove(0.975);
  q16 = priceWhereAbove(0.84);
  q84 = priceWhereAbove(0.16);
  q975 = priceWhereAbove(0.025);
  pUpMove = pAbove(spot * (1.0 + MOVE)) * 100.0;
  pDownMove = (1.0 - pAbove(spot * (1.0 - MOVE))) * 100.0;
  // The grid follows the price scale the trader sees: the loaded bars' low..high widened by the margin on each side
  // (never thinner than a tenth of a standard deviation, for a flat or one-bar window), clamped to spot times
  // exp(+-3 sigma), at the largest round step that puts at least 'rows' rows across it. A 1m chart gets rows a few
  // dollars apart over its few hundred dollars of range, a 1h chart the whole bell; the odds are the same.
  const bandLo = spot * Math.exp(-3.0 * sigmaT);
  const bandHi = spot * Math.exp(3.0 * sigmaT);
  let lo = bandLo;
  let hi = bandHi;
  const range = loadedHigh - loadedLow;
  if (range >= 0.0) { // false when no bar carried a finite high and low: the grid keeps the whole band
    let seenLo = loadedLow - range * marginShare;
    let seenHi = loadedHigh + range * marginShare;
    const thinnest = 0.1 * spot * sigmaT;
    if (seenHi - seenLo < thinnest) {
      const mid = 0.5 * (seenLo + seenHi);
      seenLo = mid - 0.5 * thinnest;
      seenHi = mid + 0.5 * thinnest;
    }
    if (seenLo > lo) lo = seenLo;
    if (seenHi < hi) hi = seenHi;
    if (!(hi > lo)) { // the loaded range sits outside the band entirely (a far basis): keep the band
      lo = bandLo;
      hi = bandHi;
    }
  }
  // The row probability is the drop in P(above) across the row, after P(above) is forced non-increasing up the grid.
  gridStep = niceStepAtMost((hi - lo) / f64(rowsWanted - 1));
  gridLo = Math.floor(lo / gridStep) * gridStep;
  gridRows = i32(Math.ceil((hi - gridLo) / gridStep)) + 1;
  while (gridRows > MAX_ROWS) { // never with the rows setting's range; kept so the frame can never overflow
    gridStep *= 2.0;
    gridLo = Math.floor(lo / gridStep) * gridStep;
    gridRows = i32(Math.ceil((hi - gridLo) / gridStep)) + 1;
  }
  if (gridRows < 3) return false; // the engine needs three prices for a grid
  for (let r = 0; r <= gridRows; r += 1) edgeAbove[r] = pAbove(gridLo + (f64(r) - 0.5) * gridStep);
  for (let r = 1; r <= gridRows; r += 1) if (!(edgeAbove[r] <= edgeAbove[r - 1])) edgeAbove[r] = edgeAbove[r - 1];
  peakRow = 0;
  for (let r = 0; r < gridRows; r += 1) {
    rowPrice[r] = gridLo + f64(r) * gridStep;
    const p = edgeAbove[r] - edgeAbove[r + 1];
    rowProb[r] = p > 0.0 ? p : 0.0;
    if (rowProb[r] > rowProb[peakRow]) peakRow = r;
  }
  return true;
}

// ── The docked cloud ──
const HEX: String[] = ["0", "1", "2", "3", "4", "5", "6", "7", "8", "9", "a", "b", "c", "d", "e", "f"]; // allocated at load, so a row colour never allocates per bar
function fbHexByte(v: i32): void { // two lowercase hex digits
  fb_text(HEX[(v >> 4) & 0xf]);
  fb_text(HEX[v & 0xf]);
}
function fbRamp(w: f64): void { // "#rrggbb": the tail ink moved toward the core ink by w (0..1), opaque
  const k = w < 0.0 ? 0.0 : w > 1.0 ? 1.0 : w;
  fb_text("\"#");
  for (let c = 0; c < 3; c += 1) fbHexByte(i32(Math.round(f64(tailRgb[c]) + (f64(coreRgb[c]) - f64(tailRgb[c])) * k)));
  fb_text("\"");
}
function readInk(packed: f64, rgb: StaticArray<i32>): void { // a colour setting arrives packed as ((r * 256 + g) * 256 + b) * 1024 + alpha thousandths
  const v = Math.floor(packed / 1024.0);
  const n = v >= 0.0 && v <= 16777215.0 ? i32(v) : 0;
  rgb[0] = (n >> 16) & 0xff;
  rgb[1] = (n >> 8) & 0xff;
  rgb[2] = n & 0xff;
}
function writeCloud(): void {
  const decimals = priceDecimals(gridStep);
  const peak = rowProb[peakRow] > 0.0 ? rowProb[peakRow] : 1.0;
  fb_clear();
  fb_text("{\"prices\":[");
  for (let r = 0; r < gridRows; r += 1) {
    if (r > 0) fb_text(",");
    fb_f64(rowPrice[r], decimals);
  }
  fb_text("],\"values\":[");
  for (let r = 0; r < gridRows; r += 1) {
    if (r > 0) fb_text(",");
    fb_f64(rowProb[r] * 100.0, 4); // bar length: the row's odds in percent
  }
  fb_text("],\"colors\":[");
  for (let r = 0; r < gridRows; r += 1) {
    if (r > 0) fb_text(",");
    fbRamp(rowProb[r] / peak); // the ramp by the row's share of the peak: slate tails, a sky core
  }
  // The point of control marks the row the tag names: on a nearly flat slice (a 1m window) several rows tie at the
  // written precision and the engine's own pick could land a few rows away. No poc_label_text: the docked tag stays
  // off, the knockout tag beside the axis names the row.
  fb_text("],\"poc_price\":");
  fb_f64(rowPrice[peakRow], decimals);
  fb_text("}");
  writeFrameBuffer(cloud_rows);
}

// ── Text helpers ──
function sbK(v: f64): void { // prices as the market reads them, thousands as K: 87.9K / 2.43K / 152.33 / 0.15234
  if (v >= 10000.0) {
    sb_f64(v / 1000.0, 1);
    sb_text("K");
  } else if (v >= 1000.0) {
    sb_f64(v / 1000.0, 2);
    sb_text("K");
  } else sb_auto(v);
}
function tag(name: String, price: f64): void { // "+1σ 87.9K" into the line buffer
  sb_clear();
  sb_text(name);
  sb_text(" ");
  sbK(price);
}
function sbRowPrice(v: f64, step: f64): void { // a grid row's price, fine enough to tell its row from the next: 85.2K on 100-dollar rows, 85.18K on 10s, the axis's own digits below that (85176)
  if (v >= 1000.0 && step >= 100.0) sb_compact(v, 1);
  else if (v >= 1000.0 && step >= 10.0) sb_compact(v, 2);
  else sb_price(v, step);
}

function onStart(): void {
  targetDays = f64(p_target_days());
  rowsWanted = i32(p_rows());
  marginShare = f64(p_margin()) / 100.0;
  readInk(p_core_ink(), coreRgb);
  readInk(p_tail_ink(), tailRgb);
}

// onBar() runs once per bar: history rows carry an empty block and cost three reads (the first bar's time is kept
// for the lines, every bar's high and low widen the loaded price range the grid follows); the live bar measures the
// chain, then writes the readings as numbers, the cloud, the lines, the tags and the card's words. A live bar
// without a usable chain writes the one slate sentence instead.
function onBar(): void {
  close = bar.close();
  t = bar.time();
  if (isNaN(firstT) && !isNaN(t)) firstT = t;
  const high = bar.high();
  const low = bar.low();
  if (high > loadedHigh) loadedHigh = high; // NaN never widens the range
  if (low < loadedLow) loadedLow = low;
  if (!bar.isLast()) return;
  const n = in_chain_cells();
  const chainRead = n >= TUPLE && measureChain(n);
  out_t_first(firstT);
  out_t_last(t);
  if (!chainRead) {
    sb_clear();
    sb_text("No option chain for this coin");
    notice.set(16, 14).text(str_notice_sb);
    sb_clear();
    sb_text("Options odds");
    str_title_text_sb();
    sb_clear();
    sb_text("No live expiry");
    str_band_text_sb();
    sb_clear();
    sb_text("-");
    str_up_text_sb();
    sb_clear();
    sb_text("-");
    str_down_text_sb();
    return;
  }
  notice.delete(); // a no-op when never drawn
  out_p_up_move(pUpMove);
  out_p_down_move(pDownMove);
  out_band_low(q16);
  out_band_high(q84);
  out_tail_low(q025);
  out_tail_high(q975);
  out_most_likely(rowPrice[peakRow]);
  out_iv_atm(ivAtm * 100.0);
  out_days_to_expiry(years * 365.0);
  writeCloud();
  tag("+1σ", q84);
  str_tag_band_high_sb();
  tag("-1σ", q16);
  str_tag_band_low_sb();
  tag("+2σ", q975);
  str_tag_tail_high_sb();
  tag("-2σ", q025);
  str_tag_tail_low_sb();
  sb_clear();
  sb_text("Most likely ");
  sbRowPrice(rowPrice[peakRow], gridStep);
  str_tag_most_likely_sb();
  // The card's words: the odds and the expiry read for the title, the 68% band alone as the headline, the odds of
  // a 5% move as rows.
  sb_clear();
  sb_text("68% likely, ");
  sb_time(expiry / 1000.0, "EEE dd MMM HH:mm", 0);
  sb_text(" UTC");
  str_title_text_sb();
  sb_clear();
  sbK(q16);
  sb_text(" to ");
  sbK(q84);
  str_band_text_sb();
  sb_clear();
  sb_f64(pUpMove, 0);
  sb_text("%");
  str_up_text_sb();
  sb_clear();
  sb_f64(pDownMove, 0);
  sb_text("%");
  str_down_text_sb();
}
How it works
The chain is live only. input("chain", options_chain.cells, { max_cells: 4000, venue: "deribit" }) serves the coin's Deribit chain on the newest bar as one ten-value tuple per listed contract (strike, expiry, side, open interest, gamma, delta, the mark implied volatility, the underlying, the multiplier and vega), and every history bar carries an empty block. onBar() keeps the first bar's open time for the lines and widens the loaded price range with every bar's bar.high() and bar.low(), history included, then returns on every bar but the last, so history draws nothing; on the live bar in_chain_cells() counts the values and in_chain_view() reads the block in place. The chart's own close is the bar grid, and spot when the chain carries no underlying.
The chain's clock, not the bar's. The odds run from the moment the chart priced the chain, never from the live bar's open, which on a 1w chart can sit days before now. The chart prices each contract's gamma by Black-Scholes from its mark IV and underlying when it reads the chain, so chainClockMs() takes the contract whose delta sits nearest 0.5 and solves its gamma for the time to expiry it implies: the expiry minus that time is the read time. A venue that serves its own greeks gives no such answer, and then the bar's open stands in. A 1w chart and a 1h chart over the same chain read the same expiry, days to expiry and band.
One expiry, one smile. measureChain() lists the expiries at least 12 hours past the chain's clock and keeps the one whose distance in days is closest to target_days (ties keep the earlier). Spot is the chain's own underlying at that expiry, else the close. One implied volatility per strike comes from the out-of-the-money contract (puts below spot, calls at or above), the venue's percent a year turned into a fraction, and ivAt() reads the smile at any price: linear between neighbouring strikes, flat beyond the ends.
The odds are one curve. pAbove() is the chain's odds that price settles above a price, N(d2) with the smile's volatility at that price through normalCdf(). priceWhereAbove() bisects over eight standard deviations for the prices with 97.5%, 84%, 16% and 2.5% odds of settling above them (tail_low, band_low, band_high, tail_high), and p_up_move and p_down_move are the odds of settling 5% or more above or below spot (MOVE). iv_atm, days_to_expiry (from the chain's clock to the expiry read) and most_likely ride beside them, all data-only outputs that read NaN on history bars.
The rows follow the loaded range. On the live bar measureChain() takes the loaded bars' low to high, widens it by margin percent of itself on each side, keeps it at least a tenth of a standard deviation wide (for a flat or one-bar window), and clamps it to spot times exp(plus or minus three standard deviations of the log price). niceStepAtMost() then takes the largest round step (1, 1.5, 2, 2.5, 3, 4, 5, 6 or 8 times a power of ten) at or under the span over rows - 1, so rows is a floor: the grid holds at least that many rows. A 1m chart gets rows a few dollars apart over its few hundred dollars of range, a 1h chart the whole bell, and the odds are the same; on a fine chart the visible slice of the bell is nearly flat, which is the odds, not a fault. A row's odds are the drop in P(above) across the row, after the curve is forced non-increasing up the grid.
The grid is the cloud. writeCloud() builds the frame through fb_* with prices (written to priceDecimals() of the step, so the rows stay evenly spaced when parsed), values (the odds in percent), colors (the tail ink moved toward the core ink by the row's share of the peak, so the tails read slate and the core sky) and poc_price (the most likely row), and sends it with writeFrameBuffer(cloud_rows). plot.levels docks it right at 0.1 of the pane, narrow enough that the newest candles over it stay readable: color: "@core_ink" is the level's own colour, the fallback for a row without one; gradient is the alpha profile from each bar's root to its tip (a row with its own colour keeps its hue and takes the stops' alpha); poc: true draws a 2 px point-of-control line in @peak_ink across the dock at the price the frame names, so on a nearly flat slice, where several rows tie at the written precision, the line still marks the row the tag names; hover: true opens a row's odds (format: "%", decimals: 2: a 10-dollar row holds about 0.24%). poc_label: false turns the engine's docked tag off, and the frame writes no poc_label_text, since that field alone would turn it back on. core_ink and tail_ink arrive in onStart() packed as one number each, and readInk() unpacks them to red, green and blue for the ramp.
The lines and tags are declarations. draw.line("band_high_line", { x1: "t_first", y1: "band_high", x2: "t_last", y2: "band_high", ... extend: "both" }) reads its coordinates from outputs by name on the newest bar; the 68% band's edges are solid sky, the 95% band's dotted slate, and each shows whenever the pane covers it. The tags are draw.label declarations reading string slots (tag_band_high holds "+1σ 87.0K", built by sbK() with thousands as K), with style: "knockout" (a box in the chart's background colour, so a line never runs through its own text), align: "right", valign: "middle" and sticky_right: true, so they ride beside the price axis as the chart scrolls.
The most likely row has its own tag. draw.label("tag_most_likely", { x: "t_last", y: "most_likely", text: "tag_most_likely", color: "#2dd4bf", ... sticky_right: true }) is a teal knockout, right-aligned beside the price axis in the same column as the sigma tags, never on the axis. sbRowPrice() writes the row's price at the grid's resolution: a price of 1000 or more prints compact through sb_compact (thousands as K), with one decimal on rows of 100 or more ("Most likely 85.2K") and two on rows of 10 or more ("Most likely 85.26K"); anything else prints through sb_price with the step as the tick, the axis's own digits ("Most likely 85272"). The frame's poc_price names the same row, so the POC line and the tag mark one price. The tag's colour is the literal teal because a draw.label colour cannot name a setting (The Style page): a changed peak ink moves the POC line and leaves the tag teal.
The card reads slots. render.hud("odds", { position: "top_left", look: "glass", font_family: "ui", title: "{{title_text}}", columns: 1, width: 250, safe_area: true, tiles: [...] }): the title is the one slot title_text, written on the live bar as "68% likely, " then sb_time(expiry / 1000.0, "EEE dd MMM HH:mm", 0) and " UTC"; tile.pill("Range at expiry", "band_text", { headline: true, color: "#38bdf8", font_size: 24, draw: "text" }) is the headline, the band alone in sky at 24 px, where draw: "text" prints the words alone in their colour instead of the glass look's dot before them; tile.rows prints up_text and down_text, the odds rounded to whole percent. font_family: "ui" beside the look wins over the look's rounded type, so the card reads in the app's own type (the rounded stack is not on every system). The 250 px width fits the longest band ("112.3K to 118.9K") at 24 px with the look's 16 px padding each side, and safe_area starts the card under the legend, so it covers the oldest candles on screen, never the newest ones or the cloud.
Where it runs
Charts of a coin Deribit lists options for (BTC, ETH, SOL and the rest of its list), on any venue and any interval: Binance Futures BTCUSDT at 1m, 15m and 1h, and Binance spot ETHUSDT at 15m and 1h. The odds do not depend on the chart's interval; only the rows' span does: at 1m the cloud is a fine, nearly flat wall of rows a few dollars apart over the whole pane, at 15m a hump, at 1h the whole bell. The pane's own range decides what is in view: on a 15m chart the "+2σ" and "-2σ" lines, and sometimes one edge of the 68% band, sit outside the pane while a 1h pane shows the whole bell, and a longer horizon on a fine chart needs the price axis zoomed out, since an overlay never widens the price pane. The cloud mounts as its own overlay, so the legend counts two indicators for one file and names the cloud's row "Odds by price": the level's name, odds_by_price, in words, since a name without a label reads as sentence-case words. A coin without a Deribit chain refuses the run by name before any bar, the legend shows the error chip and nothing draws: Input 'chain' reads options_chain cells with venue "deribit", but Deribit lists no options for coin 'PURR' (wrun_options_chain_venue_unavailable): open a chart of a coin Deribit lists (BTC, ETH, SOL, ...), or declare venue "auto".
When data is missing
A live bar whose chain cannot be read (an empty block, no expiry at least 12 hours away, or no strike carrying a volatility) prints one slate sentence at the top right of the pane, No option chain for this coin, through the handles.label notice; the card's title then reads "Options odds", its headline "No live expiry" and both rows a dash, no cloud frame is written, and the lines and tags draw nothing (their price outputs are NaN on the newest bar). History bars draw nothing: every reading is NaN there, and their highs and lows only set the range the rows follow. The lines, placed from the newest bar with extend: "both", cross the whole pane whatever the loaded history, while the cloud's rows follow it: a window where no bar carried a finite high and low, or one that sits wholly outside the band (a far basis), keeps the whole band of spot times exp(plus or minus three standard deviations), and a flat or one-bar window still spans a tenth of a standard deviation.
Customize it
- A longer horizon.
target_days(2, from 1 to 90) picks the expiry read: the listed expiry at least 12 hours away whose distance in days is closest to it. A higher timeframe wants a longer horizon, and a long horizon on a fine chart puts the band outside the pane until the price axis is zoomed out. - A finer cloud.
rows(90, from 60 to 160) is the fewest rows the grid puts across the loaded range and its margin: the step is the largest round price at or under the span overrows - 1, so the cloud holds at least that many rows and a higher setting gives a finer step. - A wider reach.
margin(25, from 0 to 100) is how far the cloud reaches past the loaded bars' high and low, percent of that range on each side: 0 keeps the rows to the loaded range, and no margin takes them past spot times exp(plus or minus three standard deviations). - Other inks.
core_ink(sky),tail_ink(slate) andpeak_ink(teal) under the Look section: the ramp runs from the tail ink to the core ink by each row's share of the peak, and the point-of-control line takes the peak ink. The Most likely tag keeps its literal teal (#2dd4bf) and the band lines and tags their literal sky and slate, since adraw.*colour takes a literal, not a setting: change them in the source to match new inks. - Another move.
MOVE(0.05) is the move the card prices; the rows' labels are literals, so change "Up 5% or more" and "Down 5% or more" with it (p_up_moveandp_down_movecarry the same odds for the Console and watches). - Change the look. The card is made in
look: "glass"withfont_family: "ui"beside it, and a word besidelookwins over the look, so the card keeps the app's type whatever look it wears. The Look row on the indicator's Style page switches the look without code (The Style page); broadsheet (a warm off-white surface, rules over a small-caps title and rows with dot leaders) is the second look this example was shot in. The source writes the look as a literal; bindinglookto aparam.choiceover looks as"@name"makes it a setting, whose row then stands in for the Look row (Looks).
Run it
- In the editor's Explorer, press the Templates icon ("Browse starter templates") and pick Options Odds Cloud under Beyond the time axis.
- Press Run on a chart of a coin Deribit lists, such as BTCUSDT on Binance Futures at 15m: the cloud docks on the right of the price pane with its Most likely tag beside the price axis, the band lines cross the chart with their tags in the same column, and the glass card appears at the top left, under the legend. Rest the pointer on a cloud row to read its odds. Switch to 1m for rows a few dollars apart over the whole pane, or to 1h for the whole bell.
- At the editor's Console prompt, type
last 20 p_up_moveto read the odds of a 5% rise on the last 20 bars: a number on the newest bar only, since the chain is live only.
Concepts used
- Options kit for
options_chain.cells, the ten-value tuple,venueand reading the chain underbar.isLast() - Docked profiles for
plot.levels, the frame'scolorsandpoc_price,gradient,pocwithpoc_label: false,decimalsandhover - Frames, panels and compact widgets for
frame(), thefb_*builders andwriteFrameBuffer - Run-level drawings for declared
draw.lineanddraw.label, their output-name coordinates,extend,sticky_rightand thestyleword - Handles for the
handles.labelnotice - HUD cards for
render.hud,width,offsetandsafe_area - Looks for
look: "glass", a word besidelookwinning over it, the broadsheet row andlookbound to aparam.choice - Blocks and tiles for the headline
tile.pillwithdraw: "text"andtile.rows - The Style page for the Look row,
param.colorbound by"@name"and the literal adraw.*colour keeps - Strings and text for
sb_time,sb_compact,sb_price,sb_autoandsb_f64