Volatility smile
Implied volatility by strike for three expiries of the chart coin's Deribit option chain, drawn under the chart as three smooth curves over a dollar strike axis, named by role so the words stay true when a horizon setting moves: near, about a week out by default (teal, the widest stroke), mid, about a month (sky) and far, about three months (violet). Out-of-the-money contracts only, the way the market prices the wings: puts below spot, calls at or above it. A dashed marker stands at spot, a callout pins each curve at the money with its expiry's date and IV ("9 Oct 34.1%"), the caption names each horizon's listed expiry ("near 9 Oct, mid 30 Oct, far 25 Dec"), and a chip on the pane's title row names the lean of the nearest curve: "Put skew 4.5 pts (10%)" means the strike 10% below spot trades 4.5 IV points over the strike 10% above it, so puts carry the premium. Rose for put skew, the chart's accent for call skew, slate when the two wings sit within half a point. At the top left of the price pane, under the legend and clear of the newest candles, a card in the broadsheet look (newsprint, serif type, small caps, dotted leaders) answers one number first: the near expiry's implied volatility at the money, in the curve's teal. Under it, two rows: the mid horizon's 25-delta skew (put IV minus call IV at the listed strikes whose |delta| sits nearest 0.25, the desk's usual quote; positive is put skew) and the term, the mid against the far IV at the money (a higher nearer reading means the market pays more for the next month than for the quarter: event risk priced in).
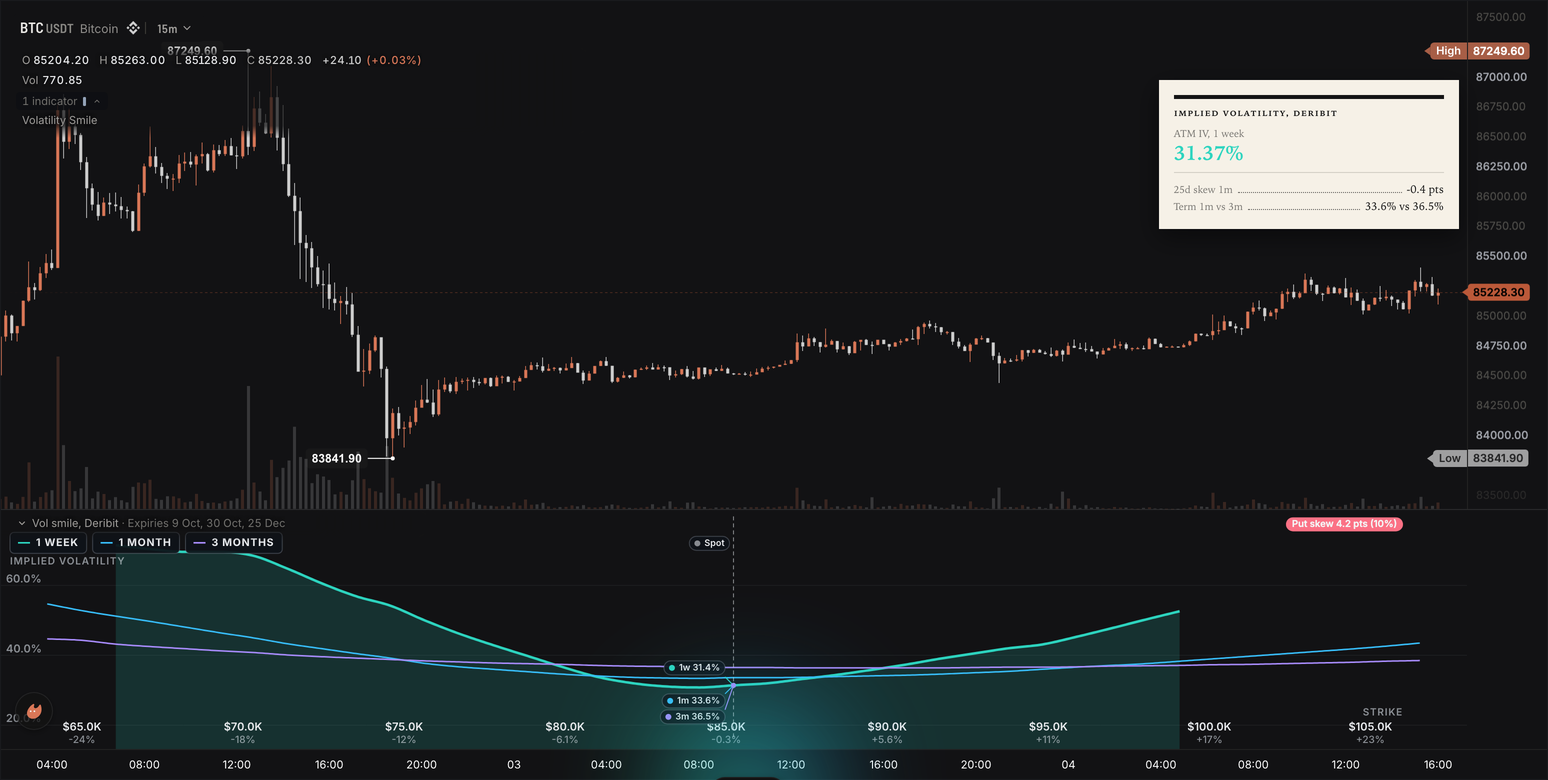
The parts are an options_chain.cells input pinned to Deribit (Options kit), a frame feeding a panel.line on a number axis with three series, a declared spot marker and a badge that the frame replaces on every run with the at-the-money callouts, the chip and the caption (Cards, frames and panels), a render.hud card of a headline tile.value and a tile.rows in the broadsheet look (HUD cards, Looks), and a render.label pinned to the top right for the one sentence when the coin has no chain (Plotting). This is also the vol-smile template: the Volatility Smile card under Beyond the time axis in the editor's starter list, and it compiles as written.
The wrun indicator
// Volatility Smile: implied volatility by strike for three expiries of the chart coin's Deribit chain (near, mid and
// far: about a week, a month and three months out by default), out-of-the-money contracts only (puts below spot, calls at or above, the way
// the market prices the wings), drawn under the chart as three smooth curves over a dollar strike axis: a dashed
// marker at spot, a callout on each curve's at-the-money point and a chip naming the lean of the nearest curve (IV
// at the put wing minus IV at the call wing, both the same percent from spot). The trader sees whether puts or calls
// carry the premium (the left wing higher means put skew), how much steeper the near smile is than the far one
// (event risk sits in the near curve), and on the card the nearest expiry's IV at the money, the mid horizon's
// 25-delta skew (the desk's standard quote, read at the strikes nearest 25 delta) and the mid against far term. Each
// curve is named by its role and called out with its expiry's date, so the words stay true when a horizon setting
// moves. The chain is live only: history bars draw nothing and cost nothing; everything is measured on the last bar,
// from the chain's own clock.

section("Expiries and strikes");
param.int("near_days", 7, { min: 1, max: 30, label: "Near horizon, days", description: "Days to the first horizon: the listed expiry closest to this many days away (at least 12 h out)" });
param.int("mid_days", 30, { min: 7, max: 120, label: "Mid horizon, days", description: "Days to the second horizon; a later expiry than the first" });
param.int("far_days", 90, { min: 30, max: 365, label: "Far horizon, days", description: "Days to the third horizon; a later expiry than the second" });
param.number("window_pct", 25, { min: 5, max: 60, label: "Strike grid, percent", description: "Strike grid: percent around spot, each side" });
param.int("points", 41, { min: 21, max: 81, label: "Grid strikes", description: "Strikes on the common grid" });
param.int("wing_pct", 10, { min: 3, max: 30, label: "Skew wing, percent", description: "The chip's skew: IV this percent below spot minus IV this percent above it, on the nearest drawn expiry" });
input("close", ohlcv.close); // the chart's own close: spot for the grid, the out-of-the-money split and the at-the-money read
input("chain", options_chain.cells, { max_cells: 4000, venue: "deribit", description: "Deribit's chain of the chart's coin" }); // [strike, expiry_ms, side, oi, gamma, delta, mark_iv, underlying, multiplier, vega] per contract; a BTC chain is about 1,550 contracts
output("atm_iv_1w", none, overlay, { description: "Implied volatility at the money, near horizon (about a week by default), percent; live bar only" }); // data-only: the card reads them and the Console can too
output("atm_iv_1m", none, overlay, { description: "Implied volatility at the money, mid horizon (about a month by default), percent; live bar only" });
output("atm_iv_3m", none, overlay, { description: "Implied volatility at the money, far horizon (about three months by default), percent; live bar only" });
output("skew_25d", none, overlay, { description: "25-delta skew of the mid horizon (the nearest drawn one when it lists nothing): put IV minus call IV at the strikes nearest |delta| 0.25, IV points; above 0 is put skew" });
output("wing_skew", none, overlay, { description: "The chip's skew: IV at the put wing minus IV at the call wing (wing_pct from spot) on the nearest drawn expiry, IV points; above 0 is put skew" });
output("term_1m_3m", none, overlay, { description: "Mid horizon ATM IV minus far horizon ATM IV, IV points; above 0 the nearer term is the dearer" });
output("expiry_days_1w", none, overlay, { description: "Days from the chain's read time to the near horizon's expiry" });
string("skew_word", { max_bytes: 24 }); // the card's skew row: "+2.7 pts"
string("term_word", { max_bytes: 32 }); // the card's term row: "32.8% vs 36.5%"
string("notice", { max_bytes: 48 }); // the one sentence when the coin has no chain
const smile_rows = frame("smile_rows", { max_bytes: 12288 }); // one row per grid strike: [strike, iv per horizon], null where the horizon lists nothing

// The smile pane: three smooth curves over a dollar strike axis (the nearest expiry the widest stroke, every curve
// with a halo), the value axis in percent and pinned per run so a short curve's gaps never squash the picture and its
// peak keeps clear of the chips, a dashed spot marker, a callout pinned to each curve at the money with its expiry's
// date and the skew chip on the title row; the marker list, the chip, the caption and the axis range are written per
// run into the frame. The series are named by role (near, mid, far), true whatever the horizon settings read.
panel.line({
  name: "smile",
  title: "Vol smile, Deribit",
  x: "number",
  place: "below",
  frame: smile_rows,
  height_frac: 0.32,
  chrome: "grid",
  smooth: true,
  glow: true,
  hover_card: true,
  legend_style: "chips",
  x_format: "usd",
  x_decimals: 1,
  x_title: "Strike",
  y_title: "Implied volatility",
  format: "%",
  decimals: 1,
  badge: { text: "Skew", color: "#94a3b8" },
  markers: [{ x: "spot", label: "Spot", line_style: "dashed", badge: true }],
  series: [
    { name: "Near", color: "#2dd4bf", width: 2.5 },
    { name: "Mid", color: "#38bdf8", width: 1.5 },
    { name: "Far", color: "#a78bfa", width: 1.5 },
  ],
});

// The card, in the broadsheet look (newsprint, serif type, small caps, dotted leaders): the nearest expiry's IV at
// the money leads as the headline in the curve's teal, then the mid horizon's 25-delta skew and the mid against far
// term as two rows. Every tile reads the newest row, the live bar's. It sits at the top left under the legend, clear
// of the newest candles and of the one-sentence notice at the top right. The look is a literal (the kit refuses a
// setting here); the dialog's Style page carries the Look row, phosphor among its twelve, for the viewer's switch.
render.hud("smile_card", {
  position: "top_left",
  safe_area: true, // under the legend
  look: "broadsheet",
  title: "Implied volatility, Deribit",
  columns: 1,
  width: 300,
  tiles: [
    tile.value("ATM IV, near expiry", "atm_iv_1w", { format: "%", headline: true, color: "#2dd4bf", hint: "Implied volatility at the money for the listed expiry nearest the near horizon (a week out by default): what the market pays for a move over that horizon" }),
    tile.rows([
      ["25d skew, mid", "skew_word"],
      ["Term, mid vs far", "term_word"],
    ]),
  ],
});
render.label("notice", { position: "top_right", text: "notice", offset: [12, 8], style: "knockout", color: "#94a3b8", size: 12 }); // the one sentence, written on the live bar only when the coin has no chain

const CURVES = 3; // the horizons, in the panel's series order
const CURVE_NAMES: string[] = ["Near", "Mid", "Far"]; // the series, by role
const CAPTION_NAMES: string[] = ["near ", "mid ", "far "];
const CURVE_INK: string[] = ["#2dd4bf", "#38bdf8", "#a78bfa"]; // teal, sky, violet: the series colours, for the callouts
const MAX_STRIKES = 256; // out-of-the-money strikes one expiry lists
const MAX_EXPIRIES = 64; // distinct live expiries a chain lists
const TUPLE = 10; // f64s per contract
const DAY_MS = 86400000.0;
const MIN_AHEAD_MS = 43200000.0; // an expiry inside 12 h is settling, not a horizon
const Z_25D = 0.6744897501960817; // the standard normal quantile at 0.75: the Black-Scholes 25-delta strikes when the chain serves no deltas
const MONTHS: string[] = ["Jan", "Feb", "Mar", "Apr", "May", "Jun", "Jul", "Aug", "Sep", "Oct", "Nov", "Dec"];

// Per horizon: the out-of-the-money points at its expiry, sorted by strike, and the readings taken from them.
const cStrike = new StaticArray<f64>(CURVES * MAX_STRIKES);
const cIv = new StaticArray<f64>(CURVES * MAX_STRIKES); // percent
const cDelta = new StaticArray<f64>(CURVES * MAX_STRIKES); // |delta| as the venue serves it, 0 when it serves none
const cOi = new StaticArray<f64>(CURVES * MAX_STRIKES); // open interest, to settle a strike listed twice
const cCount = new StaticArray<i32>(CURVES);
const cExpiry = new StaticArray<f64>(CURVES); // the expiry the horizon shows, ms; NaN when none is listed
const cDays = new StaticArray<f64>(CURVES); // days from the chain's clock to that expiry
const cAtm = new StaticArray<f64>(CURVES); // IV at spot, percent; NaN when the curve does not cover spot
const cKept = new StaticArray<i32>(CURVES); // 1 while the horizon's curve is drawn
const cDay = new StaticArray<i32>(CURVES); // the expiry's UTC calendar day and month (1..12)
const cMonth = new StaticArray<i32>(CURVES);
const expiryMs = new StaticArray<f64>(MAX_EXPIRIES); // the chain's live expiries, sorted ascending
let expiryCount = 0;

let targetDays: f64[] = [7.0, 30.0, 90.0]; // settings, read in onStart()
let windowPct = 0.25;
let points = 41;
let wingPct = 0.1;
let measured = false; // the live bar carried a usable chain: at least one horizon drawn
let skew: f64 = NaN; // the 25-delta skew of the mid horizon (the nearest drawn one when it lists nothing), IV points
let wingSkew: f64 = NaN; // the chip: the nearest drawn curve's put wing minus its call wing, IV points
let nearest = -1; // the nearest drawn horizon (0 while the first is listed)

// The chain's live expiries: sorted insertion of each distinct one
function noteExpiry(ms: f64): void {
  let lo = 0;
  let hi = expiryCount;
  while (lo < hi) {
    const mid = (lo + hi) >> 1;
    if (expiryMs[mid] < ms) lo = mid + 1;
    else hi = mid;
  }
  if (lo < expiryCount && expiryMs[lo] == ms) return;
  if (expiryCount >= MAX_EXPIRIES) return;
  for (let i = expiryCount; i > lo; i -= 1) expiryMs[i] = expiryMs[i - 1];
  expiryMs[lo] = ms;
  expiryCount += 1;
}

function pickExpiry(targetMs: f64, after: i32): i32 { // the listed expiry closest to the target; one later than the previous horizon's when the two meet; -1 when none is left
  let best = -1;
  let bestGap = Infinity;
  for (let i = 0; i < expiryCount; i += 1) {
    const gap = Math.abs(expiryMs[i] - targetMs);
    if (gap < bestGap) {
      bestGap = gap;
      best = i;
    }
  }
  if (best <= after) best = after + 1;
  return best < expiryCount ? best : -1;
}

// One horizon's points: sorted insertion by strike; a strike listed twice (two settlement families) keeps the heavier open interest
function insertPoint(c: i32, strike: f64, iv: f64, delta: f64, oi: f64): void {
  const base = c * MAX_STRIKES;
  let lo = 0;
  let hi = cCount[c];
  while (lo < hi) {
    const mid = (lo + hi) >> 1;
    if (cStrike[base + mid] < strike) lo = mid + 1;
    else hi = mid;
  }
  if (lo < cCount[c] && cStrike[base + lo] == strike) {
    if (oi > cOi[base + lo]) {
      cIv[base + lo] = iv;
      cDelta[base + lo] = delta;
      cOi[base + lo] = oi;
    }
    return;
  }
  if (cCount[c] >= MAX_STRIKES) return;
  for (let i = cCount[c]; i > lo; i -= 1) {
    cStrike[base + i] = cStrike[base + i - 1];
    cIv[base + i] = cIv[base + i - 1];
    cDelta[base + i] = cDelta[base + i - 1];
    cOi[base + i] = cOi[base + i - 1];
  }
  cStrike[base + lo] = strike;
  cIv[base + lo] = iv;
  cDelta[base + lo] = delta;
  cOi[base + lo] = oi;
  cCount[c] += 1;
}

// The out-of-the-money points of one expiry: puts below spot, calls at or above; IV normalized to percent (a chain
// whose largest IV at the expiry is under 3 serves fractions, 0.45 for 45%); IV at or below 0, or NaN, skipped.
function readPoints(c: i32, cells: StaticArray<f64>, n: i32, expiry: f64, spot: f64): void {
  cCount[c] = 0;
  let maxIv = 0.0;
  for (let i = 0; i + TUPLE - 1 < n; i += TUPLE) if (cells[i + 1] == expiry && cells[i + 6] > maxIv) maxIv = cells[i + 6];
  const scale = maxIv > 0.0 && maxIv <= 3.0 ? 100.0 : 1.0;
  for (let i = 0; i + TUPLE - 1 < n; i += TUPLE) {
    if (cells[i + 1] != expiry) continue;
    const strike = cells[i];
    const iv = cells[i + 6] * scale;
    if (!(strike > 0.0) || !(iv > 0.0)) continue;
    const otm = cells[i + 2] < 0.0 ? strike < spot : strike >= spot;
    if (!otm) continue;
    insertPoint(c, strike, iv, Math.abs(cells[i + 5]), cells[i + 3]);
  }
}

function ivAt(c: i32, price: f64): f64 { // linear interpolation between the horizon's two neighbouring listed strikes; NaN outside its listed range
  const count = cCount[c];
  const base = c * MAX_STRIKES;
  if (count < 2 || isNaN(price)) return NaN;
  if (price < cStrike[base] || price > cStrike[base + count - 1]) return NaN;
  let lo = 0;
  let hi = count - 1;
  while (hi - lo > 1) {
    const mid = (lo + hi) >> 1;
    if (cStrike[base + mid] <= price) lo = mid;
    else hi = mid;
  }
  const k0 = cStrike[base + lo];
  const k1 = cStrike[base + hi];
  if (price == k0 || k1 == k0) return cIv[base + lo];
  return cIv[base + lo] + ((cIv[base + hi] - cIv[base + lo]) * (price - k0)) / (k1 - k0);
}

// The 25-delta skew of one horizon: the out-of-the-money put whose |delta| sits nearest 0.25 against the call whose
// delta does, put IV minus call IV. The mid horizon (a month by default) is the one quoted (a week out, the 25-delta
// strikes sit two or three percent from spot and miss the wings the eye reads). A chain that serves no deltas falls back to the
// Black-Scholes 25-delta strikes from the horizon's own ATM vol and time to expiry, read off the interpolated curve.
function skew25(c: i32, spot: f64): f64 {
  const base = c * MAX_STRIKES;
  let put = -1;
  let call = -1;
  let putGap = Infinity;
  let callGap = Infinity;
  for (let i = 0; i < cCount[c]; i += 1) {
    const d = cDelta[base + i];
    if (!(d > 0.0) || d >= 1.0) continue;
    const gap = Math.abs(d - 0.25);
    if (cStrike[base + i] < spot) {
      if (gap < putGap) {
        putGap = gap;
        put = i;
      }
    } else if (gap < callGap) {
      callGap = gap;
      call = i;
    }
  }
  if (put >= 0 && call >= 0) return cIv[base + put] - cIv[base + call];
  const sigma = cAtm[c] / 100.0;
  const years = cDays[c] / 365.0;
  if (!(sigma > 0.0) || !(years > 0.0)) return NaN;
  const drift = 0.5 * sigma * sigma * years;
  const spread = Z_25D * sigma * Math.sqrt(years);
  return ivAt(c, spot * Math.exp(drift - spread)) - ivAt(c, spot * Math.exp(drift + spread));
}

function civilDate(c: i32, ms: f64): void { // UTC calendar day and month of an epoch-ms instant (days since 1970 to civil, no Date)
  const z = <i64>Math.floor(ms / DAY_MS) + 719468;
  const era = (z >= 0 ? z : z - 146096) / 146097;
  const doe = z - era * 146097;
  const yoe = (doe - doe / 1460 + doe / 36524 - doe / 146096) / 365;
  const doy = doe - (365 * yoe + yoe / 4 - yoe / 100);
  const mp = (5 * doy + 2) / 153;
  cDay[c] = <i32>(doy - (153 * mp + 2) / 5 + 1);
  cMonth[c] = <i32>(mp < 10 ? mp + 3 : mp - 9);
}

// The chain's clock: when its gammas were priced, not the bar's open. The chart prices each contract's gamma by
// Black-Scholes from its mark IV and underlying at the moment it reads the chain, so the contract nearest the money
// (|delta| nearest 0.5), solved for the time to expiry its gamma implies, names that moment. A venue that serves its
// own greeks gives no such answer: the bar's open stands in.
function chainClockMs(cells: StaticArray<f64>, n: i32, barOpenMs: f64): f64 {
  let best = -1;
  let bestGap = 0.25; // |delta| within 0.25 of 0.5
  let nearest = Infinity; // the nearest listed expiry: the chain lists none that has passed
  for (let i = 0; i + TUPLE - 1 < n; i += TUPLE) {
    if (cells[i + 1] < nearest) nearest = cells[i + 1];
    const gap = Math.abs(Math.abs(cells[i + 5]) - 0.5);
    if (cells[i] > 0.0 && cells[i + 4] > 0.0 && cells[i + 6] > 0.0 && cells[i + 7] > 0.0 && gap < bestGap) {
      bestGap = gap;
      best = i;
    }
  }
  if (best < 0) return barOpenMs;
  const sigma = cells[best + 6] > 3.0 ? cells[best + 6] / 100.0 : cells[best + 6]; // percent a year, or a fraction
  const m = Math.log(cells[best + 7] / cells[best]);
  const q = cells[best + 4] * cells[best + 7]; // gamma times spot = pdf(d1) / u, u = sigma * sqrt(T), d1 = m / u + u / 2
  let lo = Math.sqrt(2.0 * (Math.sqrt(1.0 + m * m) - 1.0)); // where pdf(d1) / u peaks: past it the gamma falls as T grows
  let hi = 10.0;
  for (let k = 0; k < 80; k += 1) { // bisection on the falling side
    const u = 0.5 * (lo + hi);
    const d1 = m / u + 0.5 * u;
    if (Math.exp(-0.5 * d1 * d1) / (2.5066282746310002 * u) > q) lo = u;
    else hi = u;
  }
  const u = 0.5 * (lo + hi);
  const clock = cells[best + 1] - ((u * u) / (sigma * sigma)) * 31536000000.0;
  return clock > barOpenMs - 86400000.0 && clock < nearest ? clock : barOpenMs; // anything else is no reading
}

// The chain, measured on the live bar: three horizons of the one chain, each a later expiry than the last
function measure(spot: f64, barOpenMs: f64): bool {
  for (let c = 0; c < CURVES; c += 1) {
    cKept[c] = 0;
    cCount[c] = 0;
    cExpiry[c] = NaN;
    cDays[c] = NaN;
    cAtm[c] = NaN;
  }
  expiryCount = 0;
  skew = NaN;
  wingSkew = NaN;
  nearest = -1;
  const n = in_chain_cells();
  if (n < TUPLE || isNaN(spot)) return false;
  const cells = in_chain_view(); // the live chain in place: the first n values of the build's own buffer
  const nowMs = chainClockMs(cells, n, barOpenMs); // the chain's clock: a coarse bar's open would shift the horizons
  for (let i = 0; i + TUPLE - 1 < n; i += TUPLE) if (cells[i + 1] > nowMs + MIN_AHEAD_MS) noteExpiry(cells[i + 1]);
  if (expiryCount == 0) return false;
  let kept = 0;
  let after = -1; // the last horizon's expiry index: the next horizon takes a later one
  for (let c = 0; c < CURVES; c += 1) {
    const idx = pickExpiry(nowMs + targetDays[c] * DAY_MS, after);
    if (idx < 0) continue;
    after = idx;
    readPoints(c, cells, n, expiryMs[idx], spot);
    if (cCount[c] < 2) continue;
    cExpiry[c] = expiryMs[idx];
    cDays[c] = (expiryMs[idx] - nowMs) / DAY_MS;
    cAtm[c] = ivAt(c, spot);
    civilDate(c, expiryMs[idx]);
    cKept[c] = 1;
    if (nearest < 0) nearest = c;
    kept += 1;
  }
  if (cKept[1] == 1) skew = skew25(1, spot);
  else if (nearest >= 0) skew = skew25(nearest, spot);
  for (let c = 0; c < CURVES; c += 1) { // the chip reads the nearest curve that lists both wings
    if (cKept[c] == 0) continue;
    const lean = ivAt(c, spot * (1.0 - wingPct)) - ivAt(c, spot * (1.0 + wingPct));
    if (!isFinite(lean)) continue;
    wingSkew = lean;
    break;
  }
  return kept > 0;
}

// The panel frame: the common strike grid centred on spot (one row sits exactly at spot, where the callouts pin),
// each drawn horizon interpolated onto it and null outside its listed strikes; the value axis pinned to the curves
// with a margin, the caption naming the expiries, the skew chip, the spot marker and the at-the-money callouts.
function fbDate(c: i32): void { // 30 Oct
  fb_int(<i64>cDay[c]);
  fb_text(" ");
  fb_text(MONTHS[cMonth[c] - 1]);
}
function writeSmile(spot: f64): void {
  const decimals = spot >= 1000.0 ? 1 : spot >= 10.0 ? 2 : 5;
  const mid = (points - 1) / 2;
  const step = (2.0 * windowPct * spot) / f64(points - 1);
  fb_clear();
  fb_text("{\"rows\":[");
  let yLo = Infinity;
  let yHi = -Infinity;
  let written = 0;
  for (let r = 0; r < points; r += 1) {
    const x = spot + f64(r - mid) * step;
    if (x <= 0.0) continue;
    if (written > 0) fb_text(",");
    fb_text("[");
    fb_f64(x, decimals);
    for (let c = 0; c < CURVES; c += 1) {
      fb_text(",");
      const iv = cKept[c] == 1 ? ivAt(c, x) : NaN;
      if (isFinite(iv)) {
        if (iv < yLo) yLo = iv;
        if (iv > yHi) yHi = iv;
      }
      fb_f64(iv, 1); // null (JSON's gap) where the horizon lists nothing at this strike
    }
    fb_text("]");
    written += 1;
  }
  fb_text("]");
  if (isFinite(yLo) && isFinite(yHi)) { // the value axis follows the curves, not the gaps; room under the floor for the three callouts
    const range = yHi - yLo;
    let above = range * 0.25; // headroom over the highest wing, so it never runs under the series chips
    if (above < 3.0) above = 3.0;
    let below = range * 0.3;
    if (below < 3.0) below = 3.0;
    const lo = yLo - below;
    fb_text(",\"y_min\":");
    fb_f64(lo < 0.0 ? 0.0 : lo, 1);
    fb_text(",\"y_max\":");
    fb_f64(yHi + above, 1);
  }
  fb_text(",\"caption\":\"");
  let named = 0;
  for (let c = 0; c < CURVES; c += 1) { // each drawn horizon and its expiry's date, in the series' order: "near 9 Oct"
    if (cKept[c] == 0) continue;
    if (named > 0) fb_text(", ");
    fb_text(CAPTION_NAMES[c]);
    fbDate(c);
    named += 1;
  }
  fb_text("\",\"badge\":{\"text\":\""); // the chip: the nearest curve's lean at the wings, rose for puts, the accent for calls
  if (isNaN(wingSkew)) fb_text("Skew n/a\",\"color\":\"#94a3b8\"}");
  else {
    const flat = Math.abs(wingSkew) < 0.5;
    fb_text(flat ? "Flat skew " : wingSkew > 0.0 ? "Put skew " : "Call skew ");
    fb_f64(Math.abs(wingSkew), 1);
    fb_text(" pts (");
    fb_int(<i64>Math.round(wingPct * 100.0));
    fb_text("%)\"");
    if (flat) fb_text(",\"color\":\"#94a3b8\"");
    else if (wingSkew > 0.0) fb_text(",\"color\":\"#fb7185\"");
    fb_text("}");
  }
  fb_text(",\"markers\":[{\"x\":\"spot\",\"label\":\"Spot\",\"line_style\":\"dashed\",\"badge\":true}");
  for (let c = 0; c < CURVES; c += 1) {
    if (cKept[c] == 0 || !isFinite(cAtm[c])) continue;
    fb_text(",{\"x\":");
    fb_f64(spot, decimals);
    fb_text(",\"valign\":\"point\",\"series\":");
    fb_str(CURVE_NAMES[c]);
    fb_text(",\"label\":\"");
    fbDate(c); // the callout names its curve's expiry: "9 Oct 34.1%"
    fb_text(" ");
    fb_f64(cAtm[c], 1);
    fb_text("%\",\"color\":\"");
    fb_text(CURVE_INK[c]);
    fb_text("\",\"badge\":true}");
  }
  fb_text("]}");
  writeFrameBuffer(smile_rows);
}

function onStart(): void {
  targetDays[0] = p_near_days();
  targetDays[1] = p_mid_days();
  targetDays[2] = p_far_days();
  windowPct = p_window_pct() / 100.0;
  points = i32(p_points());
  wingPct = p_wing_pct() / 100.0;
}

// onBar() runs once per bar: history rows carry an empty block and cost one read each; the live bar measures the
// chain, writes the panel frame and the card's words, or the one notice when the coin has no chain.
function onBar(): void {
  const close = bar.close();
  const t = bar.time();
  if (bar.isLast()) measured = measure(close, t * 1000.0); // the bar's open, the clock's stand-in
  if (isNaN(close)) return;
  const live = bar.isLast() && measured;
  out_atm_iv_1w(live ? cAtm[0] : NaN);
  out_atm_iv_1m(live ? cAtm[1] : NaN);
  out_atm_iv_3m(live ? cAtm[2] : NaN);
  out_skew_25d(live ? skew : NaN);
  out_wing_skew(live ? wingSkew : NaN);
  out_term_1m_3m(live && cKept[1] == 1 && cKept[2] == 1 ? cAtm[1] - cAtm[2] : NaN);
  out_expiry_days_1w(live ? cDays[0] : NaN);
  if (!bar.isLast()) return;
  if (measured) {
    writeSmile(close);
    sb_clear(); // the skew row: signed IV points (a reading inside a twentieth of a point prints as 0.0, unsigned)
    if (isNaN(skew)) sb_text("n/a");
    else {
      const tenths = Math.round(skew * 10.0) / 10.0;
      if (tenths > 0.0) sb_text("+");
      else if (tenths < 0.0) sb_text("-");
      sb_f64(Math.abs(tenths), 1);
      sb_text(" pts");
    }
    str_skew_word_sb();
    sb_clear(); // the term row: the one-month and three-month readings at the money
    if (cKept[1] == 1 && isFinite(cAtm[1]) && cKept[2] == 1 && isFinite(cAtm[2])) {
      sb_f64(cAtm[1], 1);
      sb_text("% vs ");
      sb_f64(cAtm[2], 1);
      sb_text("%");
    } else sb_text("n/a");
    str_term_word_sb();
  } else {
    sb_clear();
    sb_text("No option chain for this coin");
    str_notice_sb();
    sb_clear();
    sb_text("n/a");
    str_skew_word_sb();
    sb_clear();
    sb_text("n/a");
    str_term_word_sb();
  }
}
How it works
The chain is one input, read on the live bar. input("chain", options_chain.cells, { max_cells: 4000, venue: "deribit" }) serves the chart coin's Deribit chain, ten numbers per contract ([strike, expiry_ms, side, oi, gamma, delta, mark_iv, underlying, multiplier, vega], a BTC chain about 1,550 contracts); in_chain_cells() is the count and in_chain_view() the block in place. The chain fills the newest row only, so measure() runs under bar.isLast() and history bars draw nothing and cost nothing. The chart's own close is spot: the grid's centre, the out-of-the-money split and the at-the-money read.
Three horizons of one chain. Every distance runs from the chain's clock, the moment the chart priced the chain, never the live bar's open (which on a 1w chart can sit days back): the chart prices each contract's gamma by Black-Scholes from its mark IV and underlying when it reads the chain, so chainClockMs() solves the gamma of the contract whose delta sits nearest 0.5 for the time to expiry it implies, and the bar's open stands in only where a venue serves its own greeks. measure() collects the chain's live expiries (one inside 12 hours is settling, not a horizon), then picks for near_days, mid_days and far_days the listed expiry closest to each target, each later than the previous one. readPoints() keeps one expiry's out-of-the-money contracts (puts below spot, calls at or above), IV normalized to percent, sorted by strike, a strike listed twice keeping the heavier open interest. ivAt() interpolates between the two neighbouring listed strikes and reads NaN outside the listed range, which is how a short near curve ends where its listings end.
The frame is the pane. writeSmile() builds the smile_rows frame with the fb_* builders: points rows on a grid window_pct each side of spot, one row exactly at spot, each row [strike, iv per horizon] with null where a horizon lists nothing at that strike. Beside the rows it writes y_min and y_max (the value axis pinned to the curves, floored at 0, with room under them for the callouts and a quarter of their range over the highest wing, so it never runs under the series chips), the caption naming each drawn horizon's expiry (near 9 Oct, mid 30 Oct, far 25 Dec), the badge (the chip's word and colour) and the markers list: the dashed spot line plus one valign: "point" callout per drawn curve, pinned to the named series at the spot row, inked in that series' colour and labelled with its expiry's date and IV. panel.line draws it below the chart on a number axis with x_format: "usd", format: "%" with one decimal, chrome: "grid", smooth, glow, hover_card and legend_style: "chips", the nearest expiry the widest stroke.
Two skews, two readers. wing_skew is the chip: on the nearest drawn curve, IV wing_pct below spot minus IV the same percent above it, so the chip names the lean the picture shows; within half a point it reads "Flat skew" in slate, else "Put skew" in rose or "Call skew" in the chart's accent, the percent from spot in the text. skew_25d is the card's row: on the mid horizon (the nearest drawn one when it lists nothing), the out-of-the-money put whose |delta| sits nearest 0.25 against the call whose delta does, put IV minus call IV from the chain's own deltas; a chain that serves no deltas falls back to the Black-Scholes 25-delta strikes from the horizon's own ATM vol and time to expiry, read off the interpolated curve. A week out, the 25-delta strikes sit two or three percent from spot and miss the wings the eye reads, which is why the mid horizon, a month by default, is the quoted one and the chip reads the wings.
The card reads outputs and slots. atm_iv_1w feeds the headline tile.value, "ATM IV, near expiry", with format: "%" (two decimals, "31.37%", where the callout prints one, "9 Oct 31.4%"), in the curve's teal, with a hint that says what the number means; atm_iv_1m, atm_iv_3m, term_1m_3m and expiry_days_1w are data-only outputs beside it (the names keep the default horizons: _1w is the near one, _1m the mid, _3m the far), every one written on the live bar and NaN on every history bar. The two rows read string slots built with the sb_* builders on the live bar: skew_word ("+2.7 pts", rounded to tenths first and signed only when a tenth is nonzero) and term_word ("32.8% vs 36.5%"). The row labels name the horizons by role ("25d skew, mid", "Term, mid vs far"). look: "broadsheet" is a literal, columns: 1 and width: 300 shape the card, and position: "top_left" with safe_area: true seats it under the legend, over the oldest candles on screen instead of the newest.
The notice is a label. render.label("notice", { position: "top_right", text: "notice", offset: [12, 8], style: "knockout" }) is pinned to the top right over the notice slot, written on the live bar only when the coin has no chain, so no history bar carries text.
Where it runs
Any market whose coin Deribit lists options for (BTC, ETH, SOL and the rest of Deribit's list), on any interval: the chain is a live snapshot served by the chart, so a BTC perpetual at 15m and at 1h draw the same curves and the same numbers, and an ETH spot chart reads ETH's chain. The strike axis prints dollar strikes ("$65.0K" to "$105.0K" on a BTC chart near 85K) with the percent from spot under each tick. A coin Deribit does not list refuses the run by name before any fetch ("Deribit lists no options for coin 'X'").
When data is missing
A served coin whose chain carries no usable expiry shows the one sentence "No option chain for this coin" at the top right and draws nothing else: the frame is not written, so no empty pane mounts, the card's headline prints a dash and its two rows read "n/a". Every history bar draws nothing (the chain is the live bar's only), so the outputs carry a number on the last bar alone. Inside a drawn chain, a horizon that lists nothing at a grid strike writes null there and its curve stops at its listed range, so a near expiry that lists a narrower range than the quarter draws shorter; a horizon with no later expiry left is not drawn and the caption names only the drawn ones; the term row reads "n/a" unless both the mid and the far horizons are drawn and cover spot; the chip reads "Skew n/a" when no curve lists both wings.
Customize it
- Other horizons.
near_days(7, 1 to 30),mid_days(30, 7 to 120) andfar_days(90, 30 to 365) each pick the listed expiry closest to that many days out, at least 12 hours away and each later than the previous one; the chips keep their role names and the callouts and the caption follow the expiries read. - A wider or finer grid.
window_pct(25, 5 to 60) sets the strike window as a percent of spot on each side andpoints(41, 21 to 81) the strikes on it; one row always sits exactly at spot, where the callouts pin. - The chip's wings.
wing_pct(10, 3 to 30) sets how far from spot the chip reads its two wings; the percent prints in the chip's text. - The chip's number on the card.
wing_skewis already a data-only output: add["Wing skew", "wing_skew", "0.0"]as a third row oftile.rowsand the card quotes the picture too. - Change the look. The card's look is the literal
look: "broadsheet"(no setting binds it); the Look row on the indicator's Style page switches it without code, "As made" first, andphosphor(green mono type on near black, with scanlines) is the second look this example was shot in (The Style page, Looks).
Run it
- In the editor's Explorer, press the Templates icon ("Browse starter templates") and pick Volatility Smile under Beyond the time axis.
- Press Run on a chart of a coin Deribit lists, such as BTCUSDT at 15m: the smile pane mounts under the chart with the three curves, the spot marker, the callouts and the chip, and the broadsheet card appears at the top left of the price pane, under the legend.
- At the editor's Console prompt, type
last 20 atm_iv_1wto read the nearest expiry's at-the-money IV on the last 20 bars: only the last bar carries a number, the chain being live only.
Concepts used
- Options kit for
options_chain.cells, the ten-number contract tuple,venue,max_cells,in_chain_cells()andin_chain_view() - Cards, frames and panels for frames, the
fb_*builders andwriteFrameBuffer,panel.lineon a number axis, markers,valign: "point"callouts, badges and captions - HUD cards for
render.hud, its anchors,offset,columnsandwidth - Looks for
broadsheetandphosphorand what each draws - Blocks and tiles for the headline
tile.value, itshintandformat, andtile.rows - The Style page for the Look row that switches the look without code
- Plotting for
render.labelpinned byposition, the fixed-position text - Strings and text for the
sb_*builders andstr_<slot>_sb()