Volatility term structure
Implied volatility at one week (sky), one month (violet) and three months (teal) in their own pane.
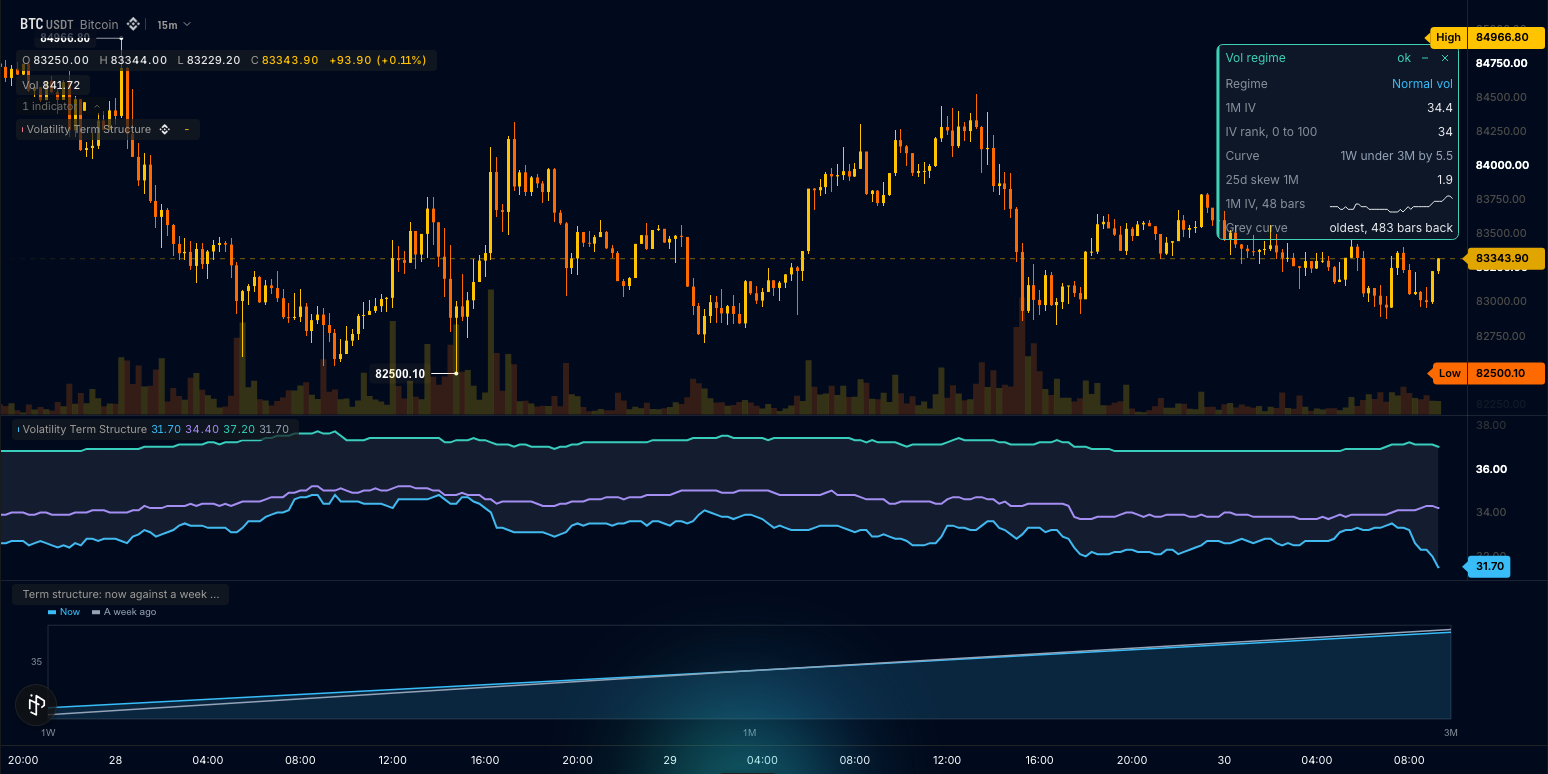
The gap between the one-week and three-month lines is tinted slate while the curve is normal and rose while it is inverted (one-week IV above three-month IV: options pricing near-term stress). On the price pane, a dot marks the bar where the curve flipped: rose when it inverted, slate when it turned normal again. Below the chart, a small curve of the three tenors now against a week ago. A card at the top right of the price pane names the regime (low, normal or high vol by the one-month IV's percentile rank over the lookback), the one-month IV and its rank, the curve's state and gap, the 25-delta one-month skew, a 48-bar sparkline of the one-month IV, and what the grey curve stands for.
The parts are three implied_volatility inputs at different tenors and a skew input (Data sources), a range between two outputs tinted by a data-only ladder (Styling), two shape outputs for the flip dots, a frame feeding a panel.line on a category axis, a draw.card with a sparkline (Cards, frames and panels) and a render.label for the one sentence on a coin without the series (Plotting). This is also the vol-term-structure template: the Volatility Term Structure card under Beyond the time axis in the editor's starter list, and it compiles as written.
The wrun indicator
// Volatility Term Structure: implied volatility at one week, one month and three months in a pane, the gap between
// 1W and 3M shaded rose while the curve is inverted (near-term stress), a small curve chart of now against a week
// ago below the chart, and a card naming the regime, the IV rank and the 25-delta skew. The trader sees whether
// options price near-term stress or calm, and how that changed over the week. A coin without the series reads one
// sentence instead of an empty pane.

param.int("lookback", 180, { min: 20, max: 2000, label: "Rank lookback, bars", description: "Bars the IV rank is measured over" });
legend({ title: "({{lookback}})" }); // the words after the name in the legend: the lookback, read by name
input("close", ohlcv.close); // the primary input: the chart's own candles define the grid the volatility series ride
input("one_week", implied_volatility.implied_volatility, { tenor: "ONE_W", description: "Implied volatility, one week" }); // carried between observations
input("one_month", implied_volatility.implied_volatility, { tenor: "ONE_M", description: "Implied volatility, one month" });
input("three_month", implied_volatility.implied_volatility, { tenor: "THREE_M", description: "Implied volatility, three months" });
input("skew_one_month", skew.skew, { tenor: "ONE_M", description: "25-delta skew, one month" });
const oneWeek = output("iv_1w", line, lower, { color: "#38bdf8", width: 2, label: "IV 1W", format: "0.0", description: "Implied volatility, one week" }); // the handle names it for the hover card
output("iv_1m", line, lower, { color: "#a78bfa", width: 2, label: "IV 1M", format: "0.0", description: "Implied volatility, one month" });
output("iv_3m", line, lower, { color: "#2dd4bf", width: 2, label: "IV 3M", format: "0.0", description: "Implied volatility, three months" });
output("inverted", none, lower, { description: "1 while one-week IV sits above three-month IV" }); // data-only: the shading's ladder and the card's tone
output("iv_rank", none, lower, { description: "Percentile rank of one-month IV over the lookback, 0 to 100" });
output("regime_tone", none, lower, { description: "0 low vol, 1 normal, 2 high vol" });
output("skew_25d", none, lower, { description: "25-delta skew, one month" });
hover(oneWeek, [block.value("IV 1W", "iv_1w", { format: "0.0" }), block.rows([["IV 1M", "iv_1m", "0.0"], ["IV 3M", "iv_3m", "0.0"], ["IV rank", "iv_rank", "int"], ["25d skew", "skew_25d", "0.00"]])]); // the card the one-week line opens under the cursor
output("stress_on", shape, overlay, { color: "#fb7185", width: 6, description: "The close of the bar where one-week IV crossed above three-month IV" }); // an event dot on price
output("stress_off", shape, overlay, { color: "#94a3b8", width: 6, description: "The close of the bar where the curve turned normal again" });
range("iv_1w", "iv_3m", { color_by: "inverted", colors: ["#94a3b81f", "#fb718538"] }); // the gap between 1W and 3M: a slate tint while normal, rose while inverted
string("regime_word", { max_bytes: 24 }); // "High vol"
string("curve_word", { max_bytes: 32 }); // "1W over 3M by 4.2"
string("compare_word", { max_bytes: 24 }); // what the grey curve is: a week ago, or the oldest bar loaded
string("notice", { max_bytes: 48 }); // the one sentence on a coin the volatility series do not cover, written on the live bar
render.label("notice_tag", { position: "top_right", text: "notice", color: "#94a3b8", style: "plain", offset: [12, 40] }); // under the pane's corner buttons
const curve_rows = frame("curve_rows", { max_bytes: 1024 }); // three tenor rows: [tenor, now, a week ago]
panel.line({ name: "term_curve", title: "Term structure: now against a week ago", x: "category", place: "below", frame: curve_rows, series: [{ name: "Now", color: "#38bdf8" }, { name: "A week ago", color: "#94a3b8" }] });
draw.card("vol_regime", {
  title: "Vol regime",
  anchor: "top_right",
  offset: [0, 40], // below the chart's own High tag, which always sits in the pane's top-right corner
  rows: [
    { label: "Regime", value: { text: "regime_word" }, color: { color_by: "regime_tone", colors: ["#94a3b8", "#38bdf8", "#fb7185"] } },
    { label: "1M IV", value: { output: "iv_1m" } },
    { label: "IV rank, 0 to 100", value: { output: "iv_rank", format: "int" } },
    { label: "Curve", value: { text: "curve_word" }, color: { color_by: "inverted", colors: ["#94a3b8", "#fb7185"] } },
    { label: "25d skew 1M", value: { output: "skew_25d" } },
    { label: "1M IV, 48 bars", spark: { output: "iv_1m", window: 48 } },
    { label: "Grey curve", value: { text: "compare_word" } },
  ],
});

const RING = 2048; const WEEK_SECONDS = 604800.0; // the rings hold the largest lookback and a week of 5m bars
const ringW = new StaticArray<f64>(RING); const ringM = new StaticArray<f64>(RING); const ringQ = new StaticArray<f64>(RING); // 1W, 1M, 3M per bar
let lookback = 180; let head = -1; let count = 0; // the ring: head is the newest bar
let t: f64 = NaN; let prevT: f64 = NaN; // this bar's open time and the previous one: together they give the bar width, so a week is counted in bars
let prevInverted: f64 = NaN; // the flip detector: the curve's state on the previous bar
let readingSeen = false; // some bar carried all three tenors: the market has the series

function round1(v: f64): f64 { return Math.round(v * 10.0) / 10.0; }

function onStart(): void { lookback = i32(p_lookback()); memory.grow(1); } // headroom for the live bar's frame string: the sandbox forbids growth after onStart()
// onBar() runs once per bar: read the three tenors and the skew, append to the rings, rank the one-month reading over the lookback;
// then the lines and the card numbers on every bar, the curve frame on the live bar only.
function onBar(): void {
  prevT = t; t = bar.time(); const close = bar.close();
  const ivW = in_one_week(); const ivM = in_one_month(); const ivQ = in_three_month(); const skew25 = in_skew_one_month(); // this bar's readings
  head = (head + 1) % RING; if (count < RING) count += 1;
  ringW[head] = ivW; ringM[head] = ivM; ringQ[head] = ivQ;
  if (isNaN(ivW) || isNaN(ivM) || isNaN(ivQ)) { // no reading on this bar: nothing is written; a coin never served one gets the sentence
    if (bar.isLast() && !readingSeen) { sb_clear(); sb_text("No implied volatility for this coin"); str_notice_sb(); }
    return;
  }
  readingSeen = true;
  let below = 0; let seen = 0; const span = lookback < count ? lookback : count;
  for (let k = 0; k < span; k += 1) { const v = ringM[(head + RING - k) % RING]; if (isNaN(v)) continue; seen += 1; if (v <= ivM) below += 1; }
  const rank = seen > 0 ? (100.0 * f64(below)) / f64(seen) : NaN; // the card's numbers: the rank, its tone and the curve's state
  const tone = isNaN(rank) ? 1.0 : rank < 20.0 ? 0.0 : rank > 80.0 ? 2.0 : 1.0;
  const inverted = ivW > ivQ ? 1.0 : 0.0;
  const stressOn = prevInverted == 0.0 && inverted == 1.0 ? close : NaN; // the event dots: the close on the bar the curve inverted on, NaN elsewhere
  const stressOff = prevInverted == 1.0 && inverted == 0.0 ? close : NaN; // the bar it turned normal on
  prevInverted = inverted;
  out_iv_1w(round1(ivW)); out_iv_1m(round1(ivM)); out_iv_3m(round1(ivQ)); out_inverted(inverted); out_iv_rank(rank); out_regime_tone(tone); out_skew_25d(isNaN(skew25) ? NaN : round1(skew25)); out_stress_on(stressOn); out_stress_off(stressOff);
  const width = isNaN(prevT) ? NaN : t - prevT; // the bar's width in seconds
  const weekBars = isNaN(width) || width <= 0.0 ? 0 : i32(Math.round(WEEK_SECONDS / width)); // bars in a week on this chart
  const back = weekBars > 0 && weekBars < count ? weekBars : count - 1; // a week back, or the oldest bar loaded
  const ago = (head + RING - back) % RING;
  sb_clear(); sb_text(tone == 0.0 ? "Low vol" : tone == 2.0 ? "High vol" : "Normal vol"); str_regime_word_sb();
  sb_clear(); sb_text(inverted == 1.0 ? "1W over 3M by " : "1W under 3M by "); sb_f64(Math.abs(ivW - ivQ), 1); str_curve_word_sb();
  sb_clear(); if (back == weekBars) sb_text("a week ago"); else { sb_text("oldest, "); sb_int(back); sb_text(" bars back"); } str_compare_word_sb();
  if (bar.isLast()) {
    writeFrame(FRAME_CURVE_ROWS, "{\"rows\":[[\"1W\"," + round1(ivW).toString() + "," + (isNaN(ringW[ago]) ? "null" : round1(ringW[ago]).toString()) +
      "],[\"1M\"," + round1(ivM).toString() + "," + (isNaN(ringM[ago]) ? "null" : round1(ringM[ago]).toString()) +
      "],[\"3M\"," + round1(ivQ).toString() + "," + (isNaN(ringQ[ago]) ? "null" : round1(ringQ[ago]).toString()) + "]]}");
  }
}
How it works
Tenors are inputs. input("one_week", implied_volatility.implied_volatility, { tenor: "ONE_W" }) and its ONE_M and THREE_M twins ride the chart's grid, carried between observations; skew.skew at ONE_M is the 25-delta skew. iv_1w, iv_1m and iv_3m plot in the lower pane; skew_25d is data-only.
Inversion is a ladder. inverted is 1 while one-week IV sits above three-month IV; range("iv_1w", "iv_3m", { color_by: "inverted", colors: [slate, rose] }) tints the gap from it. stress_on carries the close on the bar the curve inverted (a rose dot on price) and stress_off the close where it turned normal again; both are NaN elsewhere.
Rank is the regime. iv_rank is the percentile rank of one-month IV over lookback (180) bars, 0 to 100; regime_tone reads 0 low vol, 1 normal, 2 high vol from it, and the card's title takes the tone. The card's value cells are text slots written on the live bar; the one-month IV feeds its 48-bar sparkline.
A week ago is counted in bars. The bar width from consecutive bar.time() readings turns a week into a bar count; frame("curve_rows") carries the three tenors now and a week ago and feeds panel.line on a category axis below the chart.
Where it runs
BTC and ETH charts on any venue (the volatility series follow the chart's coin). On a Polymarket market the lanes answer with BTC's series (the chart has no coin, so the lane falls back to BTC): the pane then shows BTC's curve, not the market's.
When data is missing
Other coins, FX and stocks have no volatility series: the run stops with the toast Implied volatility data is unavailable for '<title>' (the deribit_implied_volatility source lane answered empty or was declined), so the indicator cannot compute., where <title> is the tab's title. If a chart of such a coin does run, no bar carries a reading and nothing is drawn: the live bar writes the one sentence No implied volatility for this coin at the top right of the pane, 40 px down so it clears the pane's corner buttons (render.label("notice_tag", { position: "top_right", text: "notice", offset: [12, 40] })), instead of leaving an empty pane. Bars before the first volatility observation draw nothing; when the loaded history is shorter than a week the grey curve is the oldest bar loaded and the card's "Grey curve" row says "oldest, N bars back".
Customize it
- Other tenors. The chart serves five tenors,
ONE_W,ONE_M,TWO_M,THREE_MandSIX_M; this example reads three of them, andONE_D,THREE_DandONE_Yare refused by name. For a two-tenor view, drop one input together with its line and its labels. - Another wing. The card's skew is the one-month skew at 25 delta, the default;
delta: 5,15or35on theskewinput reads another. - A longer rank.
lookbackup to 2000 bars. - A month ago. Change the bar count behind the grey curve from a week to a month.
Run it
- In the editor's Explorer, press the Templates icon ("Browse starter templates") and pick Volatility Term Structure under Beyond the time axis.
- Press Run on a BTC or ETH chart: the three tenors draw in their pane, the curve below the chart and the card at the top right.
- At the editor's Console prompt, type
last 20 iv_rankto read the one-month IV's rank over the last 20 bars.
Concepts used
- Data sources for the
implied_volatilityandskewsources and thetenorword - Styling for
rangebands and colour ladders - Cards, frames and panels for frames,
panel.line,draw.cardand sparklines - Plotting for
render.labelpinned byposition, the one sentence