The editor
The chart's editor is where you write a wrun indicator: New indicator starts a file in TypeScript syntax, Run compiles it in your browser and draws it on the chart, the Console shows what stopped a run and what your file printed, and Publish puts a version on the OpenMarket registry.
This page walks through every control, in the order you meet them.
- The Explorer on the left: New indicator, the Templates icon beside it, and the tab's draft listed under them.
- The tab strip, then the toolbar: the Run on chip (Browser), the save icon, Publish, Docs and Run.
- The buffer with the Moving Average starter, the status bar under it (slots, line and column), and the Console with the run's receipt (Added "Moving Average" to the chart) and the prompt line.
- On the chart, the drawn line on the price pane.
Open it
- On the chart toolbar, press Editor (the code icon). When it is not pinned to the toolbar, it is in the Panels menu. The editor needs a signed-in account with a verified email.
- The toolbar's Indicators button opens the Indicators dialog. Its Indicators tab lists what you can add straight to the chart (OpenMarket, Community, and Mine when you are signed in). The lightning icon in the dialog, Build, closes it and opens the editor.
New indicator and the template picker
The editor's Explorer lists your indicators. New indicator at its top opens a new tab with the New indicator list over it ("Pick a starter, or begin with a blank tab."): pick a card and its complete file fills the tab, or pick Blank indicator for a tab that holds only the language marker. The Templates icon beside New indicator ("Browse starter templates") opens the same list on any tab you can edit. A pick fills an untouched new tab in place; on any other tab it opens in a new tab. The search box filters the cards by title and by the line under it, which says what the card draws.
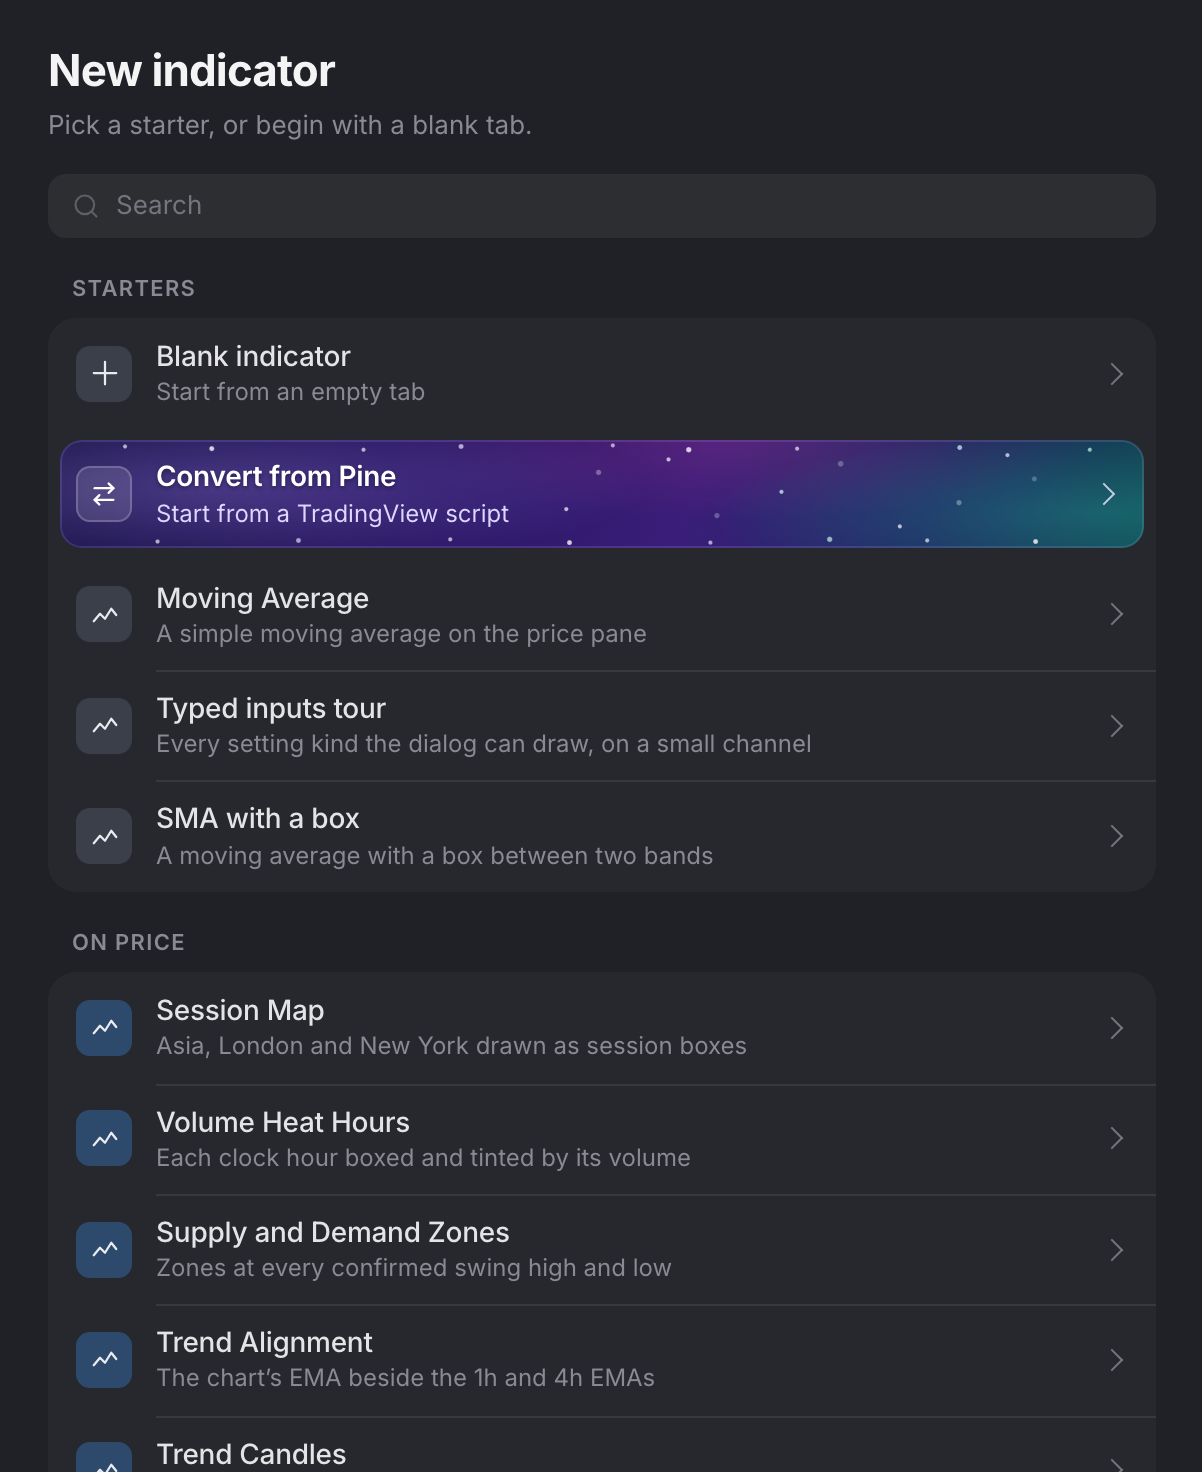
- The search box filters every group at once.
- Starters lead: Blank indicator for the marker alone, Convert from Pine for a TradingView script, then the three starter files.
- Each row names what the card draws on its second line; the groups below follow the table's order.
| Group | Cards |
|---|---|
| Starters | Blank indicator, Convert from Pine, Moving Average (sma-codefirst), Typed inputs tour (typed-inputs-tour), SMA with a box (sma-box) |
| On price | Session map (session-map), Volume heat hours (volume-heat-hours), Supply and demand zones (supply-demand-zones), Trend alignment (trend-alignment), Trend candles (trend-candles), Strike matrix (strike-matrix), Session OI levels (session-oi-levels) |
| Order flow | CVD divergence (cvd-divergence), Positioning regimes (positioning-regimes), Absorption (absorption), Liquidation bursts (liquidation-bursts), Book heat (book-heat), Liquidation heat (liquidation-heat), OI liquidation heat (liquidation-heat-oi), Volume footprint (volume-footprint), TPO letters (tpo-letters), Session volume profile (session-volume-profile), VP Buy Share (vp-buy-share-codefirst) |
| Prediction markets | Odds vs price (odds-vs-price), Polymarket YES Odds (polymarket-odds), BTC Threshold Conviction (conviction-score), Event Asset Divergence (event-asset-divergence) |
| HUDs | Market HUD (market-hud), Decision board (decision-board), Order flow HUD (order-flow-hud), Order book HUD (order-book-hud), Session HUD (session-hud), Gamma map (gamma-map) |
| Beyond the time axis | Volume profile and value area (volume-profile-value-area), Volatility term structure (vol-term-structure), Options dashboard (options-dashboard), ETF flows (etf-flows), Liquidation map (liquidation-map), Options odds cloud (options-odds-cloud), Who is trading (whos-trading), Rotation map (rotation-map), Volatility smile (vol-smile), Correlation matrix (correlation-matrix), Venue share (venue-share), Volatility surface (iv-surface), Seasonality grid (seasonality-grid), Depth curve (depth-curve), Yield curve (yield-curve) |
| Strategies | Moving-average cross (strategy-ma-cross), Risk-sized reversion (strategy-risk-reversion) |
Moving Average is a complete moving average with a comment on every
statement, and New indicator seeds a new tab with it. The Strategies
group shows where the chart offers the Strategy Tester. A linked card has a
worked page in the Cookbook. The three
Polymarket cards (Polymarket YES Odds, BTC Threshold Conviction, Event Asset
Divergence) ship with a placeholder market: Run refuses until you paste the
market's condition id (0x followed by 64 hex characters) into the odds
input's symbol.
The language marker
The first non-blank line of an indicator tab is the language marker. A card or Blank indicator writes it, and it is how the editor knows the tab holds a wrun indicator; leave it there and write under it:
//@lang=wrun-tsOne indicator is one file: a //@file= line is refused ("One file per
indicator for now.", with the file to move into the tab). There is nothing
to import: the kit's classes and the readers and writers generated from
your declarations are there by name, and an import line you write anyway
resolves only to the kit's ./sdk/... modules and the generated
./gen/... accessors (Reuse and libraries).
Write
As you type, the editor compiles the file in the background and marks each
problem with a squiggle. It completes names, shows types on hover and
signature help while you fill in arguments, and F12 jumps to a
definition, into the kit's own read-only files when the name lives there.
Docs in the toolbar opens these docs in a new tab, on the page for the
word under the cursor when it has one: a TA class opens the TA library,
param or output the script definition, a drawing word the drawing
guide.
Run
Run compiles the file in a Web Worker in your browser with AssemblyScript 0.27.37, the compiler the kit pins, and reuses the compile that already ran as you typed; builds are cached in the browser and reused while the kit and the compiler stay the same. The module runs in a sandboxed worker, and the computation never leaves your browser: the only network traffic is the data your inputs declare (the candles come from what the chart already loaded) and a one-time download of the compiler. A compile gets 15 s and a run 20 s before the editor stops it.
Where the draft goes:
- On the price pane when any drawn output declares
overlay; a strategy always goes there. - Otherwise in its own pane when the first output declares
lower. - An indicator on the price pane with a drawn
loweroutput also gets a pane below.
Running again replaces the tab's previous overlay. A draft overlay lasts for the session and is not saved with the layout (Run again after a reload), and it takes one of the chart's indicator slots. On the live bar it refreshes at most about once a second: updates in between are folded together, and the last one always lands.
The Run on chip in the toolbar picks Browser (the default) or Cloud. Cloud runs the published indicator on OpenMarket's servers, and it is offered only for an indicator published as Never leaves OpenMarket whose published version matches the file; otherwise it says "Publish first", "Publish the current version first", or "Runs in the browser. Only a Protected Indicator runs in the cloud." On a CME market Run is paused ("Run is paused on CME markets. Switch to a non-CME symbol to run this script.").
A file that declares strategy(...) labels the button Backtest: the
draft goes on the price pane, and the chart's Strategy Tester shows its
trades and stats (Strategies overview).
Settings
Every setting is a row in the overlay's settings dialog, drawn as the
control its kind names: a number field for param(...) and param.int,
a toggle for param.bool, a menu for param.choice, a color picker for
param.color, a market button for param.symbol, and so on, labelled by
its label (else its description, else its name) and bounded by the
min and max you declared. page(...) and section(...) lay the rows
out as pages in the dialog's rail, and presets(...) adds a strip of
named settings sets (The settings dialog).
Changing one reruns the compiled module over the loaded bars without
compiling again; to change what a row offers, edit the declaration and
Run again. An output's color, width, opacity and line style come from its
declaration, and the dialog's Style page lets the user change them per
output. The dialog also has Plot Settings, Visibility (by
interval) and Price marker under a Chart caption.
The Console
When Run stops before the chart changes, the reason is in the editor's Console, tagged with the stage that produced it, and one problem hides the ones behind it. The status bar counts errors and warnings (click the count, Open Problems, to open the Console), and a blocked Run says how many errors must be fixed first.
| Stage | What it checks | Typical message |
|---|---|---|
declarations | the param / input / output / shape statements, read from the text | This indicator declares nothing. Add param(...), input(...), and output(...) statements (imported from ./sdk/declare) at the top level of the source; the metadata sheet is derived from them. |
lint | raw positional slot literals in your source | Raw slot literal 0 passed to getFloat(): raw positional slots rebind silently when the sheet changes |
metadata | the sheet derived from your declarations, against the schema | Output 'my value' has a name the sheet refuses: use letters, digits, dots, dashes and underscores, starting with a letter or digit (no spaces). |
compile | the AssemblyScript compiler, with a hint beside its message | Conversion from type 'f64' to 'i32' requires an explicit cast. |
validate | the built module against the four-export contract and the sandbox | console.* is not available in an Indicator (it runs in a sandbox with no console). Log through the debug output instead: ... |
compute | after Run, what the run produced | Output 'sma' is NaN on all 480 ready bars, so nothing is drawn for it. |
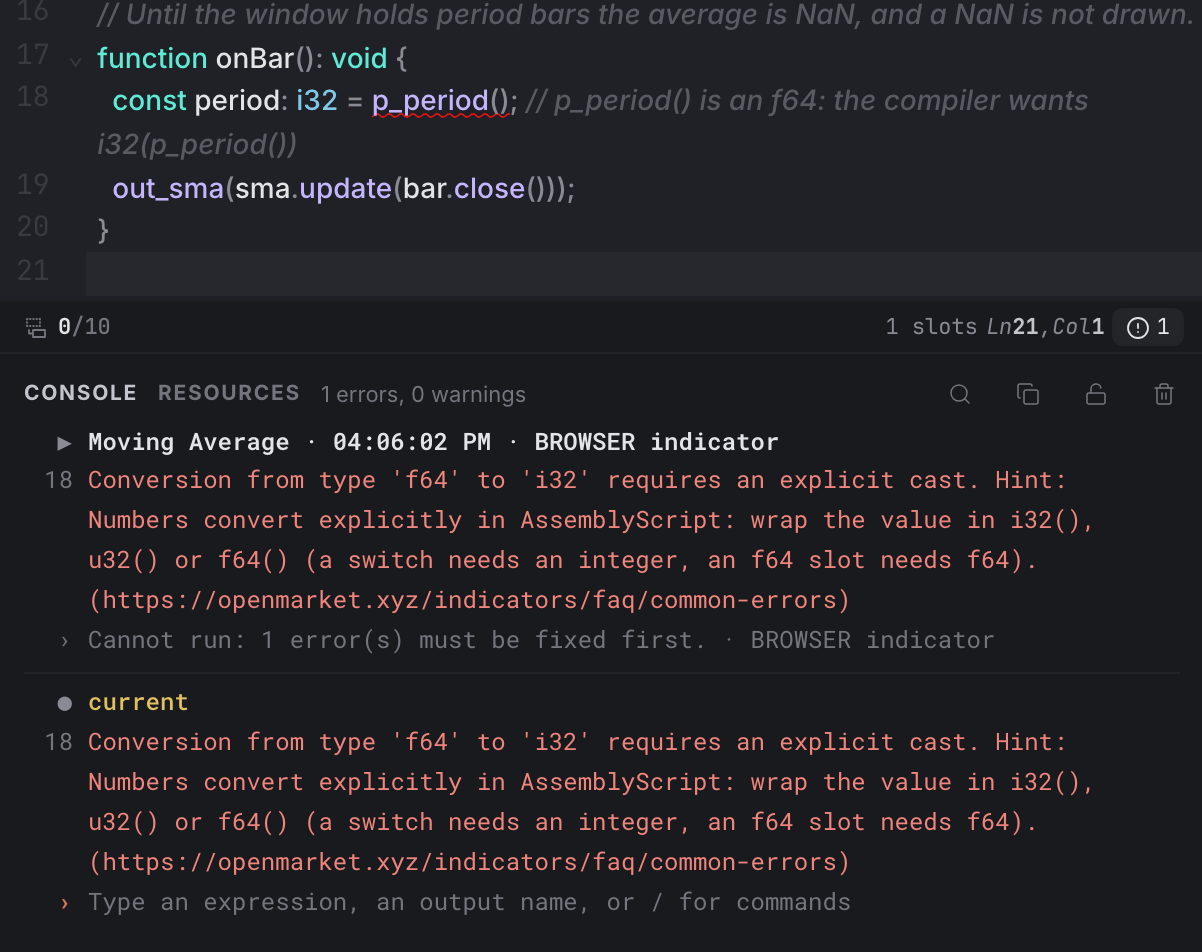
- The buffer underlines the expression the compiler refused; the Console prints the same line number in front of the message.
- The hint after the message names the fix, and the link opens Common errors.
- "Cannot run: 1 error(s) must be fixed first." is the blocked Run; the circled count at the right of the status bar is Open Problems, and the current block under the run is what it shows.
- The prompt line stays under the Console.
Fix the first one and Run again; Common errors
lists the messages with their fixes. A run that reaches the chart and draws
nothing is usually not an error: an output left NaN on every bar (a
warm-up that never ends), an output declared none, or a source the
chart's market does not serve, for
which the legend shows a Could not load chip with the reason and
Retry, and the Console shows the same sentence
(Debugging).
To print from the module, declare a text slot named debug
(string("debug", { max_bytes: 256 })) and write it from onBar()
through the generated str_debug(text) sender: the Console prints each
non-empty line after the bar's time in ISO 8601 UTC
(Debugging).
The prompt under the Console ("Type an expression, an output name, or / for
commands") compiles one expression into your current file and runs it over
the chart's candles without drawing anything. It also reads your last run:
rows, params, outputs, sheet, an output by name, <output>[-n] for
n bars back, last N <output>, and at <ISO time> <output>. /help lists
its commands. A strategy, or a file with an input other than candles and
time, is refused at the prompt.
Save and copy
The editor saves a changed tab to your account about 1.2 s after an edit, or at once with the save icon (Save now). The first save creates a private draft in your account, which counts against your plan's limit of saved scripts (Plans). Your indicators are listed in the Explorer, where a published one carries a package icon ("Published as" and its name), and under Mine in the Indicators dialog, where a draft reads "Draft: publish it from the editor".
- Copy for LLM (right-click the tab, or the command palette) copies one Markdown block: a short rules primer, the kit's API one line per class, your numbered source, every problem with its stage, the last run's status with up to 40 debug lines, and the sheet from the last good build (Write it with AI).
Publish and alerts
Publish opens the Publish Indicator dialog once the current code
has no errors; you need to be signed in, and the draft is saved first. You
type the name after @yourname/, the first version is 0.1.0, and you choose
Who can use it (Everyone, Invite only, Just me) and Code
(Protected, Compiled, Open source), which also decides whether the
indicator runs on OpenMarket's servers or in each reader's browser. On the
receipt, Open on chart adds the published version to the chart. From
then on the button reads Publish a new version: pick Patch,
Minor or Major and write one line on what changed
(Publishing).
On an Invite only indicator, People beside Publish opens its People panel, where you invite people and see who has access (Sharing).
A published indicator on the chart can carry alerts: open the alert dialog
from its bell in the legend, the right-click menu, or Alert on >
Indicators in the sidebar, pick an output or a signal the file declares
with alert(...), and a condition. OpenMarket's alerts engine evaluates it
in the cloud with the overlay's settings; a draft is refused with "Publish
the Indicator before adding an alert." (Alerts).